STAT exam 1
 Call Kai
 Learn
Learn Practice Test
 Spaced Repetition
 Match
Match Flashcards
 Knowt Play
1/62

There's no tags or description
Looks like no tags are added yet.
Name | Mastery | Learn | Test | Matching | Spaced | Call with Kai | Chat |
|---|
No analytics yet
Send a link to your students to track their progress
63 Terms
What is statistics?

Statistics is about….variation.

General Terms (3)
Population
Sample
Case
Population
group of all cases that the sample was selected from
i. “All ...”
Sample
group of cases that we collect data from
i. “Number of Sample ...”
Case (Unit
who or what we collect data from
i. “A ...”
Variables
Categorical
Quantitative
Explanatory
Response
Categorical:
Each case is assigned to a specific group or category (eye color,
letter grade, etc.)
“What type?”
Quantitative:
Requires measurement and has units, a numerical amount
(weight, height, etc.)
“How much/how many?”
Explanatory:
used to try to explain the variability in the response values.
1. “________ (explanatory variable) is the explanatory variable
because it is predicting __________ (response variable).”
Response:
an outcome variable on which comparisons are made.
1. “__________ (response variable) is the response variable because
it is being predicted.”
Types of Analysis
Descriptive
Inferential
Descriptive:
A technique that summarizes both old and new data to identify trends and patterns.
1. Just a description of what the data says, not drawing conclusions or making decisions based on the data
Inferential:
uses samples of data to make inferences, predictions, andgeneralizations of the entire population.
1. Can make decisions based on data
Types of Studies
Experimental vs. Observational
Experimental:
1. Random assignment is present → it is an experiment
a. Treatment that is randomly assigned
b. Active manipulation
Observational:
1. No random assignment present → it is an observational study
a. Even if there is a treatment being manipulated, no random assignment then it MUST be observational
Differences between Experimental vs. Observational:
i. Presence or lack of randomly assigned treatment
ii. When asked: “Is this study an experiment or an observational study?”
...
1. Experiment: “It is an experiment because the treatment was randomly assigned”
2. Observational Study: “It is an observational study because there was no random assignment of treatment”
Types of Conclusions & How they Relate to Randomness
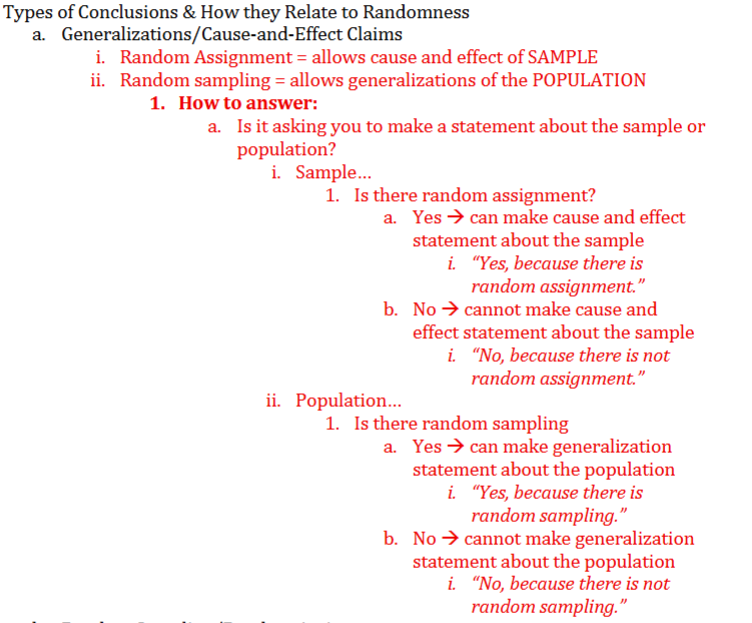
Random Assignment
1. How treatments are being assigned to people already in the sample
2. Random assignment ensures any confounding variables are balanced in the sample, so the only difference between groups is the manipulated treatment
allows cause and effect of SAMPLE
Random sampling
1. Who is being pulled to be in the sample
2. Random sampling ensures the sample accurately represents the population of choice
allows generalizations of the POPULATION
Observational Studies have… (4)
a. Sample Surveys
b. Sampling Techniques (Positives/Negatives)
c. Bias – What is it?-
d. Retrospective vs. Prospective
Types of Sampling Techniques (Positives/Negatives)
Simple Random Sample (SRS)
Stratified Sample
Cluster Sample
Simple Random Sample (SRS):
Each combination of cases has the same chance of being included
Stratified Sample:
Divide population into strata (where everyone in each strata has some similarity) and select a SRS from each strata
Cluster Sample:
Divide population into clusters with mix of representatives (each cluster should be a mixed group of subjects, no key similarity linking them), select clusters at random
Types of Bias: (3)
Sampling Bias
Non-response Bias
Response Bias
Bias – What is it?-
the systematic error that leads an estimate to differ from the true value of the parameter being measured
Sampling Bias:
occurs when the sample collected is not representative of the population, leading to distorted or inaccurate conclusions.
Non-response Bias:
occurs when individuals selected for a survey or study do not respond, and their non-participation is related to the subject of the study
Response Bias:
bias occurs when participants in a survey or study give inaccurate or false answers, often due to the wording of questions, social pressure, or misunderstanding
Retrospective:
study that looks backward, old/previous data that we can observe and understand
Prospective:
study that looks forward, new/future data that we will collect and make predictions
Experiments (3 parts)
a. Understand process & flow of experiment
b. Terms
c. Designs
Experiment terms: (9)
Factor
Levels
Treatment
Experimental units
Response
Control (2 types)
Randomness & their Purpose (2 types)
Replication (2 types)
Blinding
Factor:
a. Explanatory variable(s), what you manipulate
i. If only 1 factor in experiment → levels and treatment will be the exact same
Levels:
Values used within a factor, at least two for each factor
Treatment:
The combination of factors and levels given to experimental units
i. For 2+ factors, this will be every possible combination of levels between each factor
Experimental units:
What the treatment is being applied to (and what is giving us a response)
Response:
What is being measured after treatment has been applied
i. Quantitative or categorical
Control (2 types):
a. Control group (what we compare against, as a baseline to the treatment group)
b. Control of outside variables (via random assignment, making control and treatment groups identical, besides the treatment)
Randomness & their Purpose (2 types):
Random Assignment (balance out confounding variables)
Random Sample (accurate representation of the population)
Replication (2 types)
a. Multiple replicates (multiple cases) within an experiment/experiment group
b. Repeating the entire experiment
Blinding:
Who has knowledge of the treatment applied
Designs (3)
(see flow charts in the lecture notes for better understanding)
Completely Randomized Design (CRD)
Block Design
Matched Pairs Design
Completely Randomized Design (CRD):
One sample group, random assigned to treatments, compare the responses between the treatment groups
Block Design:
a. Identifiable difference between experimental units used to separate experimental units into different groups
b. Similar to CRD, but subjects are blocked and then each block gets a CRD
Matched Pairs Design:
a. Each experimental unit gets both 2 treatments OR experimental units are paired by similar characteristics, and each gets one of the treatments
Displaying Single Variable Data (3)
Bad vs Good Graphs
Categorical
Quantitative
Bad vs Good Graphs:
Bad Graph:
1. Not labeling axis
2. Inconsistent scale
3. Using 3D images
4. Pie Charts
5. Not starting at zero
Good Graph:
1. Don’t do the above
Categorical Graph:
Pie Chart, Bar Graph
1. DO NOT describe shape/center/spread/outliers of this
(note): Order of bars doesn’t matter here, so describing how it looks isn’t useful
If asked to describe Categorical Graph:
1. Just describe the different heights of bars between categories and how they compare (what is highest, lowest, etc.)
2. Example: “______ (category with highest bar in bar graph) had the highest probability (or percentage or counts) of _____ (value of highest bar), next was ___________ (category with second highest bar in bar graph)…”
Quantitative Graph: (3 types)
Dot plot (Good for small sample size),
Histogram (Good for medium-large sample sizes),
Box plot (link to 5-number summary)
If asked to describe Quantitative Graph: (must hit all 4 descriptors)
Shape
Center
Spread
Outliers
Description example for Quantitative graph data:
“The distribution of ________ (quantitative variable) is ___________(shape: approximately bell-shaped OR left/right-skewed) with a __________ (center: mean OR median) of _________ (value of mean OR median, WITH UNITS) and a _________ (spread: IQR OR standard deviation) of ___________ (value of IQR OR standard deviation, WITH UNITS). There are _________ (presence of outliers) outliers.”
a. ALERT: Do not mention “center” or “spread” by name, only use name of your choices based on the shape/outliers
b. Summary Stats
Summary Stats (5)
Mean & Standard Deviation
Median & IQR
5-number Summary
Which measures of center and spread are appropriate?
Resistant Statistics
Mean:
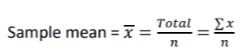
Standard Deviation:

Median:
Median = middle value
IQR :
IQR = Q3-Q1
5-number Summary:
(this is going from smallest to largest in quartiles.)
1. Minimum, first quartile, median, third quartile and maximum
2. In JMP output, reported to the right of the histogram
Which measures of center and spread are appropriate?
1. Skew and/or outliers = median and IQR
2. Bell shaped AND no extreme outliers = mean and standard deviation
Resistant Statistics:
1. Median and IQR are resistant statistics, meaning they are better at being unaffected by skewness and outliers