Topic 4: Risk, Return and Minimum-Variance Portfolios
1/51
There's no tags or description
Looks like no tags are added yet.
Name | Mastery | Learn | Test | Matching | Spaced | Call with Kai |
|---|
No analytics yet
Send a link to your students to track their progress
52 Terms
Why is investment important?
Helps future accountants and finance professionals advise business and clients on optimal investment strategies.
It builds the ability to assess, quantify, and mitigate financial risks
Define a Stock, Bond and Corporation
Stock – a security that gives some ownership (also called equity)
Bond – a security that represents a loan or debt
Corporation – a type of company with many owners (stockholders)
Suppose you sell 1,000 shares to an investor for £10,000 and you keep 1,000 shares (to pay for your time)
Suppose you borrow £5,000 from a bank (sell them a bond) for a one year at 10% interest: total investment: £25,000.
If you make £29,500 and close the company, what would you do with the money?
Pay £5,500 to the bank → principal + interest
pay £12,000 to your investor
Pay £12,000 to yourself-
What percentage return did the investment earn?
12000-10000/10000 = 20 %
Return is just percentage change in value – can be positive or negative
Security values are what you can sell them for
What return did the bank earn?
You and your investor earned 20%, while the bank only got 10%.
Suppose you decide to grow your company instead of closing it after 1 year.
You have great success – everyone wants to be an egg producer.
You decide you will need 5 stores, 7 new chicken coops, and 50 employees
What will you do?
can find new stockholders
Have an initial public offering (IPO)
Get listed an a stock exchange NYSE or Nasdaq (in the US) LSE (in the UK)
Get a ticker symbol (maybe Hei?)
Track your company value every day
Use the money you get to grow the business
Who decides what your stock is worth?
people buying/selling your stock (links to S/D)
What makes your stock’s value change from day to day?
Lots of types of news affect the value of your company from day to day
Firm-specific news, like how much money you make, can drive your stock price up or down
Market news, like how the entire economy is doing, can also move prices
Prices on any given day move up or down together
Returns across stocks are correlated with each other
To keep track of how the stock market is doing, what do people calculate?
indices/averages of returns
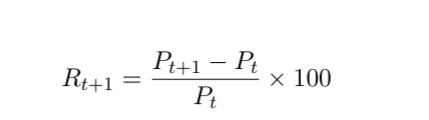
What is a return?
Let’s say you paid Pt in date t for an asset
In date t + 1 the price P is Pt+1
Then, the return is:
simply a normalisation of the “pound gain” by the cost of the asset
How Returns are Distributed?
The distribution of returns describes how investment returns are spread out or arranged across different values
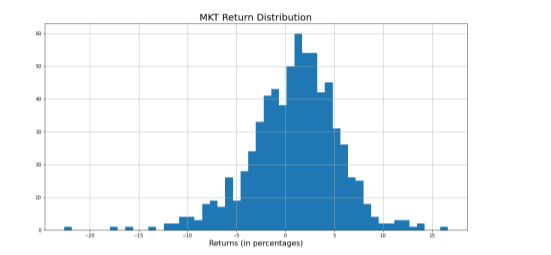
identify three features that are noteworthy about this plot
It is centered around the 0% and 2%.
It has a shape, and most extreme observations are on the side of the plot
Can we measure the features of the plot?
calculate the sample moments of the distribution of returns for the “market” portfolio.
Define Moments in statistics
ways to describe the shape and features of a data
distribution.
Calculate the mean of the return distribution
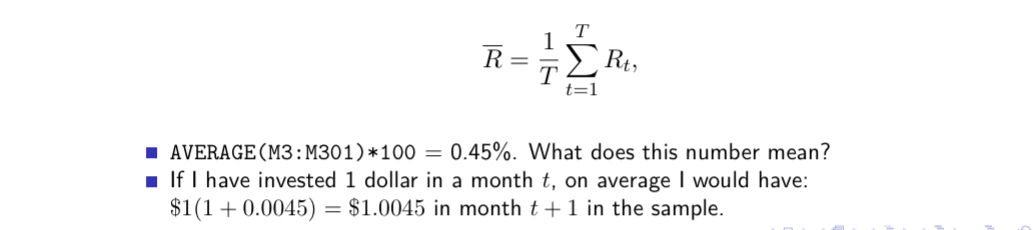
Calculate the SD of the return distribution
STDEV.S(M3:M301)*100 = 6.32%. What does this number mean?
If I invest all my wealth, say $100K in the market in month t, then the standard deviation of my wealth in date t is 4.51% in the sample.
In a normal distribution, about 68% of outcomes would fall within one standard deviation of the mean.
The expected value in t + 1 would be about $100,910.
About 68% of the time, your ending wealth would fall between $96,400 and $105,420,
i.e., –3.6% and 5.42%.

What does skewness tell us about a return distribution?
Skewness measures asymmetry in returns:
SK = 0: symmetric distribution
SK > 0: longer right tail (higher chance of extreme gains)
SK < 0: longer left tail (higher chance of extreme losses)
A dataset of returns has skewness of −0.61. What does this indicate?
distribution has a longer left tail, meaning there is a higher probability of extreme losses.
What does kurtosis tell us about a return distribution?
Kurtosis measures tail thickness:
KU = 0: normal tails
KU > 0: fat tails (more frequent extreme outcomes)
KU < 0: thin tails (less frequent extreme outcomes)
A dataset of returns has excess kurtosis of 2.57. What does this indicate?
The distribution has fat tails, meaning extreme returns (crashes or booms) are more likely than under a normal distribution.
How can skewness and kurtosis together describe how returns are distributed?
Skewness shows the direction of asymmetry (risk of extreme gains vs. losses), while kurtosis shows the likelihood of extreme returns.
Together, they reveal that returns are not perfectly normal and can have higher risk of extreme events.
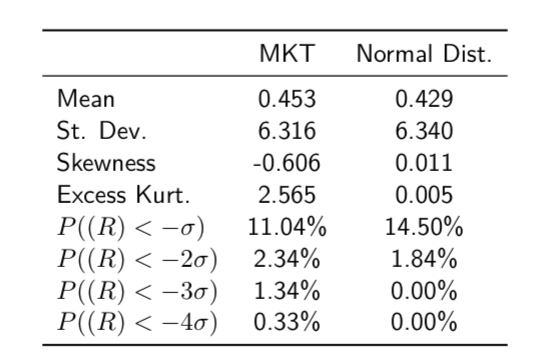
Look at the data, what does the normal distribution show?
decent approximation for market returns;
however, it fails to replicate the extreme events we observe empirically.
What are the two main sources of risk for a company?
Firm-specific risk, also known as idiosyncratic risk, refers to the risk unique to a specific company.
Market-risk, also known as systematic risk, refers to the risk that affects the entire market or a broad segment of it.
Can you eliminate risk?
Only idiosyncratic risk through diversification.
Define diversification
combining assets in a portfolio to reduce total risk without sacrificing too much portfolio return
Definition of a portfolio
collection of assets, characterised by the mean,
variances/covariances of their returns
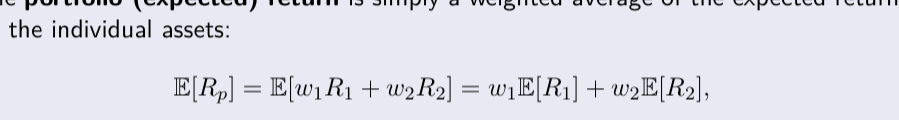
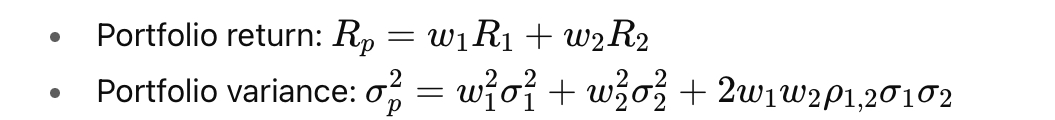
Definition of portfolio (expected) return
weighted average of the expected returns on the individual assets:
w1 and w2 are weights following the following properties:
0 ≤ w1 ≤ 1 and 0 ≤ w2 ≤ 1
w1 + w2 = 1
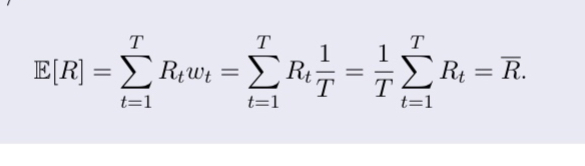
Define expectation operator
generalisation of the weighted average.
assuming weights as wt = 1/T:
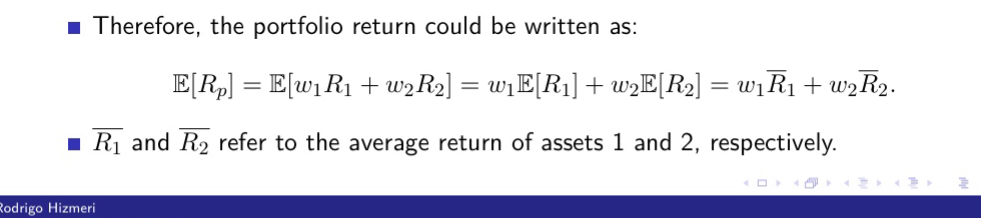

Define variance of a portfolio
weighted average of variances and covariances
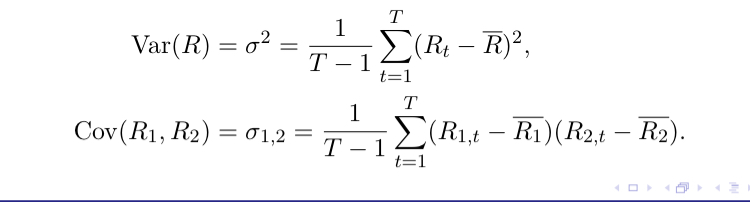
variance of an asset is computed as:
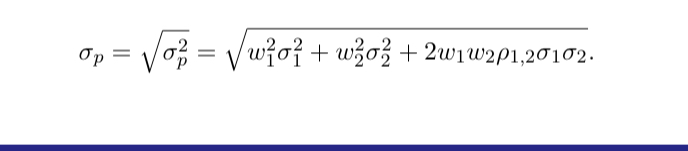
standard deviation of the portfolio is:
σ2/1 and σ2/2 are respectively the variance of assets 1 and 2.
w1 and w2 are weights.
ρ1,2 denotes the correlation coefficient.
correlation
tells us whether two variables tend to move together, in opposite directions or independently.
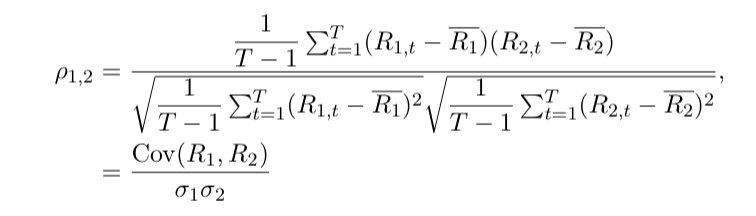
correlation coefficient is estimated as:
Covariance is positive (negative) when bad and good outcomes for each asset tend to occur together (at dissimilar times).
Correlation is a measure of standardised covariance ranging from −1 to 1.
The concept of risk in a portfolio, relates to what?
return from a portfolio is not constant over time
What happens to portfolio risk and return when two assets are perfectly positively correlated (ρ = +1)?
Portfolio return is the weighted average: Rp =w1 R1 +w2 R2
Portfolio risk is also the weighted average: σp =w1 σ1 +w2 σ2
No diversification benefit: investing in both assets does not reduce risk.
How do combinations of two perfectly positively correlated assets appear in risk-return space?
portfolio combinations lie on a straight line between the two assets, reflecting linear weighting of risk and return.
Q: Why doesn’t perfect positive correlation reduce portfolio risk?
the assets move exactly together, so combining them doesn’t cancel out any fluctuations
risk is just the weighted average of individual risks.
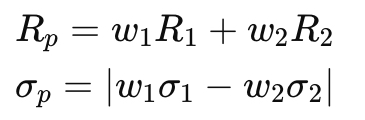
How does perfect negative correlation affect portfolio risk?
Rp=w1R1+w2R2
There exists a combination with zero risk:w1 =σ2 /(σ1 +σ2 )
All portfolio combinations lie on two straight lines in risk-return space
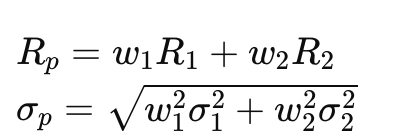
What happens to portfolio risk and return when two assets are uncorrelated?
Portfolio combinations lie on a curved line between the straight-line extremes of ρ = +1 and ρ = −1
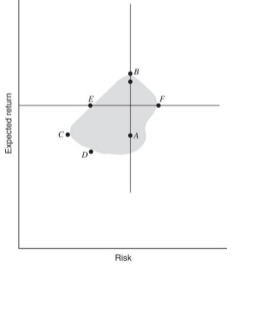
plot depicts all possible portfolios or assets in the risk-return space
B and A have the same risk, but A has higher
return. C and A have the same return, but C has
lower risk.
D and E have the same risk, but E has higher
return.
Therefore, C is called the global minimum
variance portfolio, and B is the maximum return
portfolio.
plot depicts all possible portfolios or assets in the risk-return spac
B and A have the same risk, but A has higher
return. C and A have the same return, but C has
lower risk.
D and E have the same risk, but E has higher
return.
Therefore, C is called the global minimum
variance portfolio, and B is the maximum return
portfolio.
efficient frontier consists of the curve that is
formed between the global minimum variance and
the maximum return portfolio.
When correlation between assets is ρ1,2 < +1, the efficient frontier forms from all possible combinations of those assets. Meaning?
Lower correlation: stronger diversification benefit
Imperfect correlation allows reduced risk without sacrificing expected return.
How are the return and variance of a portfolio composed of two risky assets calculated?
What is the objective when constructing a minimum-variance portfolio?
To find the weights w1 and w 2 that minimize portfolio variance, subject to w1+w2=1
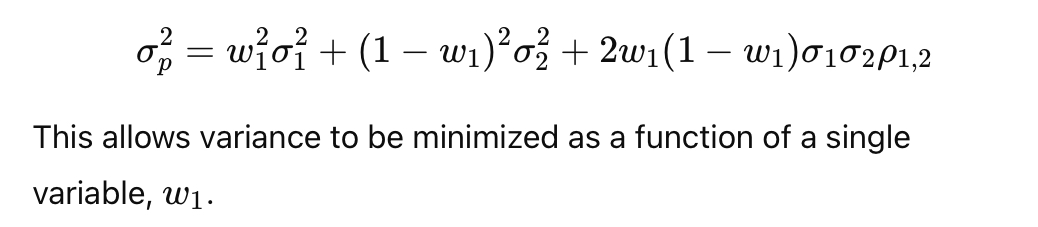
How can the portfolio variance formula be simplified using w2= 1 - w1?
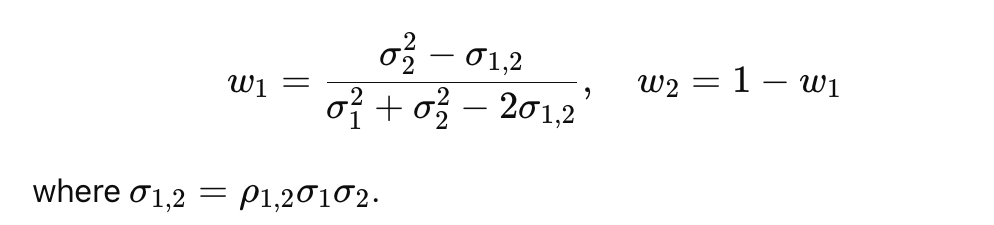
What are the weights for a minimum-variance portfolio of two risky assets?
Why is the minimum-variance portfolio important in diversification?
identifies the exact combination of assets that minimizes risk, showing the benefit of diversification even with risky assets
ETF definition
investment fund traded on stock exchanges, much like stocks.
ETFs typically aim to track the performance of a specific index, sector, or asset class.
What is SPY ETF?
ETF that aims to track the performance of the S&P 500 index.
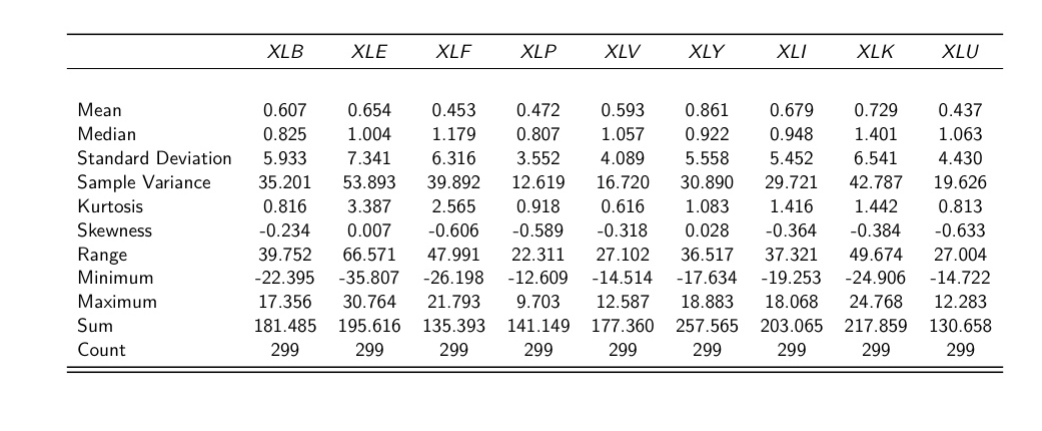
The assets with the highest return are: XLY, XLK, and XLE.
The most volatile assets are: XLE, XLK, and XLF.
All assets have excess kurtosis greater than 0, and most exhibit negative skewness.
What does this show?
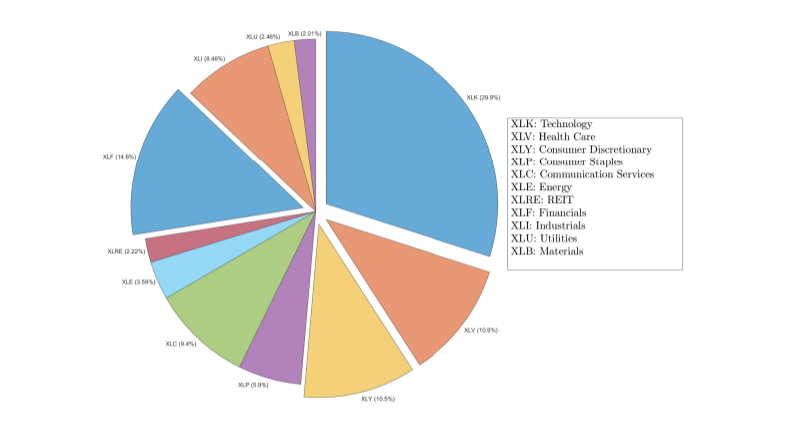
XLF and XLK
From the Pie chart, we know that XLF and XLK comprise roughly 45% of SPY.
Both assets are more volatile than SPY, although only XLK offers a higher return than SPY.
Their correlation is 55%, is moderately high.
XLV and XLY
XLV and XLY comprise roughly 22% of SPY.
Both assets offer a higher return than SPY, and XLV is less volatile than the index
(SPY).
However, their correlation is 65%, which is moderate-to-high.
XLK and XLU
These assets show the lowest level of correlation (28%)
They comprise roughly 32% of SPY.
XLU is as risky as SPY, but offers a lower return, while XLK is riskier than SPY but offers a higher return.
Minimum-variance portfolios reduce
risk compared to equally weighted portfolios.
Risk reduction is more pronounced than return reduction.