Ch. 14, factorial ANOVA
1/27
There's no tags or description
Looks like no tags are added yet.
Name | Mastery | Learn | Test | Matching | Spaced |
|---|
No study sessions yet.
28 Terms
When to use factorial ANOVA
you have more than 1 factor (IV)
2 factors: known as “two-way”
3 factor: known as “three way”
what study design can we use for factorial ANOVA
all between subjects
all within subjects
a mix of both designs
why choose a factorial
we can answer more complex research questions
we can take into consideration the interaction of factors
helps to guide human behaviour & interventions from research
hypothesis 1
testing the main effect: the effect of factor A
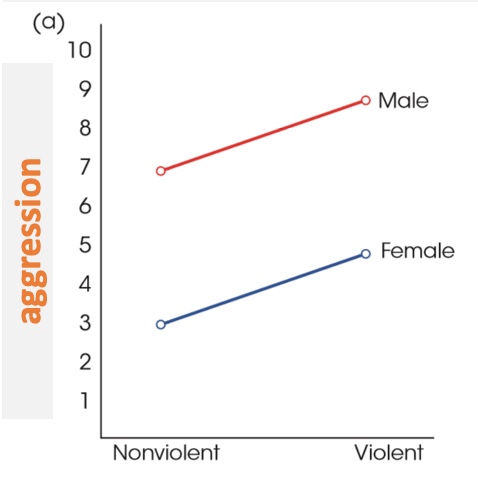
EX: how does gender (male vs. female) affect aggression)
hypothesis 2
main effect of condition: effect of factor B
EX: how does condition (violent vs. non-v) affect aggression
hypothesis 3
interaction between factors
EX: does the effect of condition on aggression depend on one’s gender?
parallel line graphs =
no interaction
different slopes =
interaction
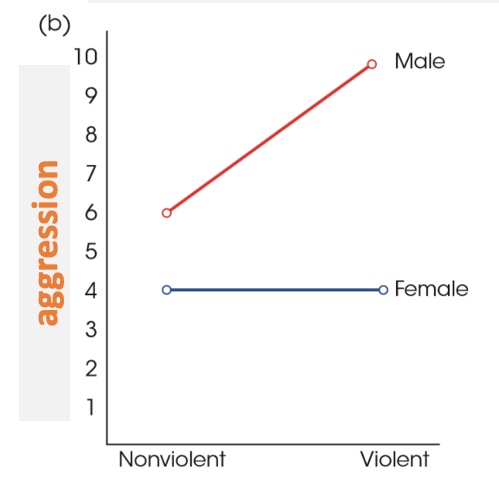
a steeper slope means
a larger interaction
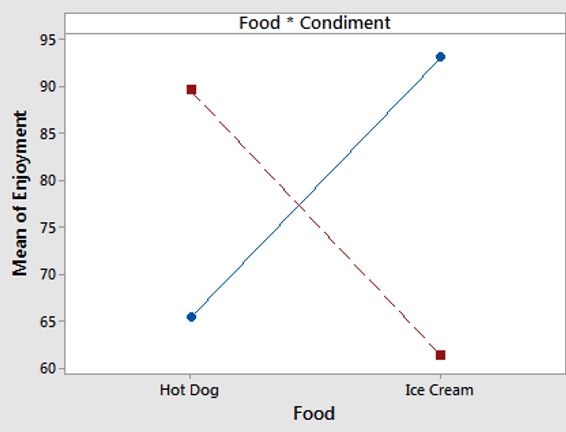
opposite patterns/directions =
interaction
how do we calculate effect size?
we do not calculate effect size (η) for this test, instead we run a simple main effect to find which variables are correlated
calculating simple main effects
run a t test on one factor (either A or B),
define power
the probability that your hypothesis will identify a treatment (rejected the null hypothesis) if an effect really exists
it is a probability value that proves an effect
calculating type 2
calculated by knowing our power
power of your test = 1 - β
as probability increases …
the probability of making a type 2 error decreases
we generally want what lvl of power?
a power of at least .80 (meaning we generally accept a type 2 error rate of .20 (20%)
you will have greater power with …
larger effects sizes
larger sample sizes
larger alpha lvl
one tailed tests
how do we know how many people to test?
you use a power analysis
what do you need to know to conduct a power analysis
your desired level of power (at least .80)
the size of the effect you expect to find
your alpha lvl
if you will be running a 1 vs 2 tailed test
smaller effect need…
more poeple to get sufficient power to detect them (because small effects are harder to find)
large effects need
fewer people to get sufficient power to detect it
how do you know what effect size to predict
past literature
similar studies that have published results/effect sizes
pilot data (a mini study)
theoretical predictions
correlation values
pearson r value is what is calculated - from (-1) to (1)
-negative value = negative correlation
positive value = positive correlation
linear regression
Examining how one or more variables predict one continuous variable
EX: does one’s time spent on social media and one’s age predict depression levels?
if you want to do a linear regression but have more than 1 predictor variables, what would we use?
use a multiple linear regression, or Hierarchical linear regression
Chi square
Testing the likelihood of being in a certain outcome/ testing if one group membership predicts the likelihood of being in another group membership
EX: does age group (younger vs. older adult) predict the likelihood of voting in the election? (voting = did vote; didn’t vote)
chi square examines only ….
2 CATEGORICAL VARIABLES, and the outcome can only be 2 levels
binary logistic
Tests the likelihood of being in a certain outcome
does condition (peer vs. alone) and age predict the likelihood of telling a lie? (lie = yes or no)