Stats unit 4
1/36
There's no tags or description
Looks like no tags are added yet.
Name | Mastery | Learn | Test | Matching | Spaced | Call with Kai |
|---|
No analytics yet
Send a link to your students to track their progress
37 Terms
p
population proportion
p hat
sample proportion
Multistage sampling
Using multiple methods to divide into groups, then select one or more groups, and then repeat until the sample is chosen
Voluntary response sample
Ask individuals to do something to respond to the survey
Convivence sampling
Asking people who are more convenient to contact
Quota sampling
Sampling widely used in opinion polling and market research, NO ASPECT OF RANDOMNESS
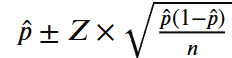
Proportion confidence interval
Estimates a population proportion
Normally distributed for proportions
n*p >_ 10 AND n(1-p) >_ 10
Normally distributed for means
n >_ 30 OR is stated as normal in the problem
The higher the level, the ________ the interval
Wider
Sampling error
No matter how well conducted
Different samples given different sample statistics
Inferential Stats
Used to make predictions or inferences
Descriptive Stats
Summarize and describe characteristics
Sample data 3 conditions
1) Randomly selected
2) Independent
3) Distributed normally
Higher confidence = ___________
Larger sample size = _______________
Wider interval
Narrower interval
Critical value
Multiplier based on the confidence level
Higher confidence=larger critical value
Confidence level
How confident the method is, such as 90%, etc
Cluster sampling
Population is divided into clusters, accurately reflect characteristics, then random sample is chosen
Stratified random sampling
Population is divided into groups based on similar characteristics, then a random sample from each strata is chosen
Systematic sampling
Picking every “nth” person or item
Simple random sample
A sample in which every possible sample of the desired size has an equal chance of being selected
Census
A complete count of the entire population
A statistic describes a _______, a parameter describes a ________.
Sample
Parameter
Random
The sample was selected at random
Normal
The sampling distribution must be approx. normal
Independent
One observation should not affect another
Proportion test
Testing a claim about a population proportion
Mean with sigma known
Mean CI/Test when population standard deviation is given
Mean with s given
Mean CI/Test when only sample standard deviation is given
Point estimate
The sample statistic in the center of the interval, such as p hat or x bar
Margin of error
How far you add/subtract from the point estimate
S or Sx
Sample standard deviation
Mu
Population mean/claimed mean
Sigma
Population standard deviation
n
Sample size
Alpha or a
Significance level
x bar
Sample mean