Unit 10 - Non-parametric statistics
1/19
There's no tags or description
Looks like no tags are added yet.
Name | Mastery | Learn | Test | Matching | Spaced | Call with Kai |
|---|
No analytics yet
Send a link to your students to track their progress
20 Terms
when is non-parametric procedure used?
nominal (categorical) and ordinal (ranked)
common parametric procedure asumptions
parametric procedures can tolerate some violations:
- interval or ratio data: the data being analyzed should be measured on an interval or ratio scale,
- N (0,1): The data should follow a normal distribution, or approximately normal, which means that it has a bell-shaped curve
- Homogeneity of variance: The variance, or the spread of the data, should be the same across different groups or conditions being compared.
severe violation:
- highly skewed distribution (not following norm distribution)
- increased probability of committing type i error
what if data was interval or ratio?
- data is highly skewed
- outliers will pull the group mean into one direction
- convert raw data to RANKS
advantage of converting raw data into ranks
- eliminates large differences between individual scores
- maintains a normal type I error data
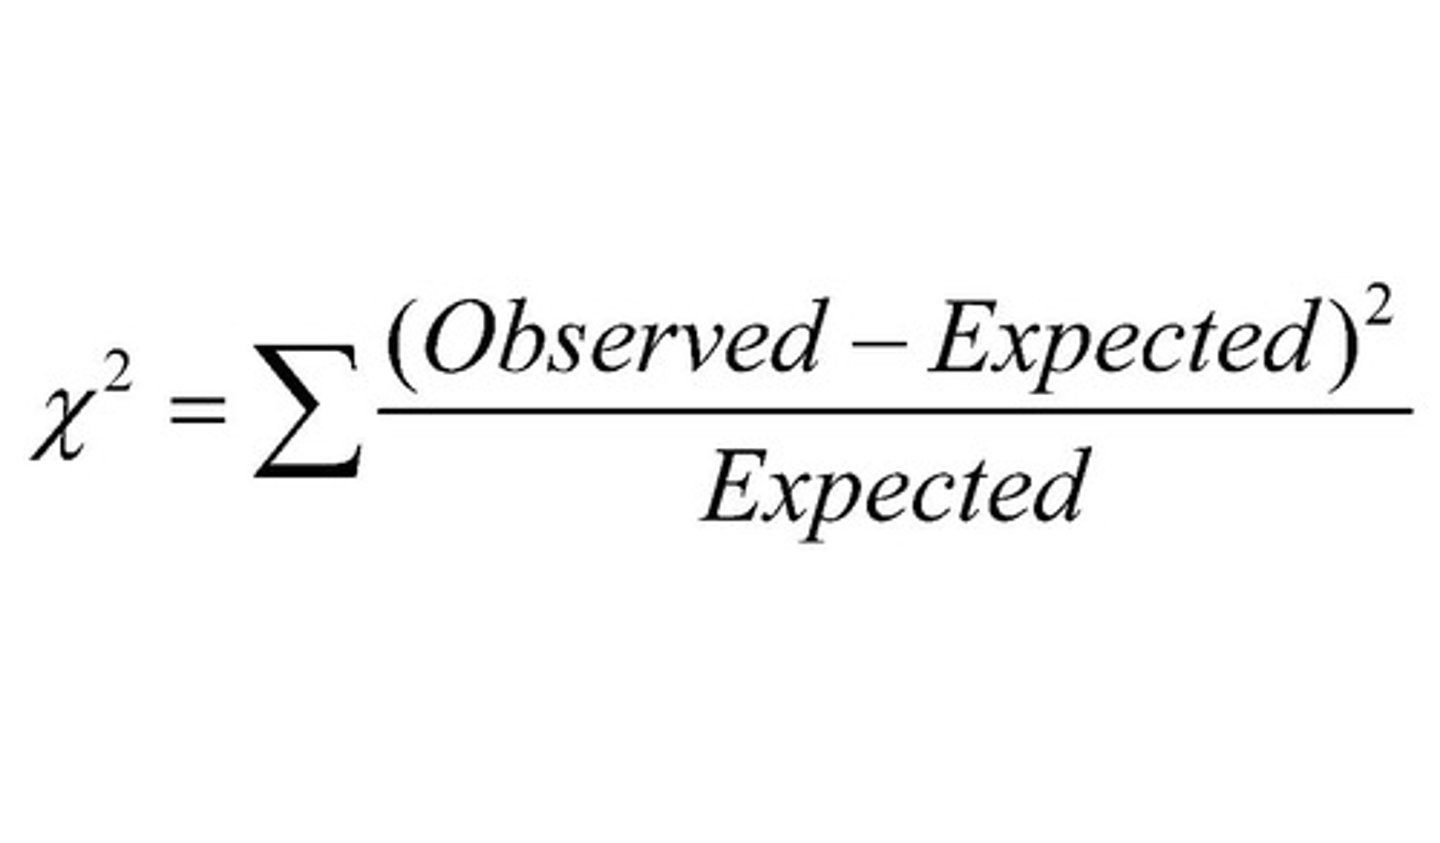
chi square
- involves nominal (categorical) variables.
- looks at 2 distributions of categorical data to see if they differ from each other.
- inferential procedure
- 1 IV (1 way chi square)
- 2 IV (2 way chi square)
assumptions of one way chi square
- 2 or more categories
- categories are mutually exclusive
- independent categories
- all responses included
- each expected frequency must be at least 5 (we need to ensure that the expected number of cases in each category is not too small, as small expected frequencies can lead to unreliable results.)
- participants belong to different levels of 1 variable
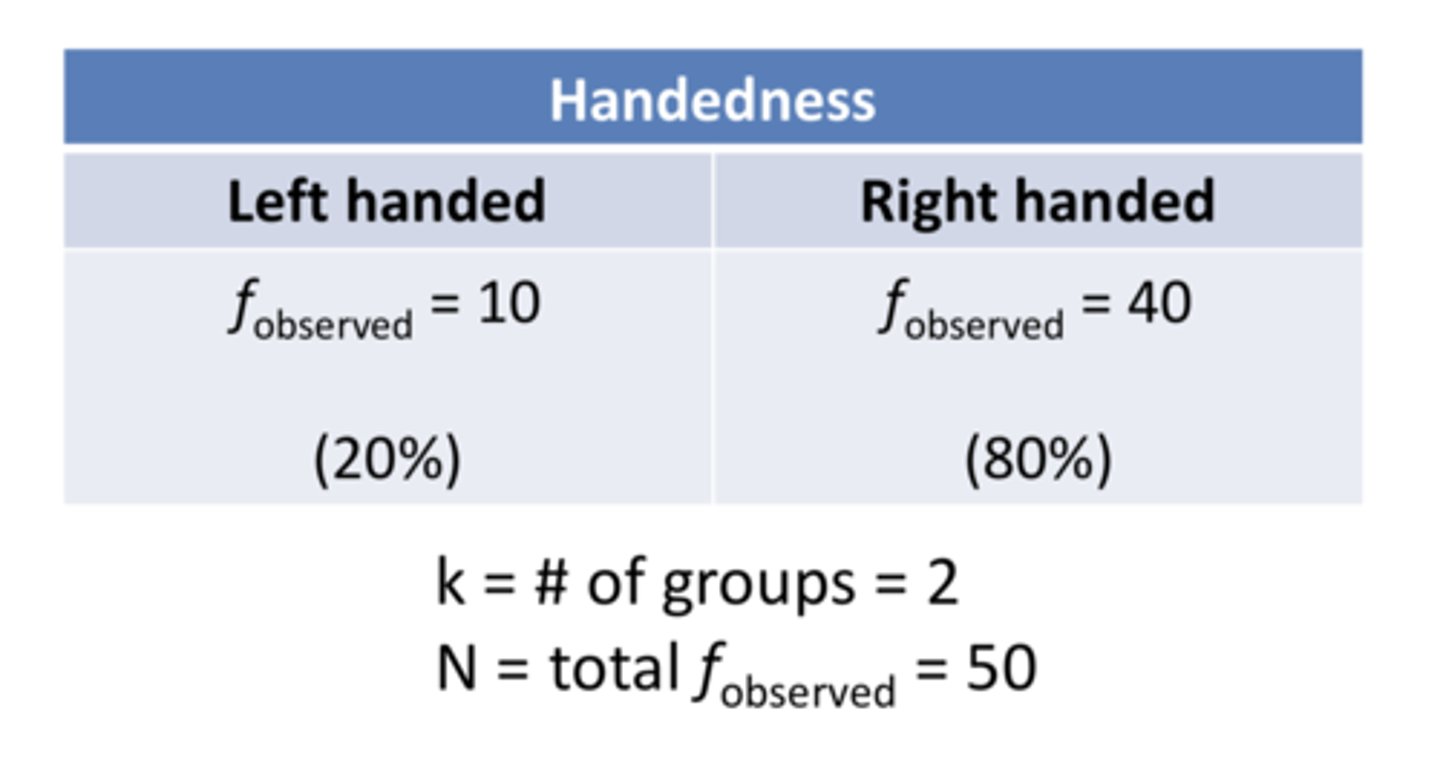
example of one way chi square
is handedness related to brain organization
theory: many history geniuses were left handed
steps of one way chi square
step 1: create a model of the relationship
- what is the expected frequency between two variables
- create a null hypothesis
- describe the distribution of frequencies in the population if the predicted relationship does not exist
- no directional hypothesis
- if no difference between frequency, there is no relationship
step 2: translate the null hypothesis into the expected frequency for each category
- fE = expected frequency
- the larger difference between fo and fE , the lower chance the difference is due to sampling error
step 3: compare calculated critical chi-square values
step 4: no measuring EFFECT SIZE. just conclude regaridng frequencies
degree of freedom for chi square
k-1
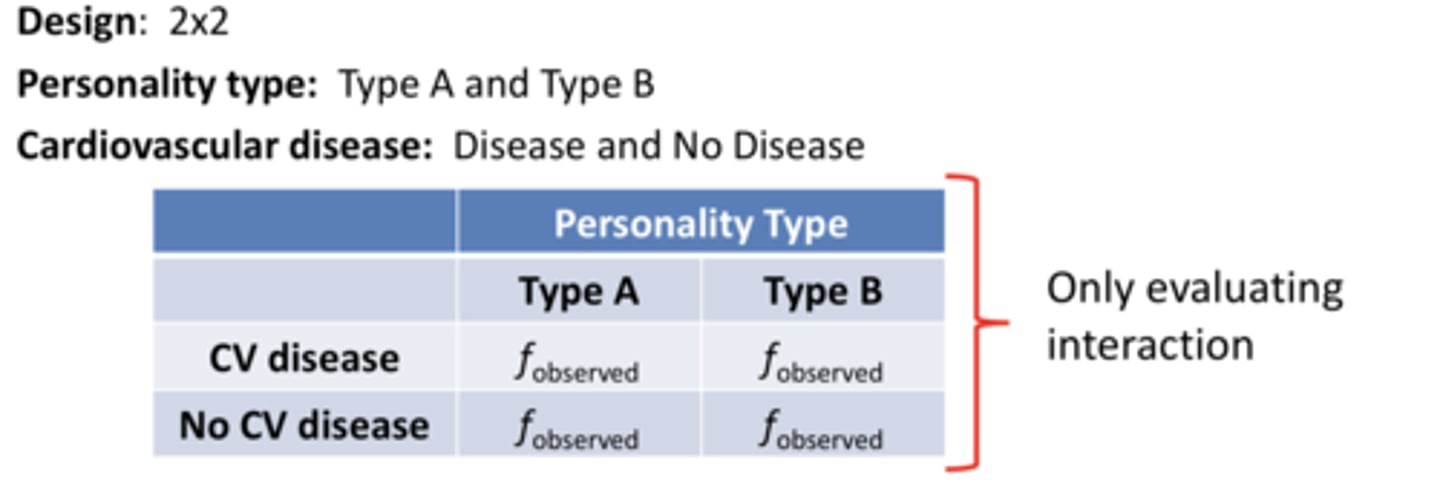
what is two way chi square refer to as?
test of independence
- counting the frequencies along 2 variables, and has same assumption as one way
example of two way chi square
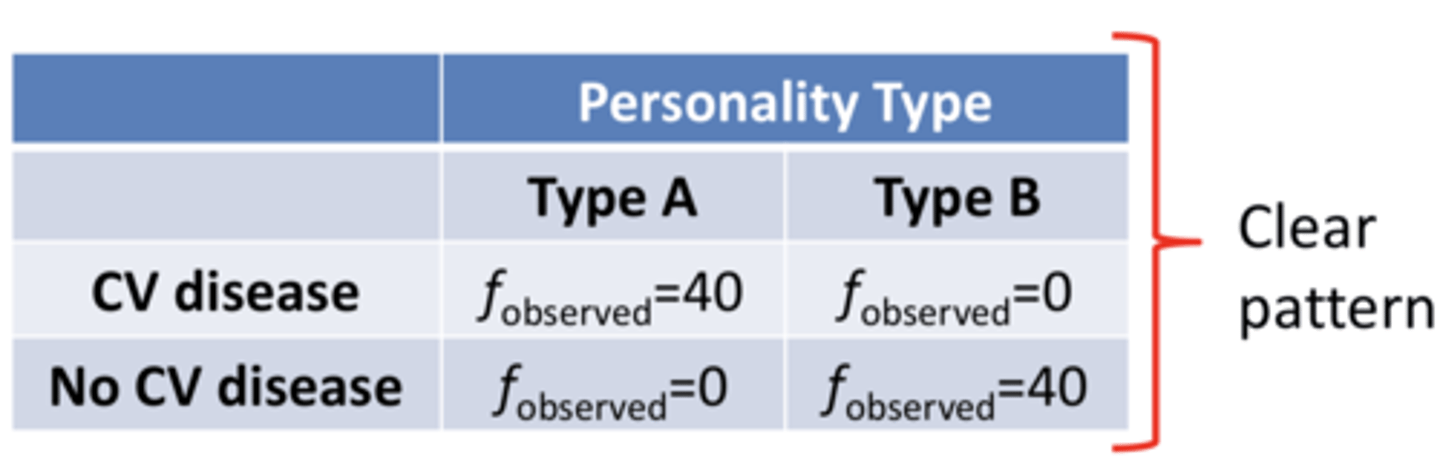
what is the relationship between personality type and cardiovascular
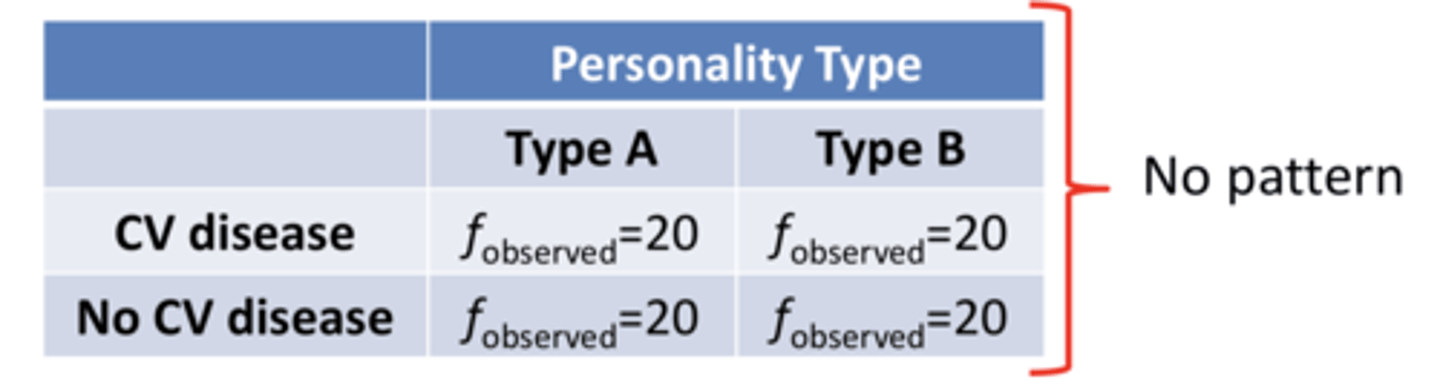
perfectly independent relationship in two way chi square
there's no pattern
perfectly dependent relationship in two way chi square
clear pattern
what's the statistical hypothesis for two way chi square
null hypothesis: category membership on one variable is independent of category membership (not correlated)
alternative hypothesis: category membership on the 2 variables is DEPENDENT
Mann-Whitney U test
determines whether 2 uncorrelated means differ significantly when data are nonparametric
(memory: the 'u' reminds you of 'uncorrelated')
Steps for the Mann-Whitney U
1. Assign raw scores to rank:
- If there are ties, assign the average rank to the tied observations.
2. Compute the sum of ranks
3. Compute U1 and U2:
- U1 is the smaller of the two sums of ranks and represents the sum of ranks for the group with the smaller sample size.
- U2 is the larger of the two sums of ranks and represents the sum of ranks for the group with the larger sample size.
4. Determine Mann-Whitney Uobtained:
- Use a two-tailed test to calculate the Mann-Whitney Uobtained value.
- The Uobtained value is the smaller of U1 and U2.
5. Find critical U-value:
- Look up the critical U-value in the Mann-Whitney U table
6. Compare Ucritical to Uobtained:
- If Uobtained is less than or equal to Ucritical, the test is significant.
Wilcoxon Signed Rank Test
nonparametric procedure used for 2 related samples that are ranked data (same participants are evaluated twice)
steps for Wilcoxon Signed Rank Test
1. Determine the difference scores for each pair of scores:
- Calculate the difference between the two related samples or the two measures of the same sample.
2. Determine the N (i.e number) of the non-zero scores:
- refer to the differences between the paired samples that are not equal to zero.
3. Assign ranks to the non-zero differences scores (ignore the sign of each difference)
- the smallest difference receiving a rank of 1.
4. Separate the ranks (using the sign of the difference score): - Assign the positive ranks to the positive differences
- negative ranks to the negative differences.
5. Compute the sum of the ranks for positive and negative ranks:
- sum of the ranks for the positive differences
- sum of the ranks for the negative differences.
6. Determine the Wilcoxon T obtained:
- calculate the smaller of the two sums of ranks, which is the Wilcoxon T obtained. (e.g if the sum of ranks for the positive differences is 60 and the sum of ranks for the negative differences is 45, then the Wilcoxon T obtained is 45, which is the smaller of the two sums of ranks.)
7. Find T critical through the Wilcoxon table
8. Compare T obtained with T critical:
- If T obtained < than T critical, then the difference between the two related samples is significant.
what is the parametric equivalent to wilcoxon t-test?
paired t-test
H0: In the population the median difference is zero
H1: In the population the median difference is NOT zero
("not zero" means that there is a difference between the two populations being compared)
Kruskal-Wallis test
The non-parametric equivalent to the 1 way ANOVA (not repeated measures)