Chapter 4 Quantitative data collection -Karteikarten | Quizlet
1/70
There's no tags or description
Looks like no tags are added yet.
Name | Mastery | Learn | Test | Matching | Spaced |
|---|
No study sessions yet.
71 Terms
Define the experiment
Aim to provide causal evidence of a relationship by showing what outcome occurs when a particular factor is manipulated.
X Independent variable : Manipulation vs. Control
—>
Y Dependent variable : is measured
Name the key elements of an experiment
- Manipulation
- Randomization
- Measurement
- Control
What relationships are possible for two related events X and Y ?
- X causes Y
- Y causes X
- X and Y are consequences of a common cause, but do not cause each other
- X causes Y and Y causes X
- X causes Z, which causes Y
- There is no correlation between X and Y the correlation is a coincidence
Explain direct causality
- X causes Y
- the more you study, the better grades you get
Explain reverse causality
- Y causes X
- the faster the windmills turn, the more wind is observed
Explain common cause
- X and Y are consequences of a common cause, but do not cause eaxh other
- Sleep with the shoes and wake up with a headache
Explain Bidirectional or cyclic causality
- X causes Y and Y causes X
- the number of lions influences the number of gazelles, but also the number of gazelles influences the number of lions
Explain Indirect Causality
- X causes Z, which causes Y
- Contact with minorities leads to fear of minorities, which in turn leads to prejudice against minorities
Explain No causality
- There is no correlation between X and Y; the correlation is a coincidence
- Increased chocolate consumption increases the likelihood of winning a Nobel Prize (correlation does not imply causation)
Correlation means causality
Wrong.
It does not imply causation.
↳ E.g. Football teams in red jerseys win more often → there is a correlation but no causation.
What is the difference between regression and correlation ?
In regression, causality is assumed (causality hypothesis) : Variable X affects variable Y
On the other hand, the following applies to correlation : no causality !
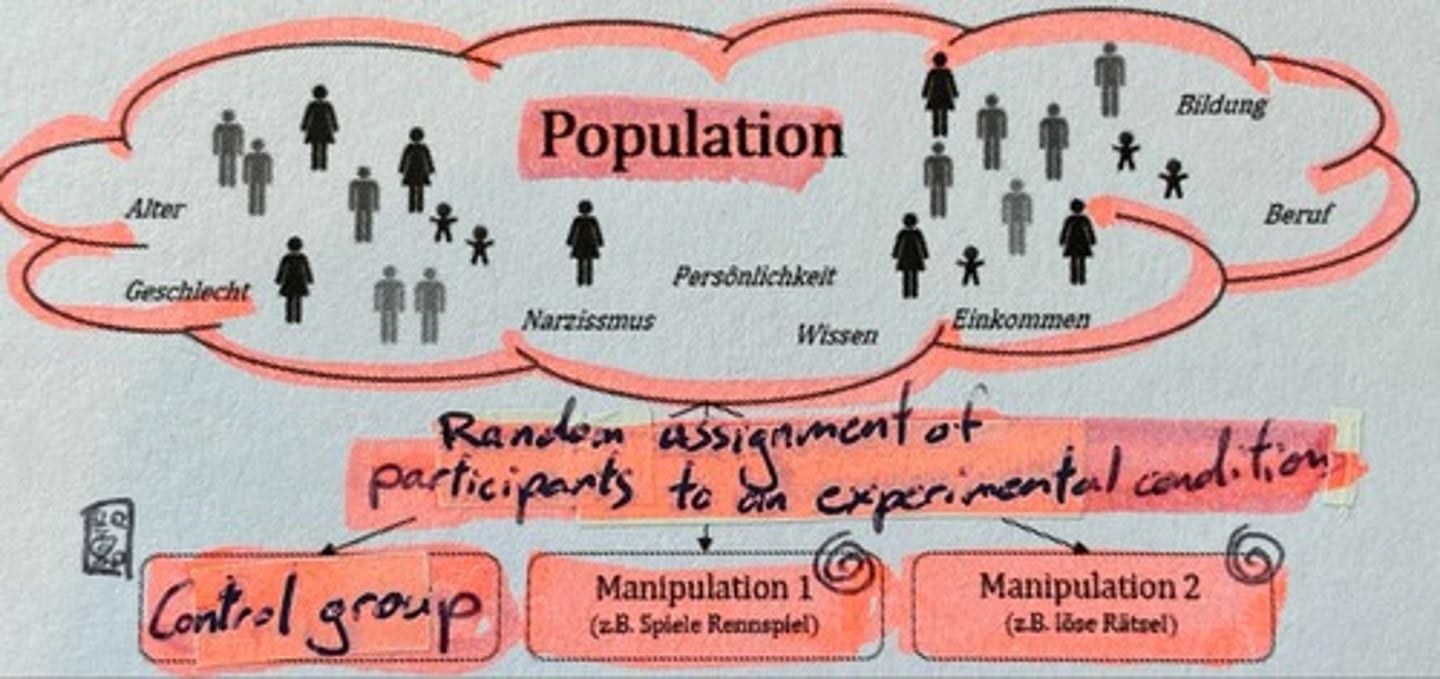
The assignment of the participants to an experimental condition is random.
Derive consequences
All uncontrolled attributes (e.g., personality attributes) of the entire population are uniformly distributed across all conditions. Therefore, hypothetical confounding variables of an individual are theoretically eliminated by randomized sampling.
The assignment of the participants to an experimental condition is random.
Graphic
Population <-> Random Assignment of participants to an experiment condition -> 1. Control Group; -> 2. Manipulation 1 (runinng Game); -> 3. Manipulation 2 (riddle)
What experimental designs are distinguished between ?
• Between-Subjects Design
• Within-Subjects Design
Explain Between-Subjects Design
Participants are divided among the experimental conditions exposing them to only one condition at a time (e.g., in drug testing, one group is given a placebo and another group is given the drug)
Explain Within-Subjects Design
All participants are exposed to all conditions (e.g., in drug testing, a person is first given a placebo for two weeks and then given the drug for two weeks)
List advantages of laboratory experiments
- High internal validity
- Higher control variables
- Replication of results
- Complex measurements possible (brain activity, eye tracking etc.)
List disadvantages of laboratory experiments
- Artificial environment
- Reduced generalizability
- High reactivity
- Deep external validity
List advantages of field experiments
- High external validity
- High representativeness
- Low reactivity
- Natural environment
List disadvantages of field experiments
- Problems data protection
- Lack of control over variables
- High cost
- Replication of results
List advantages of online experiments
- Global reach
- Speed of data acquisition
- Replication of the results
- Low cost
List disadvantages of online experiments
- Biased attributes of the participants
- Software knowledge
- No control over time and place
- Answering questions difficult
Name one way that survey data quality can be assured
It can be ensured by bot checks
What steps does the execution of an experiment usually follow ?
- Introduction
- Manipulation
- Manipulation Check
- Outcome measurement
- Post-Survey
- Debriefing
Name biases (measurement errors) underlying common behavioral methods
- Observer Expectancy Effect
- Social desirability
- Item priming effects
Explain the Observer Expectancy Effect
A cognitive bias that leads researchers to subconsciously influence participants in an experiment. A double-blind design can be used as a remedy
Explain Social desirability
Refers to the tendency of some people to react to things more as a result of their social acceptance than their true feelings.
Explain the Item priming effects
The positioning of the independent variable in the study may make that variable more salient to respondents and imply a causal relationship with other variables.
What quantitative study designs do you know besides the classical experiment ?
- Quasi-experiment
- Survey
- Meta-analysis
Characterize the quasi-experiment
Compared to the classical experiment, the quasi-experiment does not randomly assign participants to experimental conditions because it is not possible or practical to control for all potential confounding variables. Because of this, causality can only be determined to a limited extent with the help of a quasi-experiment.
Give an example of a quasi-experiment
If one wants to study the effects of cigarettes on endurance, then no random assignment of participants occurs. Rather, smokers and non-smokers are specifically assigned to different groups in order to examine the resulting effects. Any confounding variables are potentially not controlled for due to the lack of randomization.
Name different types of surveys
- Personal survey
- Postal survey
- Telephone survey
- Online survey
What is a meta-analysis ?
Statistical analysis of the results of several studies that have appeared in several scientific articles. There is a similarity to the systematic review.
Name the steps of a meta-analysis
1. Selection of topic and research project
2. Collect studies
3. Development of coding questionnaires
4. Coding of the studies
5. Data analysis
6. Presentation of the results
What is the difference between systematic review and meta-analysis ?
A review critically appreciates the previous research data and results, whereas the meta-analysis involves only the quantitative and statistical review of previous results.
What is the goal of a pretest?
It is a miniature version of the main study to test the functionality of the study design.
What information should pretests provide?
- Comprehensibility of the questions
- Problems of the respondents with their task
- Interest and attention of respondents to individual questions
- Interest and attention of the respondents throughout the study
- Well-being of the respondents
- Frequency distribution of responses
- Sequence of questions
- Contextual effects
- Problems of the interviewer
- Technical problem with questionnaire/questionnaire aids
- Survey duration
List advantages of closed questions
- Quick and easy to answer
- No ambiguous answers
- Easy to analyze and understand results
List disadvantages of closed questions
- A certain degree of sensitivity and differentiation complicates
- Limited number of alternatives
- Does not address the question of "why"
Name the different types of closed questions
- Dichotomous
- Multiple Choice
- Scaled
- Ranking
Explain Dichotomous
Respondents must choose between two alternatives, e.g., "yes" or "no"
Example: Have you seen or heard any advertisements for cigarettes in the last 30 days? Yes or no?
Explain Multiple Choice
Requires participants to make single or multiple selections.
Example: What type of soap do you use most often ? (e.g. Dove, Palmolive, Nivea, Other)
Explain Scaled
Likert:
Are used when you want to give the respondent a scaled measure.
Example: I had a positive experience at the hotel (1 strongly disagree - 7 strongly agree).
Semantic Differential:
Two different opposite words are used to understand which side the respondent is leaning towards.
Example: How do you perceive the length of time you had to wait for service? (1 long - 7 short)
Explain Ranking
Pair comparisons:
Participants must choose between two alternatives.
Example: When you decide on a brand to buy, which is more important: price or quality?
Ranking of the enforced preferences:
Requires sequential ranking from top to bottom until all factors are evaluated.
Example: Look at the list of kitchen appliances and rank them from most useful to least useful eg. whisk, toaster, blender).
List the advantages of open-ended questions
- Allows respondents to identify key issues
- Answers the question of "why
List the disadvantages of open-ended questions
- Can be time consuming
- Can be difficult to analyze the results
Name the different types of open-ended questions
- Completely unstructured
- Word combination
- Sentence completion
Explain Completely unstructured open-ended questions
Answering this type of question is What completely open to the products respondent.
- What do you think of Nivea products ?
Explain Word combination of open-ended questions
Respondents are asked to indicate which words they associate with others.
- What brands come to mind ? Toothpaste- Shampoo - ? Soap- ?
Explain Sentence completion of open-ended questions
Participants are given a half- finished sentence to complete.
- When buying a laptop , the most important feature for me is ....
How can you measure a construct ?
Ideally, with scales that have been used by other researchers. If it has not already been measured, you can design your own scale. It is also possible to improve existing scales by, for example, reducing the number of items.
What indicators point to high quality scales ?
- Well-cited and from highly ranked journals (A and A+)
- Reliability (measured with Cronbach's alpha: a > 0.7 is sufficient, a > 0.9 is good )
- Validity
Name some typical marketing scales
- Personality
- Values
- Attitudes
- Perception
- Behavior
- Knowledge
- Advertising
- Satisfaction
- Quality
- Social
- Emotions
Name the properties of quantitative data
- It usually come from surveys, experiments, observations, or secondary data
- Usually numerical and structured data
- Statistical data analysis
- Examples are regressions and mean comparisons
- Important quality criteria : Objectivity, reliability and validity
Name and explain the different types of variables
- Interval/ratio: regular intervals between all categories (e.g. age).
- Ordinal: categories can be ordered, but unequal spacing between them is possible (e.g., school grades)
- Nominal: Qualitatively different categories - cannot be ordered
- Dichotomous: Only two categories (e.g. purchase/no purchase)
Create a checklist to find out which scale level each is
- Are there more than two categories ? → dichotomous (no)
- Can the categories be ordered by → nominal rank ? (Yes/no)
- Are the distances between the ordinal (yes/no)
- categories the same ? Interval Ratio (yes)
Name the situation parameters which were mentioned in the lecture
*Mean value
*Median
*Mode
What are the characteristics of the mean value?
- Sum of the considered numbers divided by their number
- Colloquially known as average
What are the characterisitcs of the median?
- Value that lies exactly in the middle of a data series
- In contrast to the mean value, not influenced by outliers
What is the mode (situation parameter)?
The most frequent value
What different quantitative analysis methods do you know ?
- Univariate data analysis
- Bivariate data analysis
- Multivariate data analysis
Characterize univariate data analysis
It is concerned with only one variable, i.e. only one characteristic is considered. Absolute frequencies are presented in tabular or graphical form with frequency tables or histograms.
Characterize the bivariate data analysis
- Analysis of two variables to see if and how they are related to each other
- Analysis of relationships, not causalities
- Contingency table = frequency table with two variables (e.g., fitness attendance reasons for women).
- Other methods depending on the type of variables
*Pearson's r
*Spearman's rho
*etc
Characterize multivariate data analysis
- Simultaneous analysis of three or more variables
- Structure-discovering and structure-testing methods
What is Structure discovery build of?
- Factor analysis
- Cluster analysis
What is Structural testing build of?
- Analysis of variance
- Regression analysis
- Discriminant analysis
- Conjoint analysis
Name advantages of the online survey software Unipark
- High scalability - from simple stand-alone surveys to complex experimental designs and / or custom Java scripts.
- Wide variety of question types
- Good documentation
- Data is stored centrally and work on projects is possible from any computer with Internet access .
List the steps to create a survey on Unipark
1. Create project
2. Enter questions
3. Activate project
4. Test project
5. Invite participants
6. Control process
7. Data export
What are the question types on Unipark ?
- Standard Likert type scales (horizontal vs. vertical ; single vs. multiple)
- Semantic differentials
- Matrix questions
- Dropdown menus
- Rankings
- Slider type questions
- Open text fields
- Multimedia questions (select image, watch video, etc.)
List criticisms of quantitative research
- Static view of social behavior
- Artificial and false understanding of precision and accuracy
Summarize the most important points from lecture 4
- Experiments represent the central tool to provide relationships between different variables
- In the context of experimental designs, a distinction is made between the between-subjects design and the within-subjects design
- Various behavioral biases among participants in experiments can cause measurement errors, and this must be taken into account.
- To measure a construct, one should ideally use high-quality scales that have already been used by other researchers
- In the context of quantitative data analysis, a basic distinction is made between univariate, bivariate and multivariate data analysis