Looks like no one added any tags here yet for you.
income offer curve
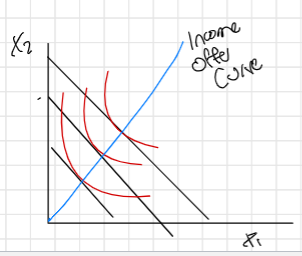
curve which shows the demanded bundles as one’s budget shifts
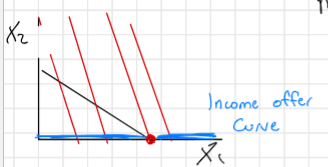
sketch the income offer curve for an example of perfect substitutes for where one good is always consumed over another
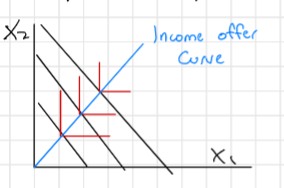
sketch the income offer curve for an example of perfect complements
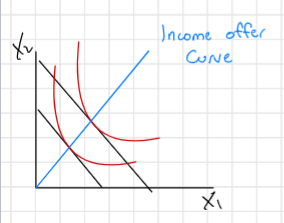
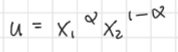
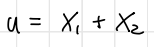
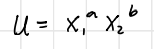
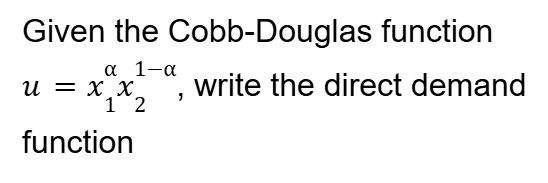
sketch the income offer curve for an example of Cobb-Douglas preferences (with the given utility function)
homothetic preferences
describes a type of preference wherein consumer preferences only depend on the ratio of good 1 to good 2; demand for good goes up in same proportion as income
straight line through origin
describes the income offer curve of demand functions with homothetic preferences
perfect substitutes, perfect complements, and Cobb-Douglas
give three examples of common types of preferences which are homothetic preferences
quasilinear preferences
a type of preference where all indifferences curves are shifted versions of the same indifference curve
zero income effect
if, for a case of quasilinear preferences, good 1 is the good whose demand is independent of income and all extra income goes to good 2, what is the income effect for good 1?
Griffen good
a type of inferior good wherein a decrease in price causes the quantity demanded to decrease
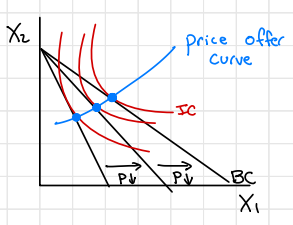
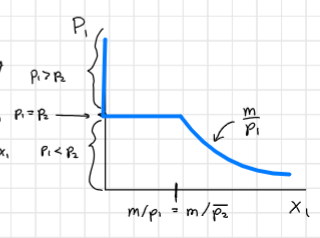
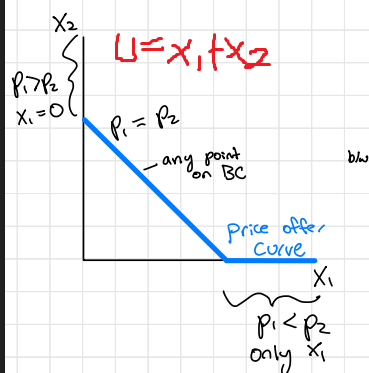
price offer curve
curve which shows the bundles demanded at different prices for good 1
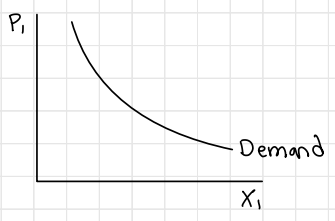
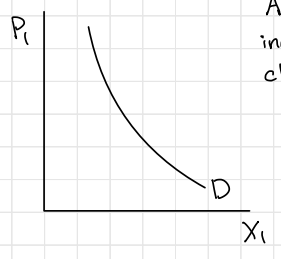
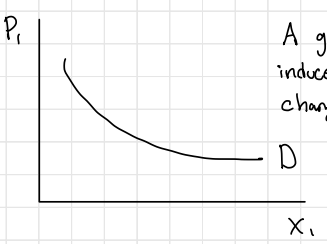
the demand curve
identify and sketch the curve and graph which is derived from the price offer curve; this curve involves plotting x1(p1, p2, m), holding p2 and m fixed
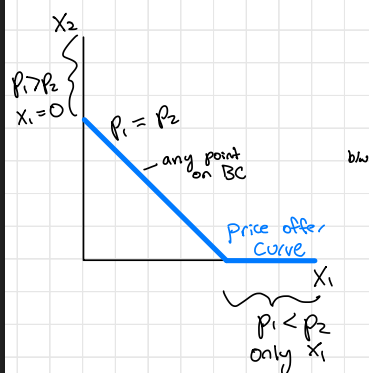
sketch the price offer curve for 2 goods which are perfect substitutes with the utility function given
sketch the demand curve for the price offer curve of the good shown, which is a perfect substitute
steep demand curve (a given price change induces a small change in x1)
what is the shape of the demand curve when goods are close to or are perfect complements?
flatter demand curve (a given price change induces a large change in x1)
what is the shape of the demand curve when goods are close to or are perfect substitutes?
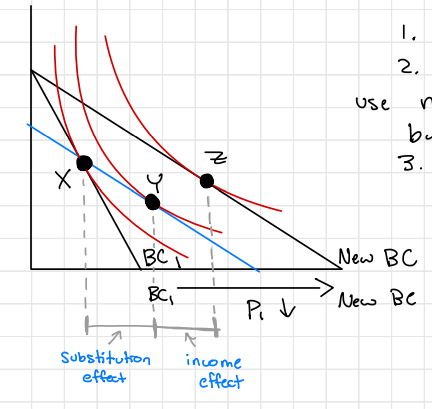
sketch a graph which decomposes the effect of a decrease in p1 into a (slutsky) substitution and income effect
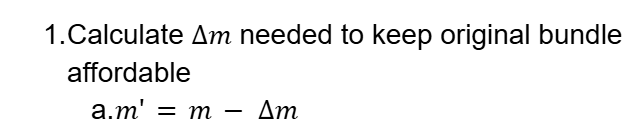
write the first step to calculate the substitution and income effects for a change in price (when given demand functions) and identify the value of m-prime
(i.e. find the Y bundle)
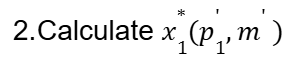
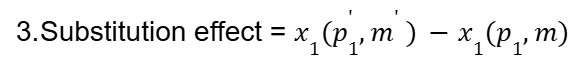
write the second step to calculate the substitution and income effects for a change in price (when given demand functions)
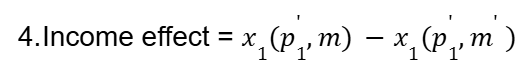
write the third step to calculate the substitution and income effects for a change in price (when given demand functions)
write the fourth step to calculate the substitution and income effects for a change in price (when given demand functions)
negative (price and QD move in opposite directions)
is the substitution effect positive or negative?
negative (increase in price lowers income and lowers QD)
is the income effect positive or negative for normal goods?
positive (increase in price lowers income and raises QD
is the income effect positive or negative for inferior goods?
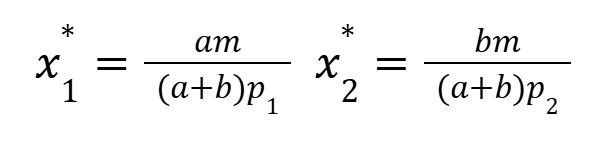
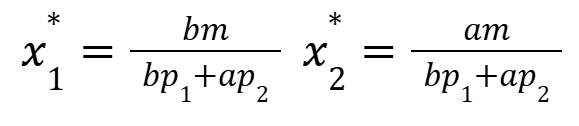
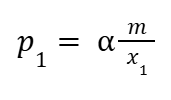
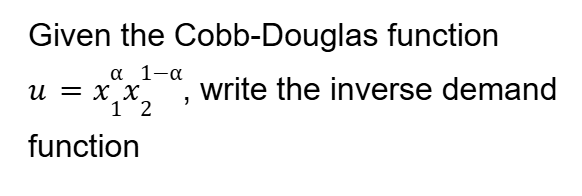
write the optimal demand functions for x1 and x2 given this Cobb-Douglas utility function
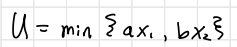
write the optimal demand functions for x1 and x2 given this Leontief (perfect complements) demand function
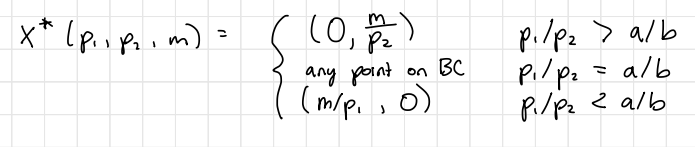
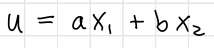
write the optimal demand functions for the bundle (x1, x2) given this linear (i.e. perfect substitutes) utility function
endowment
describes the original bundle which an individual starts out with and which comprises their income
gross demand
describes the total amount of a good a consumer consumed
net demand
describes the difference between final consumption and the initial endowment; is equal to the amount bought/sold
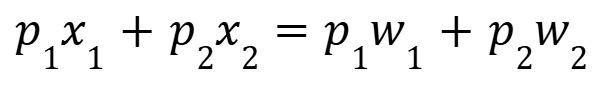
write the equation which expresses the fact that your final bundle should equal your endowment income
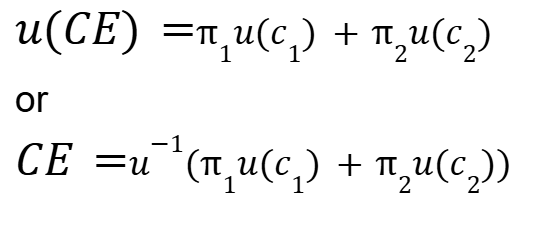
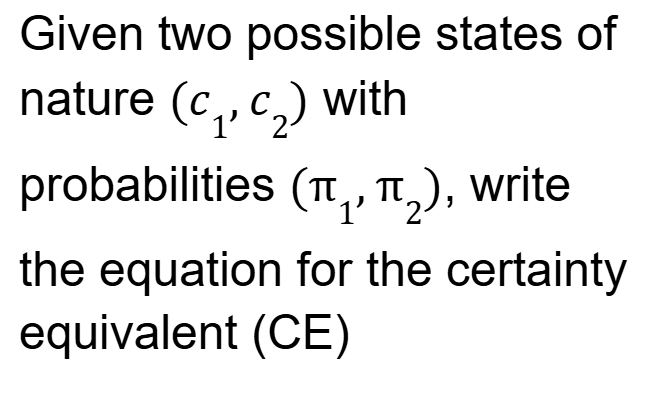
certainty equivalent
is the amount of money that provides equal utility to the expected utility of the gamble
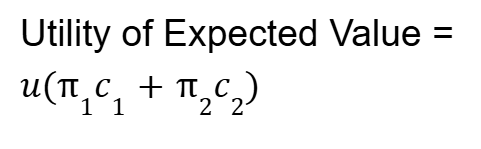
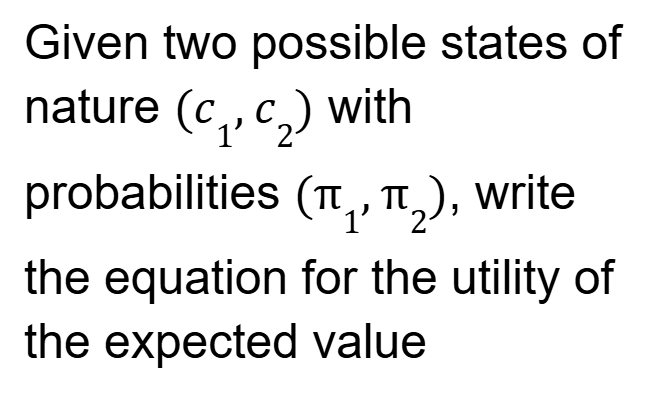
utility of expected value > expected utility
what is true, in terms of utility, for a person who is risk averse?
risk loving/risk seeking
what does it imply about an individual if: utility of expected value < expected utility
risk neutral
what does it imply about an individual if: utility of expected value = expected utility
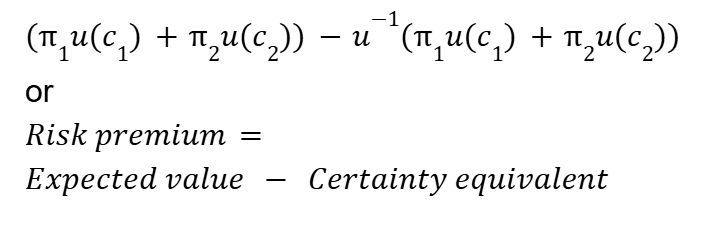
risk premium
is the difference between the expected value and the certainty equivalent; is the amount you are willing to pay to avoid a risk
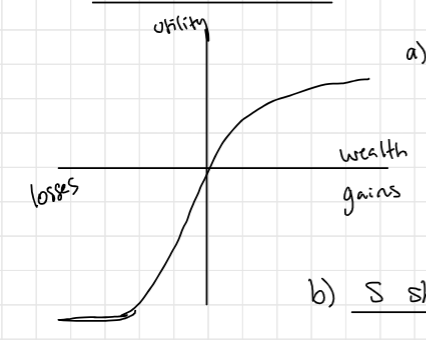
sketch the value function from prospect theory, with the x-axis being wealth gains/losses and the y-axis being utility
(1) reference point matters
(2) S shape (risk averse with gains, and risk seeking when recouping losses)
(3) Curve is steeper in loss than gain
what are the three primary characteristics of the prospect theory value function
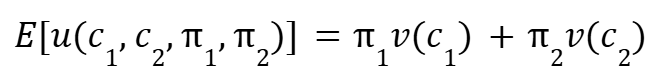
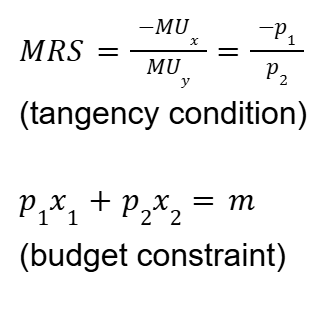
What are the two equations you need to find to solve for the optimal bundle of goods (one of which you can use the Lagrangian method to determine)?