6 - Unsupervised Learning
1/64
There's no tags or description
Looks like no tags are added yet.
Name | Mastery | Learn | Test | Matching | Spaced | Call with Kai |
|---|
No analytics yet
Send a link to your students to track their progress
65 Terms
Uses of unsupervised learning techniques
Exploratory data analysis especially on high dimensional datasets
Feature generation
PCA
To transform a high-dimensional dataset into a smaller, much more manageable set of representative (“principal”) variables, easier to explore and visualize
PCs are…
linear combinations of the existing variables that capture most of the information in the original dataset
PCA is especially useful for
highly correlated data, for which a few PCs are enough to represent most of the information in the full dataset
PCA score formula
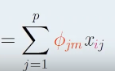
Choose PC loadings to…
capture as much information the original dataset as possible
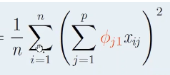
Goal of PCA for calculations
to maximize the sample variance of Z1
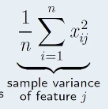
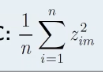
Sample variance formula
Orthogonality constraints
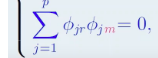
Why are orthogonality constraints needed
so the PCs measure different aspects of the variables in the dataset
PCA analysis is constrained by
the line that is as close as possible to the observations such that minimizes the sum of the squared perpendicular distances between each data point and the line
First and second PCs are…
Mutually perpendicular
Scores formula with notation

Total variance for a feature
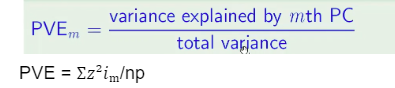
Variance explained by the mth PC
PVE =
Does Centering have an effect on PC loadings? Why?
Centering has no effect on PC loadings because the variance remains unchanged upon centering and this variance maximization is how PC loadings are defined
Does scaling have an effect on PC loadings? Why?
Yes, If variables are of vastly different orders of magnitude, then variables with an unusually large variance on their scale will receive a large PC loading and dominate the corresponding PC
Drawbacks of PCA
Interpretability: Cannot make sense of the PCs because they are complicated linear combinations of the original features
Not good for non-linear relationships
Uses linear transformations to summarize and visualize high-dimensional datasets where the variables are highly linearly correlates
PCA is not doing feature selection because all variables go into the components, no operational efficiency added
Target variable is ignored: Assuming directions in which the features exhibit the most variation are also the directions most associated with the target variable, no guarantee this is true
Scree plot
PVEs against PC index
Are PC loadings unique
Yes, up to a sign flip
Biplot shows what?
the locations of PCAs and scores
How does having categorical variables with high dimensionality hurt a data set?
Predictive power of the model will be diluted and lead to sparse factor levels (those with very few observations)
Suggest 2 ways to transform categorical variables with high dimensionality to retain them
Combine categories into smaller groups
Binarize the two factor variables, run a PCA on each set of dummy variables and use the first few PCs to summarize most of the information
Total SS =
within cluster SS + between cluster SS
Total SS is
the total variation of all the observations in the data without any clustering (essentially there is one large cluster containing all observations)
Between cluster SS
Can be thought of as the SS explained by the K clusters
Two idealistic goals of cluster analysis
Homogeneity: Want observations within each cluster to share characteristics while observations in different clusters are different from one another
Interpretability: Characteristics of the clusters are typically interpretable and meaningful within the context of the business problem
PCA/Clustering Similarities
Unsupervised Learning
Simplify the data by a small number of summaries
PCA/Clustering Difference
PCAs find low dim representation whereas clustering finds homogeneous subgroups among the obs
K-means clustering algorithm
Randomly select k points in the feature space as the initial cluster centers
Assign each obs to closest cluster in terms of Euclidean distance
Recalc center of each cluster
Repeat until nothing changes
Why we run K means algorithm multiple times
To mitigate the randomness associated with the initial cluster centers and increase the chance of identifying a global optimum and getting more representative cluster groups
Is K means clustering a global optimum
No, local
Hierarchical Clustering
Series of fusions of observations
Hierarchical clustering algorithm
Start with all separate clusters
Fuse closest pair one at a time
Repeat until all clusters are fused into a single cluster containing all obs
Within cluster variation vs Euclidian distance
Within cluster is squared for each observation whereas Euclidean distance uses a square root
Elbow method
Choose cutoff where the proportion of variance explained by the k number of clusters reaches the elbow in the graph
Linkage choices
Complete, single, average, centroid
Complete linkage

Single linkage
Minimal pairwise distance
Average linkage
Average of all pairwise distances
Centroid linkage
Distance between the two cluster centroids (or centers)
Most common linkage methods? Why?
Complete and average because they result in more balanced and visually appealing clusters
Dendrogram
an upside down tree that shows dissimilarity at each fusion
Lower cut dendrogram results in _____ clusters
More
Differences of K means and hierarchical
Randomization
Pre-specified number of clusters
Nested clusters
Which of K means and hierarchical need randomization?
K means
Which of K means and hierarchical need pre-specified clusters?
K means
Which of K means and hierarchical need nested clusters?
Hierarchical
Similarities of K means and hierarchical
Both unsupervised
Objective is to uncover homogeneous subgroups among the observations
Both are sensitive to scaling of variables
Both are sensitive to outliers
Solution for observations with largely different scales
correlation based distance
Ways to generate features from cluster analysis
Cluster groups
Cluster centers can replace the original variables for interpretation and prediction purposes
Two impacts of Curse of dimensionality for clustering
Harder to visualize data
Notion of closeness becomes more fuzzy when there are more and more variables
Which linkage can results in inversion
Central linkage
Considerations for number of clusters to choose for hierarchical clustering
Balance
Height differences
Explain two reason why unsupervised learning is often more challenging than supervised learning
Less clearly defined objectives
Less objective evaluation
Why are PC loading vectors unique up to a sign flip
The line of the PC extends in both directions and therefore gives rise to another valid PC loading vector
Explain how scaling the variables will effect the results of clustering
Unscaled variables might have one dominate the distance calculations and exert a disproportionate impact on the cluster arrangements, so we adjust for that
Explain how principal components analysis can be used as a pre-processing step before applying clustering to a high-dimensional dataset
PCA can allow us to compress the data into 2 dimensions without losing much information and to visualize the cluster assignments in a two-dimensional scatterplot using the scores of the first two PCs
Large variance for PC1 and small others imply what?
Strong correlation among the variables
What is the name of the plot for K means clustering
Elbow plot
When to select for an elbow plot
When it levels off
State the difference between dissimilarity and linkage
Dissimilarity measures the proximity of two observations in the data set, while linkage measures the proximity of two clusters of observations
Describe the steps to calculate the within cluster sum of squares using latitude and longitude
Calc the centroid
Calc sq Euclidean distance between each city and the respective centroid
Sum all sqd distances
What distance method does K means clustering and hierarchical clustering use
Euclidean