EXST 2201 CH1 WIP
1/84
There's no tags or description
Looks like no tags are added yet.
Name | Mastery | Learn | Test | Matching | Spaced |
|---|
No study sessions yet.
85 Terms
What is the source of the information contained in the columns of a statistical data set?
Variable information
Do location and spread measure the same characteristic in a column of data values?
No, location measures middle and spread measures width.

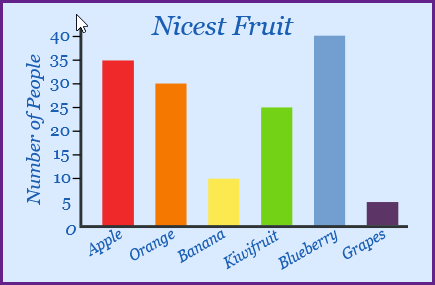
What type of plot is in the image?
A bar chart

What type of data in depicted in the plot image?
Qualitative data.
Why is it important to look at the shape of a column of data values before interpreting any statistics calculated from a column of data values?
To see that the shape of the data values meets the assumptions of the statistical method.
Match each characteristic of a distribution of a column of data values with the appropriate efficient statistic below: Mean, Standard deviation, Histogram
Shape:
Location:
Spread:
Shape: Histogram
Location: Mean
Spread: Standard deviation
What is the importance of the deviation of a data value in the science of statistics?
Is it the basic measure of the spread in a data value
In finding a percentile (Pk), how is the appropriate move in Step 2: Move to the right to the correct Position decided?
Integer = average up, Decimal = go up
At a birthday party, teams are chosen by putting everyone's name into a hat. Then names are drawn from the hat to make up each team. What type of sampling is this?
Random sampling without replacement.
Is statistics the science of making random decisions?
WRONG - NO, STATS MAKES APPROPRIATE DECISIONS BASED ON DATA
What kind of data is the science of statistics designed to work with?
Probablistic data, because this kind occurs frequently in nature.
The distribution of a column of data values measures what three characteristics of the column of data values?
The shape, location, and spread of the column of data values.

What is the mode of the plot in the image?
Blueberry.
Which of the following answers is NOT an exception when analyzing a histogram?
The presence of any distance in the data values.
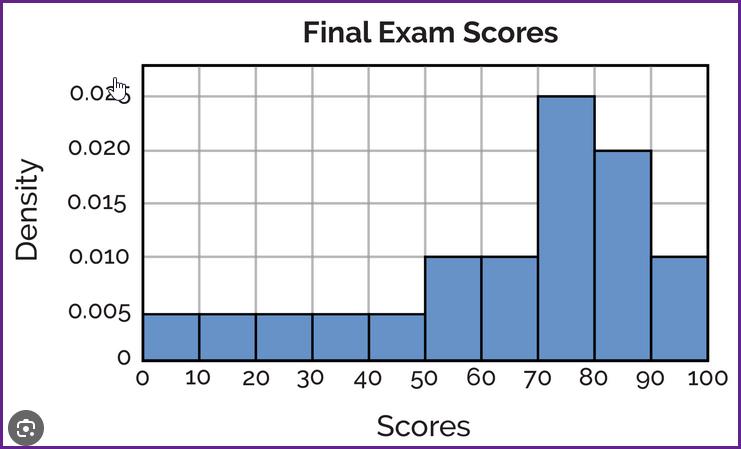
What would be an appropriate analysis for this histogram?
WRONG - A UNIMODAL, SKEWED LEFT OVERALL SHAPE, WITH A GROUPING TO THE RIGHT
In any boxplot, the width of the box shows what characteristic of the data values?
A resistant measure of the spread of the data values.
What is the correct equation to calculate the sum of squares?
SOS = ∑(x-¯x)2
What is the sum-of-squares for the data set below?
7 3 -5 0 5
88
What is the sample variance for the following column of data values?
1 4 8 8 9
s2 = 11.5
What is the standard deviation for a column of 26 data values that have the following variance?
125
s = 11.18
Which one of the choices below is NOT one of the steps in the method to find percentiles?
Choose from the following options.
None of these other choices.
Calculate the value of the Index. (WRONG)
Find the Value in the ranked column of data values.
Move to the right to the correct Position. (WRONG)
What is the value of the lower fence, and the upper fence, in the five number summary shown below?
{0.2, 6.05, 6.45, 6.95, 8.2}
LF = 4.70, and UF = 8.30
When denoting a percentile as P-sub_k (Pk), what does the symbol k stand for?
The individual percentile desired (0,100).
Are the quartiles always percentiles?
Yes, they are just special names for specific percentiles.
In a data set used in statistics (imagine a MS Excel spreadsheet), match each type of information with its location below. In a row, In a column, In the data set
Variable information
Individual information
All the information
Variable: In a column.
Individual: In a row.
All: In the data set.
At a local seminar, every attendee was given a ticket having a number. During the seminar, numbers were randomly calculated, and a small gift was given to the attendee with that number. Is it possible for an attendee to get more than one gift?
Yes, because this is sampling with replacement.
Do location and spread measure the same characteristic in a column of data values?
No, location measures middle and spread measures width.
The science of statistics includes organizing data into columns. (T/F)
True, as it makes it easier to deal with large amounts of data.
Which of the following choices is NOT used as a graphical summary in the science of statistics?
A take-over plot.
What is the difference between a parameter and a statistic based upon?
Population data versus sample data.
What type of graph is most appropriate to display the shape of qualitative data?
A bar chart, where the bars do not touch each other.
Can any, and all, bar charts be changed into a Pareto chart?
Yes, because the categories are not over a real-number-line and can be rearranged.
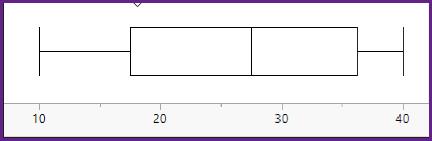
In this boxplot of continuous data, what is the value of the first quartile, the median, and the third quartile?
17.5, 27.5, 37.5
Why are efficient statistics sensitive to extreme values?
They use the data values in their mathematical calculations.
What is the proper statistical term for all the deviations, squared and added together?
The sum-of-squares.
What is the sample variance for the following column of data values?
1 1 1 1 1
s2 = 0.00
What is the sample variance for the following column of data values?
-10 6 5 9 -5
σ2 = 65.50 = WRONG
What information does the interquartile range give about a column of data values?
The spread of the middle 50% of the data values.
Why do resistant statistics work better than efficient statistics for a column of data values that has extreme values?
Bc extreme values are in the tails, while resistant stats are near the location = WRONG
Can the value of the third quartile ever be less than the value of the first quartile?
No, because the column of data values is ranked lowest to highest.
What is the value of the first quartile (Q1) / third quartile (Q3) in the following ranked set of 14 data values?
-19, -3, 11, 14, 15 18, 19, 24, 30, 37 40, 41, 44, 44
Q1 = 14 / Q3 = 40
A researcher is curious about the IQ of students at a local university. The entire group of students enrolled in the university is an example of what?
A population.
If simple random sampling does not guarantee a good sample, representative of the population, why use simple random sampling at all?
Bc its mathematics are easier to work with = WRONG
Bc it standardizes sampling across all situations = WRONG
Which of the following is NOT a common way to see a distribution?
Choose from the following options.
An equation, showing a mathematical representation of the values and counts of each category = WRONG
What is the major advantage of using resistant statistics when describing a column of data values?
They are not strongly affected by extreme values.
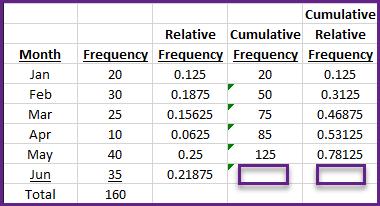
In the frequency table shown, what are the cumulative frequency and the cumulative relative frequency for the category Jun?
160 and 1.0
What is the general strategy used to analyze the information in a histogram?
Step 1: Look at the overall shape. Step 2: Look for exceptions.
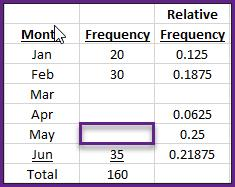
In the frequency table of 160 data values shown below, what is the frequency for the category May (May)?
40.
When is the mean the better measure of location?
When the column of data values is unimodal, symmetrical and no extreme values.
What is the sample standard deviation for the following column of data values?
1 2 3
s = 1.00
What situations are resistant statistics designed to handle?
The presence of extreme values or unsymmetrical shapes.
What is the five-number-summary for the column of data values shown below (n = 15)?
-19, -3, 11, 14, 15 18, 19, 24, 30, 37 40, 41, 44, 44, 90
{-19, 14, 24, 41, 90}
The Gallup News Service sent out 2,000 questionnaires for a survey about climate change. 1,004 people responded to the survey and gave their opinion. What type of data study is this survey?
An observational data study.
IQ tests have a population mean score of 100 IQ-points. If you select a sample of 50 people who took the test, their sample average would likely not equal 100. What statistical concept explains the difference between this population mean and sample average?
Sampling error from probabilistic data.
Why can the science of statistics determine the relationship between two variables, but it cannot determine the causation?
Because of the potential presence of a lurking variable.
What type of data is depicted in the plot?
Qualitative data.
Match the columns in a frequency table with their meanings: The number of times a value occurs, A partial sum of the Frequency column, A partial sum of the Relative Frequency column, The proportion of times a value occurs
Frequency
Relative Frequency
Cumulative Frequency
Cumulative Relative Frequency
Frequency: The number of times a value occurs.
Relative Frequency: The proportion of times a value occurs.
Cumulative Frequency: A partial sum of the Frequency column.
Cumulative Relative Frequency: A partial sum of the Relative Frequency column.
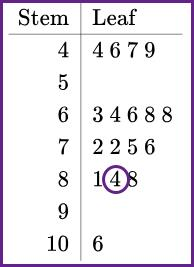
In the stem-and-leaf plot for the 17 data values shown, what is the data value that gives the circled number four (4)?
84.
What is the sample variance for a column of 19 data values that has a sum of squares of 36?
s2 = 2.00
What is the sample variance for the following column of data values?
101 104 108 108 109
s2 = 11.5
Match each characteristic of a column of data values below with the appropriate resistant statistic to measure it. Median, Inter-quartile range, Boxplot
Shape
Location
Spread
Shape: Boxplot.
Location: Median.
Spread: Inter-quartile range.
What is the concept that makes resistant statistics work for a column of data values with extreme values or an unsymmetrical shape?
Their calculations are based on the positions of the data values.
What is the 35th percentile (P35) / 65th percentile (P65) in the following ranked set of 15 data values?
9, 13, 14, 14, 15 18, 19, 24, 30, 37 40, 41, 44, 44, 193
P35=18.5 / P65 = 38.5 = WRONG
A five-point Likert scale uses the values of strongly disagree, disagree, neutral, agree, and strongly agree). What type of data is given by a Likert scale?
Discrete data = WRONG
Which of the following is NOT a part of the process of statistical abstraction.
Choose from the following options.
Writing down the question in fewer words.
Writing down relevant numerical information.
Writing down summary numbers describing the column of data values.
Writing down exactly what the statistical question is.
Writing down the question in fewer words.
Which one of the following choices is NOT true about a parameter?
Choose from the following options.
A parameter can be calculated from a column of sample data values.
A parameter is often denoted with Greek symbols.
A parameter gives information about a population.
A parameter value is a constant.
A parameter can be calculated from a column of sample data values.
What two characteristics do you look at to analyze the shape of a column of data values?
symmetry and modality = WRONG
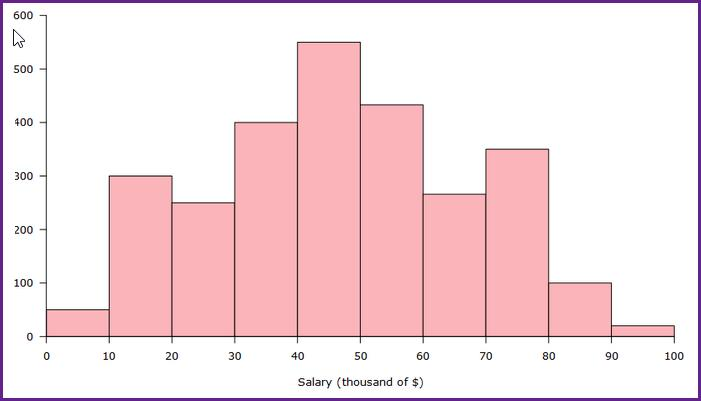
In the histogram shown, what would be an appropriate analysis for this histogram?
a unimodal, symmetrical overall shape, with two extra peaks - WRONG
To calculate the variance of a column of data values, does the science of statistics use an average of the deviations?
No, it uses an approximate average of the squared deviations.
What is the efficient measure of spread for a column of data values?
The standard deviation.
In finding a percentile (Pk), how is the appropriate move in Step 2: Move to the right to the correct Position decided?
Are there any extreme values in the data set that has the five number summary shown below?
{1.0, 7.5, 8, 13, 20}
No extreme values because the fences are -1.0 and 21.25.
Choose the answer below that correctly ranks the sizes of the following.
Choose from the following options.
Population > Sample > Individual.
Individual > Sample > Population.
Population > Individual > Sample.
Sample > Population > Individual.
Population > Sample > Individual
Statistics is the science of decision making using random selection of choices.
No, statistics uses a random selection of numbers = WRONG
For a column of data values with a standard deviation of 2, match the value of each distance below for the data values 10 and 4. 6, 3
Math Distance
Stat Distance
Mathematical Distance: 6
Statistical Distance: 3
For qualitative data, match the characteristic of a column of data values with the best statistic that measures it. Count of the data values, Mode, Number of categories, Bar Chart
Size
Shape
Location
Spread
Size: Count of the data values
Shape: Bar Chart
Location: Mode
Spread: Number of categories
Why is it important to look at the data first, before you look at the statistics?
Because the overall shape, and the exceptions, can affect the values of the statistics.
In a histogram for continuous data, what does a skewed-left shape mean?
A stretched out left tail.
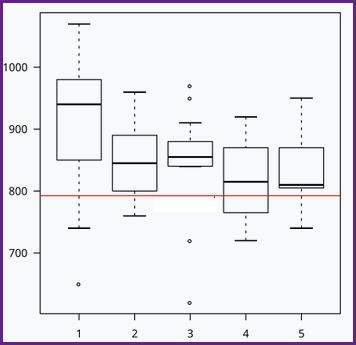
In the boxplots of continuous data values shown, what percent of the data values lie inside each box, and what percent lie outside each box?
It differs for each box plot = WRONG
Why is the value of the mean often thought of when considering the information in a column of data values?
Because the mean is a single number that best represents all the values in a column of data values.
Why does the sum-of-squares usually get bigger as more data values are added to the column of data values?
New data values tend to have positive deviations = WRONG
What situations are resistant statistics designed to handle?
What is the value of the 40th percentile (P40) / 60th percentile (P60) in the following ranked set of 15 data values?
9, 13, 14, 14, 15 18, 19, 24, 30, 37 40, 41, 44, 44, 193
P40 = 18.5 / P60 = 33.5
What is the standard deviation for the following five data values?
values not listed
3.81