Phase 3: Standardization
1/33
There's no tags or description
Looks like no tags are added yet.
Name | Mastery | Learn | Test | Matching | Spaced | Call with Kai |
|---|
No study sessions yet.
34 Terms
What are the 7 steps in phase 3?
Sampling plan
Selecting appropriate respondents
Specifying administration and scoring methods
Piloting and revising tests
Analyzing the Results
Revising the test
Validation and cross-validation
What happens in Phase 3, STEP 1: Sampling Plan (Hint: What is a standardized Sample)
Defining the target population for comparison (age range, special needs)
But also a group to compare test takers with
The standardized sample is a sample of test takers who represent the population for which the test is intended to measure (page 21).
The standardization sample for a test determines the norms and forms of the reference group to whom examinees are compared.
Ideally one would obtain a true random sample, but this is often not possible
Sample must be representative
Best method is to use a population proportionate stratified random sampling plan (e.g., age, gender, socioeconomic status, culture, nationality, and educational level).
Determine the appropriate size of the sample overall
What happens in Phase 3, STEP 2: Selecting appropriate respondents (Hint: Define; Population, sample, probability sampling, and non-probability sampling)
Population: all members of the target audience.
Sample: administering a survey to a representative subset of the population.
Probability sampling: is a type of sampling that uses statistics to ensure that a sample is representative of a population.
Nonprobability sampling: is a type of sampling in which not everyone has an equal chance of being selected from the population.
What are the types of Probability Sampling? (Hint: there are 4 types)
Simple random sampling
Stratified random sampling
Cluster sampling
Systematic random sampling
Probability Sampling: Simple random sampling
every member of a population has an equal chance of being chosen as a member of the sample.
To select a random sample, many people use a table of random numbers.
Using this technique, a researcher assigns consecutive numbers to each individual in the population.
Then, using a table of random numbers the researcher reads the numbers in any direction.
Because each member of a population has an equal chance of being selected, we often presume that a simple random sample will be representative of the characteristics of a population
Unfortunately, simple random sampling does not ensure that the sample will include adequate proportions of individuals with certain characteristics.
Probability Sampling: Stratified random sampling
population is divided into subgroups
a population is divided into subgroups or strata (e.g., gender, age, socioeconomic status). A random sample is selected from each stratum.
If there is not a sufficient number of respondents in some of the subgroups in which you are interested, any conclusions you reach may not accurately generalize to the full population.
Probability Sampling: Cluster sampling
is used when it is not feasible to list all of the individuals who belong to a particular population and is a method often used with surveys that have large target populations
Clusters are selected and participants are selected from each cluster.
More specifically…
Occasionally, the individuals in the population are already clustered in preexisting groups, and a researcher can randomly select groups instead of selecting individuals.
EX. a researcher may want to obtain a large sample of third- grade students from the city school system.
Instead of selecting 300 students one at a time, the researcher can randomly select 10 classrooms (each with about 30 students) and still end up with 300 individuals in the sample
cluster sampling can be used whenever well-defined clusters exist within the population of interest.
Probability Sampling: Systematic random sampling
every nth person is chosen (e.g., every 3rd person)
every nth (e.g., every fifth) person in a population is chosen as a member of the sample.
To sample systematically, the researcher assigns consecutive numbers to each individual in the population and then selects every nth person to become a member of the sample.
This technique has the same weakness as random sampling
What are the types of Nonprobability Sampling? (Hint: there's 1 lol)
Convenience sampling: the survey researcher uses any available group of participants to represent the population
Define Sample Size
refers to the number of people needed to represent the target population accurately.
How large your sample size should be is dependent on other factors
Define homogeneity of the population and its implications
how similar the people in your population are to one another
The more similar the members of the population, the smaller the sample that is necessary.
The more dissimilar the members of the population, the larger the sample that is necessary to have this variation represented in the sample.
Remember that the fewer the people chosen to participate in a survey (the smaller the sample), the more error the survey results are likely to include.
Define sampling error
a statistic that reflects how much error can be attributed to the lack of representation of the target population by the sample of respondents chosen
What happens in Phase 3, STEP 3: Specifying administration and scoring methods (Hint: its quite literal)
determine such things as how test will be administered (e.g., orally, written, computer- individually or in groups)
method of scoring, but also whether scored by hand by test administrator, or accompanied by scoring software, or sent to test publisher for scoring
Phase 3, STEP 3: Specifying administration and scoring methods – What are the Raw scoring methods? (Hint: There are 3 main ones)
Cumulative/Summative model
Ipsative Model
Categorical model
Raw scoring methods: Cumulative/Summative model
most common
assumes that the more a test taker responds in a particular fashion the more he/she has of the attribute being measured (e.g., more “correct” answers, or endorses higher numbers on a Likert scale)
To score a test using the cumulative model, the test taker receives one point for each correct answer and the total number of correct answers becomes the raw score on the test
correct responses or responses on Likert scale are summed
More things you get right, the more you have (e.g., iq)
yields data that can be interpreted with reference to norms
Assuming that the test questions are comperable, scoring leads to interval level data
Cumulative/Summative model - Semantic Differential
Adjective pairs at each end of the continuum
One end, certain way of describing a person
Kinda like a likert scale
Still cumulative
Likert Scales
Visual analog – researcher assign scores through the continuum
Breaks down amount in between numbers on the scale
Kinda like a ruler

Raw scoring methods: Ipsative Model
test takers is given 2 or more options to choose from.
generally uses forced choice items
typically yields nominal data because it places test takers in categories - e.g., The # of T or F, Y or N, Agree or Disagree
Place an “X” in the space to the left of the word in each pair that best describes your personality
No comparing, just trying to understand someone
"you are more like this", not categorizing
The test taker is required to indicate which of the items is "most like me" and which is "least like me"
The choices in each group are carefully chosen to be equal in desirability
Each test item will contain statements associated with more than one trait or construct
E.g., a test item might contain the following choices:
I tried to lead others
I like a leisurely lifestyle
I hold back my opinions
I do a lot in my spare time
Raw scoring methods: Categorical model
is used to put the test taker in a particular group or class.
Test takers scores are not compared to that of other test takers but rather compare the scores on various scales WITHIN the test taker (Which scores are high & low)
typically yields nominal data because it places test takers in categories - e.g., The # of T or F, Y or N, Agree or Disagree
Still a forced choice, except you're put into a category
The more you say yes or no, places you in a category
E.g., The test taker must display a pattern of responses that indicates A clinical diagnosis of a certain psychological disorder or the attributes that make up a behavioral trait
Main difference between categorical and ipsative?
Ipsative:
Compares an individual's scores on various scales within themselves to determine relative strengths and weaknesses
Categorical:
Assigns a person to a specific category or label based on predefined criteria and cutoffs (e.g., a diagnosis of a personality disorder or a specific job role fit).
What happens in Phase 3, STEP 4: Piloting and revising tests
can’t assume the test will perform as expected
the pilot test is a scientific investigation of evidence that suggests that the test scores are reliable and valid for their specified purpose.
The pilot-testing process involves administering the test to a sample of the test’s target audience and analyzing the data obtained from the pilot test.
administer test to sample from target audience
Not the standardized sample
Must be big
analyze data and revise test to fix any problems uncovered
test developers rely on their pilot tests to provide evidence that their new test will produce scores that will be useful for decision making without harming test users or respondents.
Phase 3, STEP 4: Piloting and revising tests – Setting up the Pilot Test
test situation should match actual circumstances in which test will be used (e.g., in sample characteristics, setting)
Still have to follow strict rules
Should follow structure when testing your items (simulate the test for accuracy)
developers must follow the American Psychological Association’s codes of ethics (e.g., strict rules of confidentiality and publish only aggregate results)
Phase 3, STEP 4: Piloting and revising tests – Conducting the Pilot Test
a scientific evaluation of the test’s performance
depth and breadth depends on the size and complexity of the target audience and the construct being measured
adhere strictly to test procedures outlined in test administration instructions
generally require large sample
may also ask participants about the testing experience
What happens in Phase 3, STEP 5: Analyzing the Results? (idek man, just yap about qualitative and quantitative data)
can gather both quantitative and qualitative information
use quantitative information for such things as item characteristics, internal consistency, test retest, inter-rater, convergent and discriminate validity, and in some instances predictive validity
qualitative data may be used to help make decisions
Phase 3, STEP 5: Analyzing the Results – Define Item analysis
how developers, publishers, or authors evaluate the performance of each test item.
The major portion of such a study involves quantitative item analysis: statistical analysis of the responses test takers gave to the individual items
Define Item Difficulty, and how this is measured
the percentage of test takers who respond correctly (vs. total # of people) assesses the p value (percentage value).
p = the Number of people who respond correctly / the number of people who responded at all
P stands for probability and percentage
The pilot test provides the data for judging the item difficulty
p value of .5 is optimal (higher is too easy and lower is too hard)
Out of 50 people, if 25 people got something right, they a p value of 0.5
P value tells you the difficulty based on how many people get an item correct
The purpose of norm referenced tests is to compare the test scores of various individuals
Therefore it is important for there to be variability in individuals test scores
The P value of the item difficulty provides an accurate indication of how difficult the item was for the test takers in the pilot study
However the P value does not provide information on the usefulness of the item in measuring the tests construct
Those who have more of the attribute being measured are more likely to respond correctly to the item, but this is not always the case
A high or low P value can result from two different conditions
If it was high it could mean that the item was legitimately too easy or that the group selected for the pilot test possessed in especially high level of knowledge, skill, or ability in the construct being measured
Define the Discrimination Index and its components
compares the performance of those who obtained very high test scores (the upper group [U]) with the performance of those who obtained very low test scores (the lower group [L]) on each item.
Because inferences regarding the meaning of high and low test scores will be made by the users of the test, it is important to obtain a measure of how well each item separates those test takers who demonstrate a high degree of skill, knowledge, attitude, from those who demonstrate little of the same
D = U (# of in upper group who responded correctly/total # in upper group x 100) – L ((# of in lower group who responded correctly/total # in lower group x 100)
E.g., If 90% of the highest scoring test takers correctly answered the question, well only 20% of the lowest scoring test takers did, D = 90 - 20 = 70
A discrimination index of 30 and above is desirable
D = 30
If a test is well constructed, each item on it should be a measure of the concept of interest
With this, there should be a statistical relationship between how an individual answer is a particular item and their overall score on the test
After calculating a D value for each item, test developers look for items that have high positive numbers
The most desirable D values are 30 and higher
But they typically fall between 20 and 30
Negative numbers indicate that those who scored low on the test overall responded to the item correctly and that those who scored high on the test responded incorrectly
Low positive numbers suggest that nearly as many people who had low score just answered correctly as those who had high scores
Each of these situations indicate that the item is not discriminating between high scorers in low scorers
Therefore, test developers discard or rewrite items that have a low or negative value
What is an Item-total correlation?
a measure of the strength and direction of the relation between the way test takers responded to one item and the way they responded to all of the items as a whole.
0.3 and above
This is done using the Pearson product moment correlation formula
Once items on a test are all measuring a similar construct, it is reasonable to assume that individuals who answer a particular question correctly will obtain a higher total score on the test than individuals who answered the question correctly
Because of this, item total correlations are usually reviewed as part of the process of item analysis
Developers want to retain the items that strongly differentiate high scoring individuals from low scoring individuals
This is indicated by a positive item total correlation
Worst cases have the item total correlation coefficient negative
This means that the people who answered a question correctly actually did worse on the test than people who got the question wrong
What is an Interitem correlation matrix?
displays the correlation of each item with every other item.
Usually each item has been coded as a dichotomous variable, meaning that the matrix will be made-up of Phi coefficients
Provides important information for increasing the tests internal consistency
Each item should ideally be correlated with every other item measuring the same construct and should not be correlated with items measuring a different construct
In practice these correlations tend to be small (between 0.15 to 0.20)
The test developer uses the data from the pilot test to calculate an overall estimate of internal consistency, and then the developer consults the inter item correlation matrix to see which items should be dropped or revised
Interitem correlation matrix: Phi coefficients
the result of correlating two dichotomous (having only two values) variables.
These coefficients are interpreted exactly like Pearson product moment correlation coefficients
What is Item-response theory (IRT)?
estimates of the ability of test takers that is independent of the difficulty of the items presented as well as estimates of item difficulty and discrimination that are independent of the ability of the test takers.
This theory relates the performance of each item to a statistical estimate of the test takers ability on the construct being measured
This is a statistic
There are different ways of finding IRT
The newest and most scientific way at looks at item difficulty and discrimination
IRT is not used for all test item analysis because they require very large sample sizes
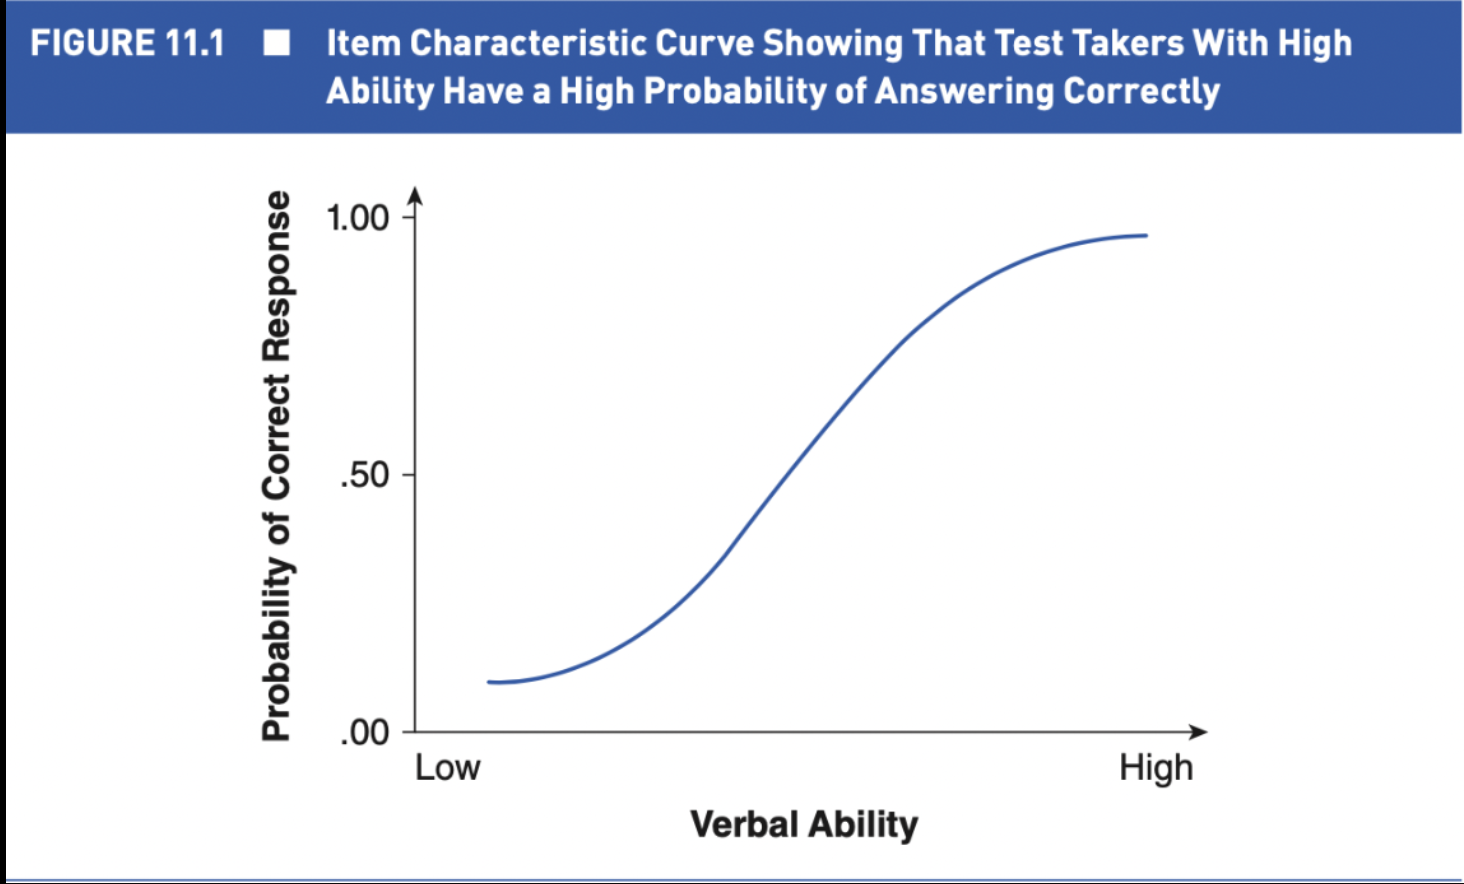
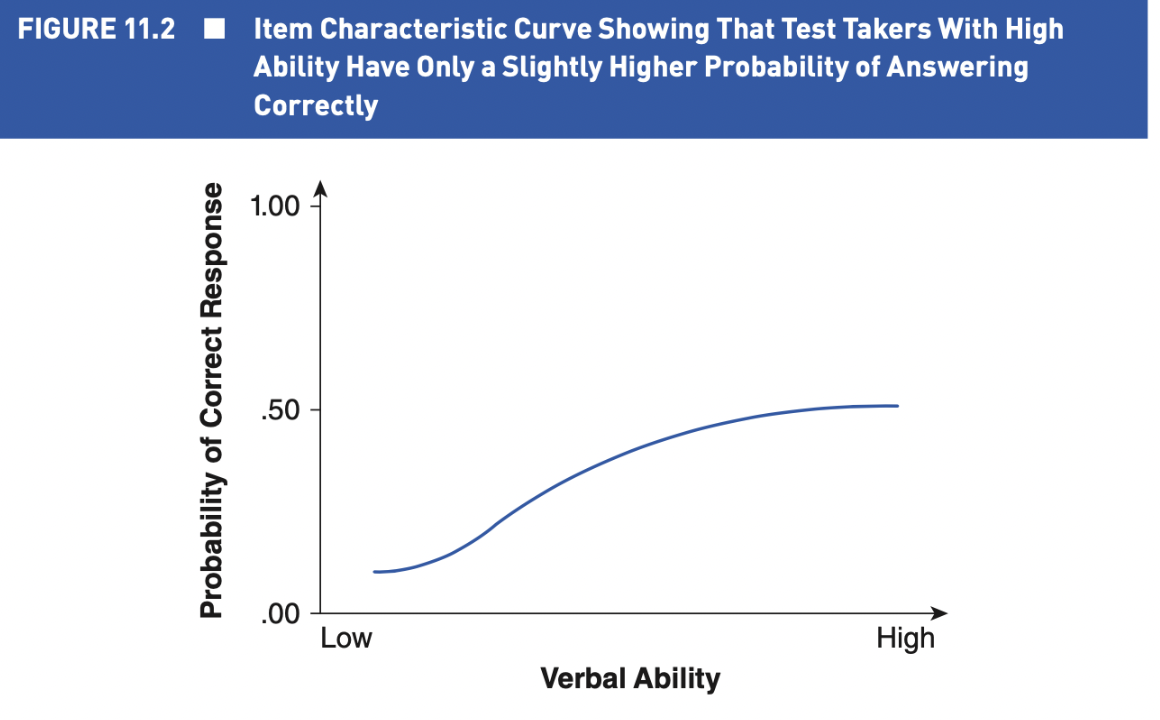
IRT - What are Item characteristic curves?
the line that results when we graph the probability of answering an item correctly with the level of ability on the construct being measured.
This is the output of IRT
The ICC provides a picture of the item's difficulty and how well it discriminates high performers from low performers
Items with greater slopes provide better discrimination between high performers and low performers
We can determine the difficulty of an item on the ICC by locating the point at which the curve indicates a probability of 0.5 (a 50/50 chance) of answering correctly
The higher the ability level associated with this point, the more difficult question
Less ability is associated with having a 50/50 chance of answering correctly
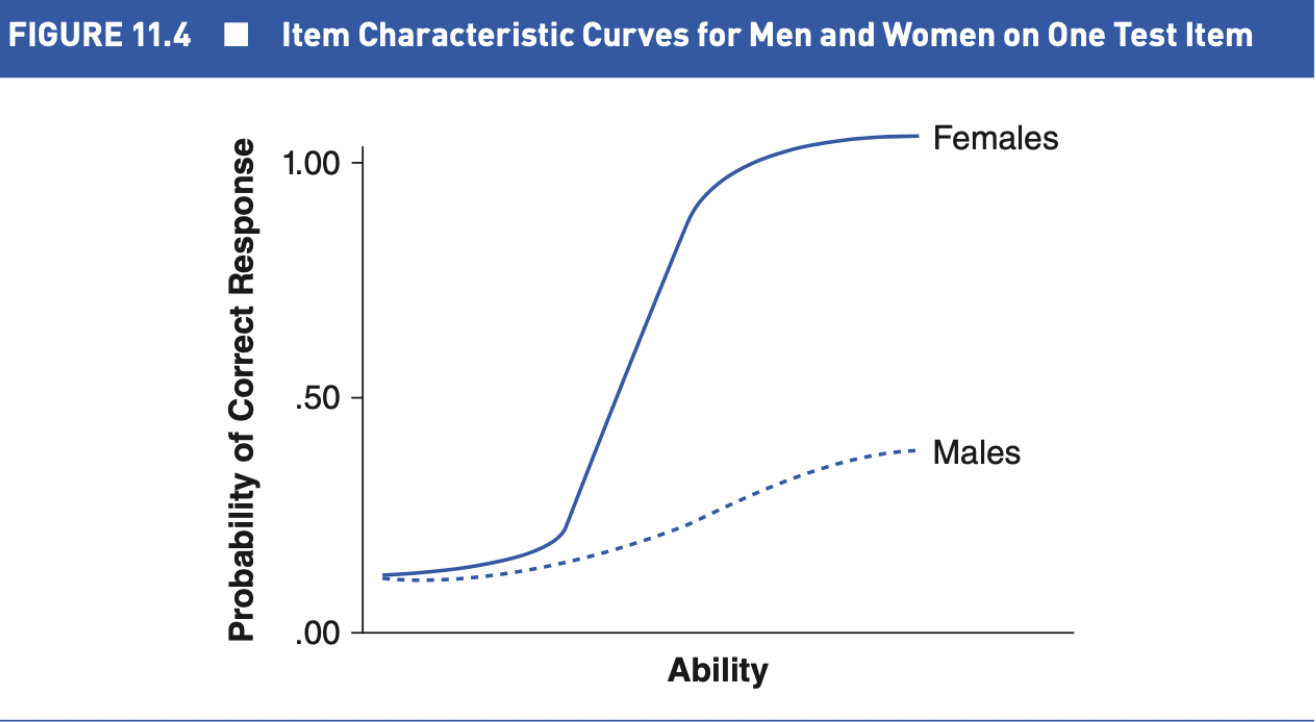
What is Item bias?
when an item is easier for one group that for another group
Test items should be of equal difficulty for all groups
The preferred method of eliminating item bias involves the computation of item characteristics by group and using the ICC's to make decisions about item bias
By plotting the curves on a graph, differences in difficulty and discrimination can be detected readily
What happens in Phase 3, STEP 6: Revising the test
Choosing the final items requires weighing each item’s content validity, item difficulty and discrimination, inter-item correlation, and bias
should items be left in if not statistically viable?
when new items need to be added or items need to be revised, the items must again be pilot tested to ensure that the changes produced the desired results
What happens in Phase 3, STEP 7: Validation and cross-validation
Validation is the process of obtaining evidence that the test effectively measures what it is supposed to measure (i.e., reliability and validity)
first part of establishing content validity is carried out as the test is developed--that it measures the constructs (construct validity) and predicts an outside criterion is determined in subsequent data collection
when the final revision of a test yields scores with sufficient evidence of reliability and validity, test developers then conduct cross- validation--a final round of test administration to another sample (target)