normal distribution & 68-95-99,7 rule
1/18
Earn XP
Description and Tags
normal distribution & 68-95-99,7 rule
Name | Mastery | Learn | Test | Matching | Spaced | Call with Kai |
|---|
No analytics yet
Send a link to your students to track their progress
19 Terms
Parameter
a number that describes the data from a population
Statistics
a number that describes data from a sample
Sample (mean & standard deviation) signs
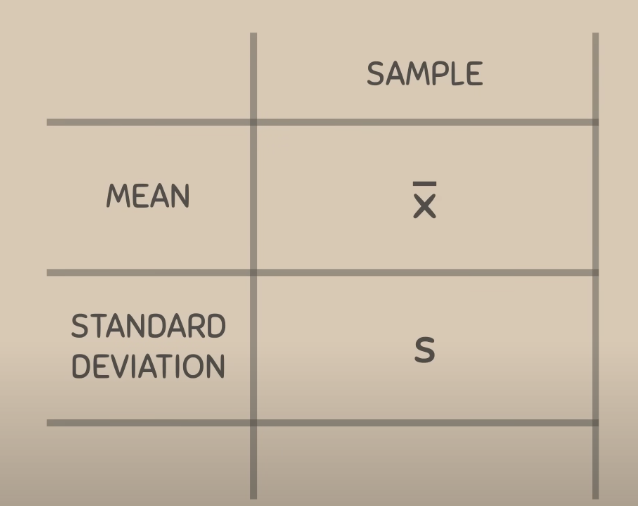
these are statistics
population (mean & standard deviation) signs
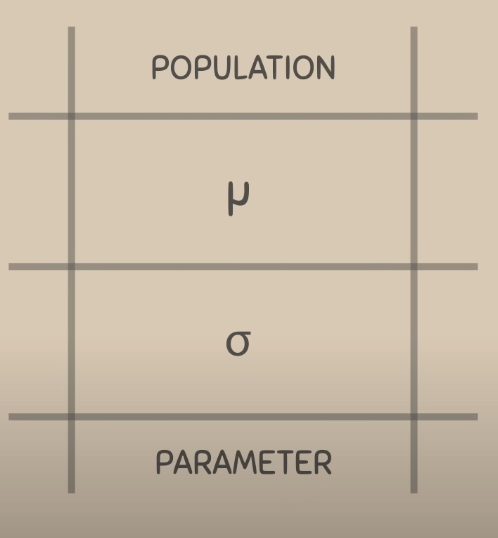
these are parameters
important when we talk about normally distributed populations
Normal distribution
a special type of density curve which is bell shaped
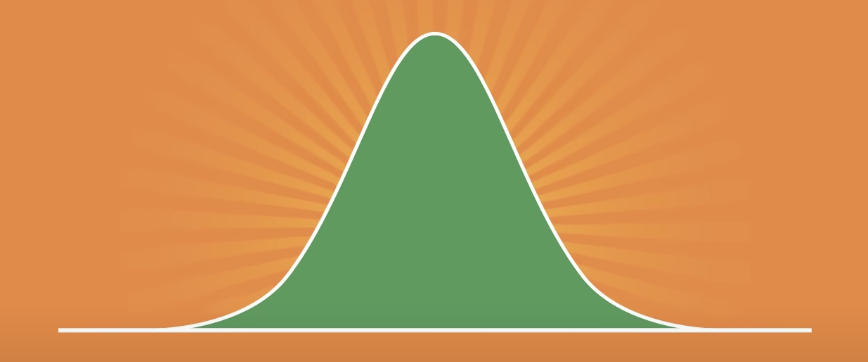
what does the normal distribution describe
the tendency for data to cluster around a central value, which is the mean
the mean is always located in the middle or central (mu is the mean in a population distribution, and x-bar is the mean in a sample distribution)
how we describe a normal distribution
some data values fall below the mean

some data values fall above the mean
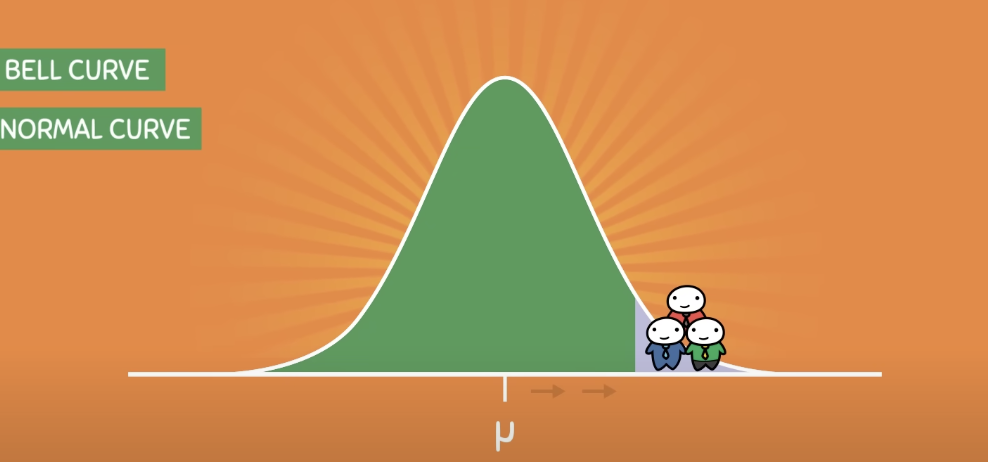
but most of the data values are located near the mean
in normal distribution
characterizes the position of the normal distribution
if we increase the mean, the curve will follow & move towards the right
if we decrease the mean, the curve will follow & move towards the left
this happens because the data will always cluster around the mean in normally distributed populations, thus the value of the mean determines the position of the normal distribution.
in normal distribution
sigma characterizes the spread of the normal distribution
the larger the standard deviation the more spread out the distribution will be
the smaller the standard deviation the less spread out the distribution will be
when the spread increases
the curve gets much flatter

when the spread decrease
the spread gets much taller

what is the reason for that the curve gets flatter or taller when data increase or decrease
the normal distribution is a density curve, & the total area of any density curve must remain equal to 1 or 100% = thus the changes in the width of the curve must be compensated by changes in the height of the curve
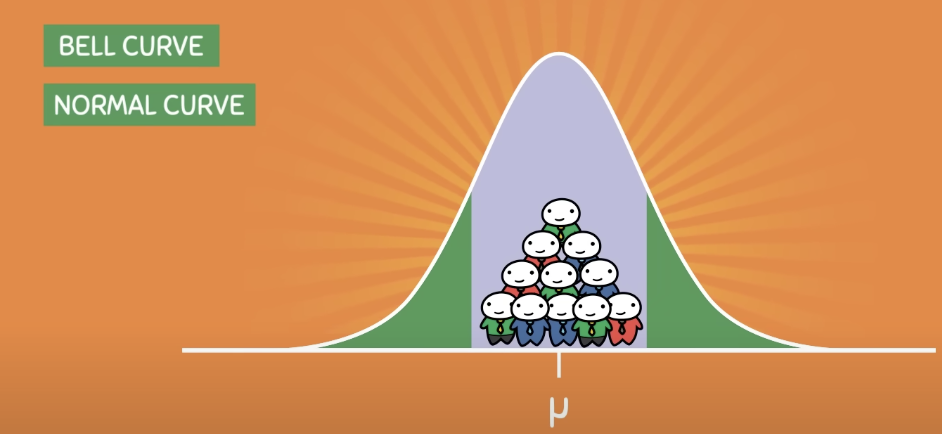
The normal distribution is unimodal
meaning that the normal distribution has a single peak
the normal curve is symmetric about its mean
meaning that the distribution can be cut into two equal halves
the parameters mu and the sigma completely characterizie the normal distribution
meaning that the population mean mu determines the location of the distribution and where the data clusters around the population standard deviation sigma determines how spread out the distribution will be

the notation given to a population that follows a normal distribution
for the variable X, it follow a normal distribution and has the mean mu with a standard deviation of sigma
68-95-99,7 rule
in a distribution we first need to create the intervals that increase by the standard deviation (sigma in population/ s in sample)
within one standard deviation away from the mean, the total area contains of 0.68 or 68%
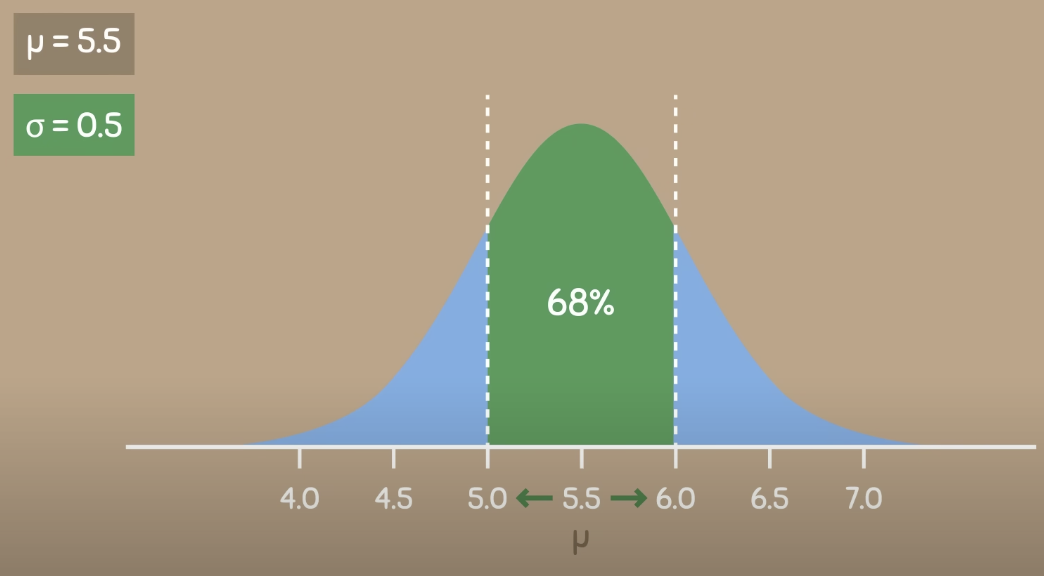
we can say that 68% of the population have a height between 5.0 & 6.0 feat
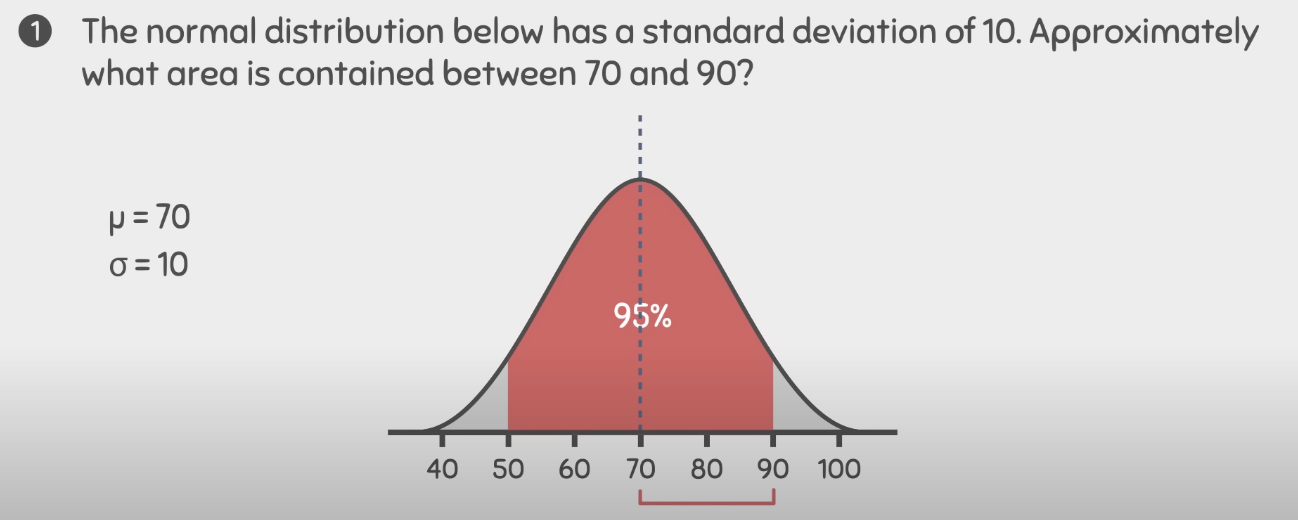
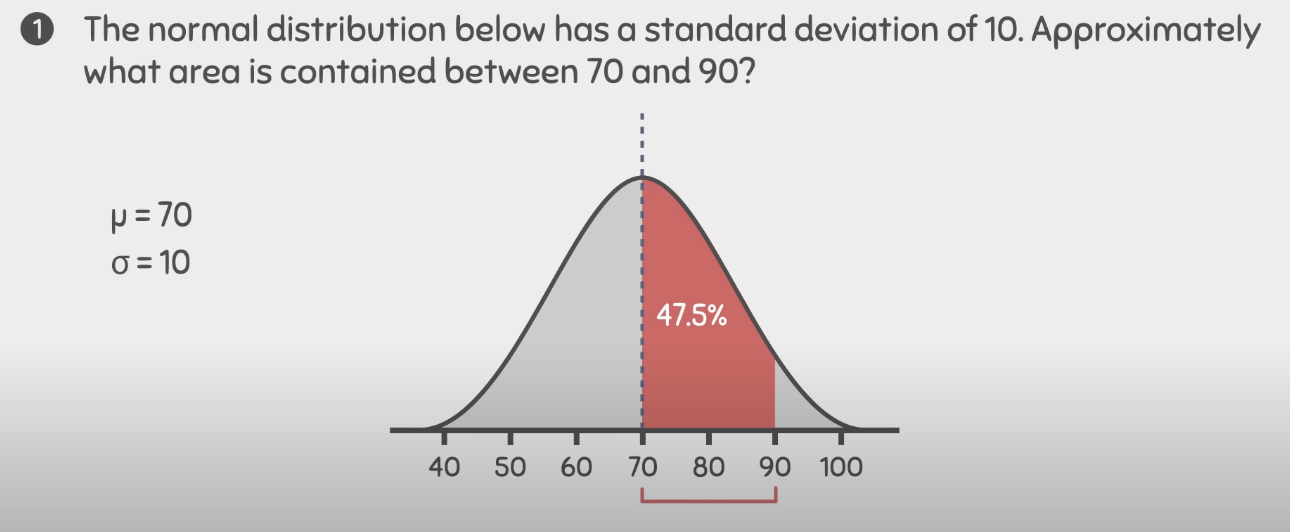
within two standard deviations away from the mean, the total area contains of 0.95 or 95%
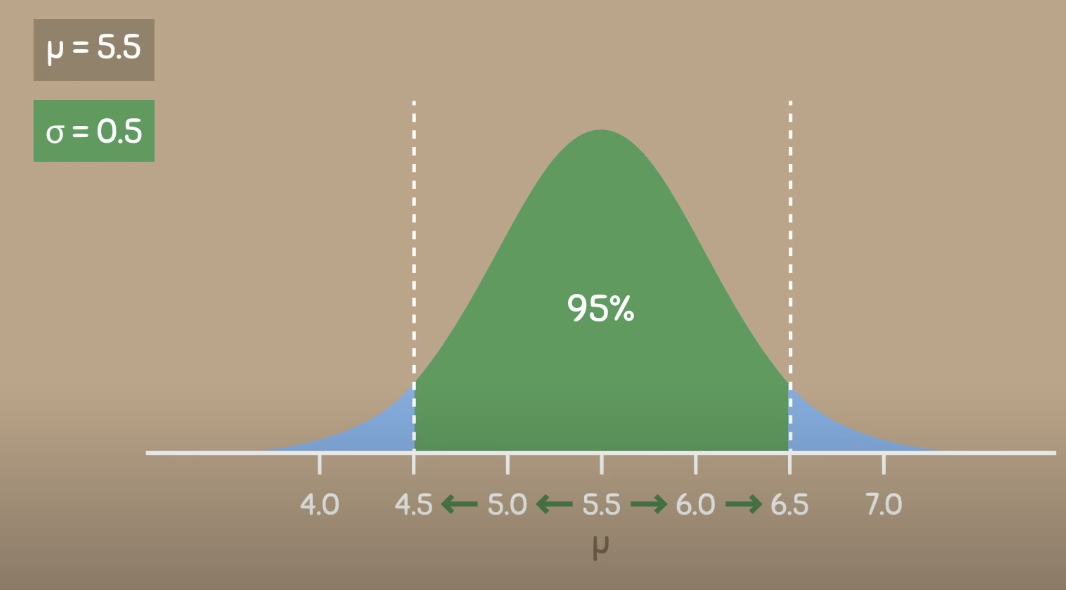
This means that 95% of the people in the population have a height between 4.5 & 6.5 feat
within three standard deviations away from the mean it contains a total area of 99,7%
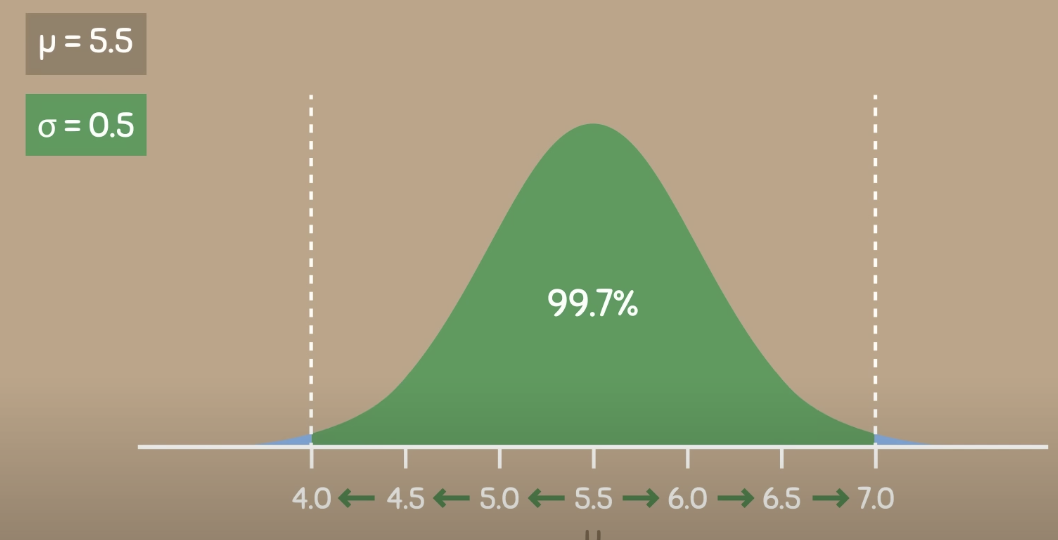
we can say that 99,7% of the people in a population have the height between 4.0 and 7.0.
What happens if we go four or six standard deviations from the mean?
since a normal distribution never touches the x-axis, you can go to the infinity, but the distribution will be very small