Single Sample Tests
 Call Kai
 Learn
Learn Practice Test
 Spaced Repetition
 Match
Match Flashcards
 Knowt Play
1/13

There's no tags or description
Looks like no tags are added yet.
Name | Mastery | Learn | Test | Matching | Spaced | Call with Kai | Chat |
|---|
No analytics yet
Send a link to your students to track their progress
14 Terms
Descriptive statistics
Describes the data you collected.
Shows the center, spread, and shape of the data
Mean, median, mode, standard deviation, graphs
Inferential Statistics
Uses sample data to make conclusions about a population.
Helps test hypotheses and estimate population values
t-tests, chi-square tests, ANOVA, correlation, regression
Hypothesis Testing Cannot Tell Us
If the design of a study is flawed
If the data were appropriately collected
If the sample is representative of the population
If the theory is true or false
Power
Probability that a study will reject the null hypothesis, when the original (H0) is false. The likelihood of detecting an effect if it exists.
Single Sample Test
Compares one sample to one known or expected value.
Checks whether the sample is significantly different from that value.
A single-sample test can compare your sample to:
A hypothetical population mean (e.g., 50)
A previously known population mean
A target/expected value

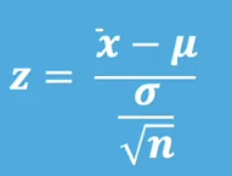
Z-Score
A z-score is a standardized score that shows how far a value is from the mean.
Data is standardized by converting values into z-scores. mean = 0 std = 1
Hypothesis Testing Steps
Identify the population parameter (what you're studying).
State the null hypothesis (H₀) (no difference or no effect).
State the research hypothesis (H₁) (there is a difference or effect).
Choose the correct statistical test (e.g., z-test, one-sample t-test, proportion test).
Choose a significance level (usually p = .05) and determine the rejection region.
Calculate the test statistic.
Decide whether to reject or keep the null hypothesis.
Steps 1–5 are done before collecting data.
Effect Size
Effect size tells you how big the difference is between two groups. Differences between means is Cohen's d.
d = 0.2 small
d = 0.5 medium
d = 0.8 large
P-value: Is there a difference?
Effect size: How big is the difference?
P-Value
Tells us the p given H0 is true
Rejecting H0 does not mean that it's false - could still have type I error
Failing to reject H0 does not mean H0 is true - could still have type II error
Remember: controlling one type of error can increase the other one
Statistical Significance: means that it is unlikely that the results are due to chance alone
Critical Values of Z
Critical values tell you when to reject the null hypothesis
For a non-directional test, we have both an upper AND a lower boundary (+ - 1.96)
For a directional test (one tailed), we have an upper OR a lower boundary (-1.645 or +1.645)
One Sample t-Test
Used to test whether the average of one sample is different from a known population mean.
The t-value tells you how far your sample mean is from the expected mean.
The t-distribution depends on the degrees of freedom (df = n − 1).
As the sample size (and df) increases, the t-distribution becomes more like the normal (z) distribution.
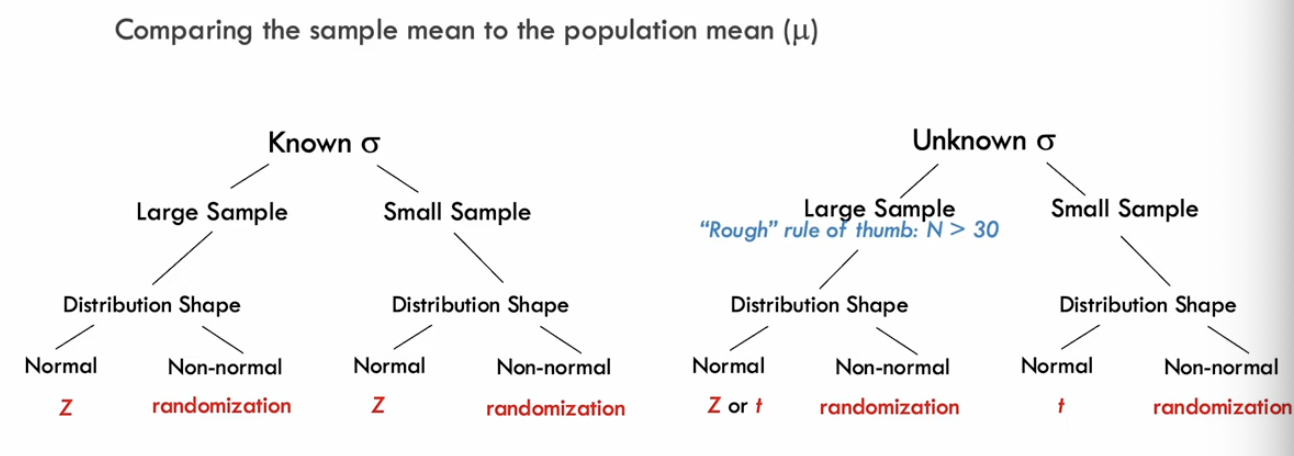
z-test population standard deviation is known.
Randomization Test
Estimates the p-value by repeatedly creating new samples from the original data.
Large sample is when n>30
Take a random sample from the original data.
Calculate the t-value.
Repeat many times.
Create a distribution of the t-values.
Compare your original t-value to the distribution to get the p-value.
Proportions
A proportion test checks whether a percentage (proportion) is different from an expected percentage or whether two percentages are different.
Example:
You expect 50% of students to prefer online classes. You survey 100 students and find 65% prefer online classes. A proportion test tells you whether 65% is significantly different from 50%.
Z-test and t-Test Comparison
Use a Z-test
You know the true population standard deviation.
Use a One-Sample t-test
You don't know the population standard deviation.
You only have your sample data.