C4.1 Populations and Communities
1/39
There's no tags or description
Looks like no tags are added yet.
Name | Mastery | Learn | Test | Matching | Spaced |
|---|
No study sessions yet.
40 Terms
Define population.
A group of individual organisms of the same species living in a given area.
State what isolates populations of the same species.
Geographical barrier that prevents interbreeding --> reproductively isolated.
Define sample.
A small portion of a population allowing for estimates.
Outline the purposes of sampling a population.
Usually impossible to count every organism in a population due to camouflage or movement.
Allows for estimates based on evidence of populations.
Define sampling error.
Statistical error that occurs when the sample does not accurately represent the entire population.
Describe the need for randomness in sampling procedures.
Gives every organism an equal chance of being included in a sample to avoid sampling biases/ errors.
Outline the use of quadrat sampling to estimate the population of a sessile organism.
Repeatedly placing a quadrat frame at random positions in a habitat and recording number of organisms present.
Top/ right = In, Bottom/ left = out
Procedure:
1. Measuring tape base line along habitat edge.
2. Table/ random number generator to generate random numbers.
3. First number determines distance along tape, second determines perpendicular distance across the habitat.
4. Quadrat is placed precisely at the distances determined by the two random numbers.
Describe the method of capture- mark- release-recapture sampling to estimate the population of a motile organism.
1. Capture as many as possible with netting, trapping, or careful searching.
2. Mark each individual without making more visible to predators.
3. Release and allow all to settle back into habitat.
4. Recapture as many as possible and count how many marked and unmarked.
5. Lincoln index: Population size = (caught and marked initially x total number recaptured)/ recaptured with marks.
List assumptions made about the population when using mark-recapture methods to estimate population size.
No migration in or out.
No births or deaths.
Marked mix back into population and have same chance to be recaptured.
Marks remain visible.
Marks do not increase threat of predation or survival.
Define carrying capacity.
Maximum population size that an environment can support.
List examples of resources that may limit the carrying capacity of a population.
Plants: Water, light, soil nitrogen.
Animals: Water, breeding space, food, dissolved oxygen.
Outline population size control as an example of a negative feedback loop.
Density independent factors: Same effect no matter population size.
Density dependent factors: Increasing effect as population size increases.
Density dependent factors cause regulation of population size by increasing mortality rates as natality rates increase.
List examples of density- dependent factors that maintain population carrying capacity.
Competition: For limited resources like water/ nutrients.
Predation: More intense as population is more dense.
Disease, parasitism, prey infestation: Easier for spread from host to host.
Outline examples of density- independent factors that maintain population carrying capacity.
Natural disasters.
Flooding.
Outline conditions in which populations can grow exponentially.
Positive feedback: Breeding --> more reproduction --> more organisms can breed.
Density dependent factors are absent or ineffective.
--> Spread into new area or new ecological niche.
Abundant resources, no pathogens/ pests.
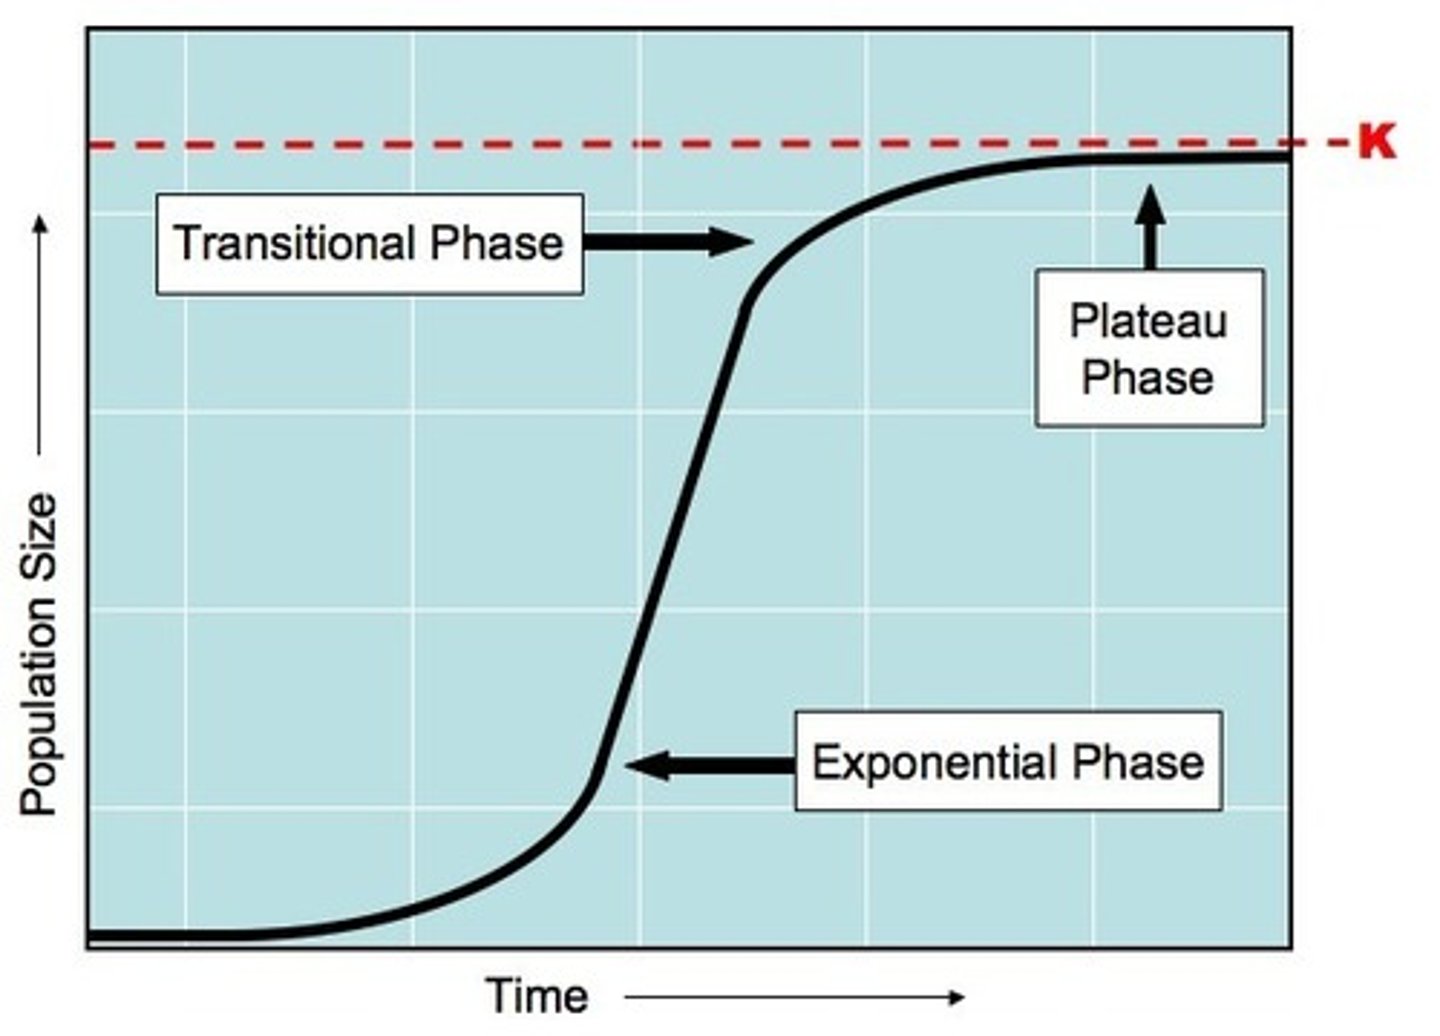
Explain the reasons for the pattern of sigmoid population growth curve.
Exponential growth: Abundant resources, low competition/ mortality.
Transition phase: Population growth slows due to reduced resource availability.
Plateau phase: No net growth, stable population size, reached carrying capacity.
Ex: Collared dove growth plateaued in the UK, Netherlands, and other places in Europe due to environmental factors like pests/ pathogens.
Outline a method for monitoring the population of yeast or duckweed over time.
Experiment: Carrying capacity of given container, ideal cnditions (light, nutrients, container surface area) for population growth.
Numbers monitored by data logging or regular counts.
Define intraspecific relationship.
A relationship that exists between individuals of the same species.
Competition and cooperation.
Outline cause and effect of competition in a population.
Share an ecological niche --> require same resources.
Some individuals more successful and gain more resources --> survive and reproduce --> natural selection to allow more effective competition.
List examples of competition and cooperation in plant and animal populations.
Competition: For light in plants, pollinators in flowering plants, food in animals, breeding sites in animals.
Cooperation: Communal roosting in animals, feeding in animals, defence against predation in animals, parental care in animals.
Define community.
Give an example of a community of organisms.
A group of populations living together and interacting with each other.
Coral polyps, fish, sea urchins, sponges, and algae.
Outline the ecological interactions within biological communities. Include mutualistic (++), competition (--), predation (+-), herbivory (+-), parasitic and pathogenic interactions (+-).
Mutualistic: Both species benefit.
Competition: Shared resources.
Predation: One species kills and eats the other.
Herbivory: Primary consumers feed on producers.
Parasitic: Host harmed and parasite benefits.
Pathogenic: Pathogen species causes disease in host.
State an example of mutualistic (++), competition (--), predation (+-), herbivory (+-), parasitic and pathogenic interactions (+-).
Mutualistic: Zooxanthellae living in hard coral cells.
Competition: Cows and bisons feeding on grass.
Predation: Anteaters feeding on ants or termites.
Herbivory: Bison feeding on grasses.
Parasitic: Ticks living on deer skin and feeding on blood.
Pathogenic: Potato blight fungus infecting potato plants.
Outline the mutualistic relationship within root nodules in Fabaceae (legume family).
Fabaceae: Provides protection from consumers, maintains low oxygen concentrations, and energy by photosynthesis.
Rhizobium (in root nodules): Fixes nitrogen to produce ammonium, supplies ammonium to plant, prevents nitrogen deficiency.
Outline the mutualistic relationship within mycorrhizae in Orchidaceae (orchid family).
Orchid: Supplies carbon compounds made by photosynthesis.
Fungus: Supplies orchid with nitrogen and phosphorus in soil, supplies water absorbed from soil.
Outline the mutualistic relationship of zooxanthellae in hard corals.
Zooxanthellae: Supplies carbon compounds and oxygen produced by photosynthesis.
Hard corals: Safe protected environment, grows close to sea surface for reliable light source, supplies carbon dioxide by respiration.
Define endemic and invasive species.
Endemic: Species that occur naturally in an area.
Invasive: Species that were accidentally or deliberately introduced by humans that increase and spread rapidly.
Describe the effect of invasive species on the realized niche of an endemic species.
Endemic occupies smaller realized niche due to being outcompeted by invasive species.
Outline the competition for resources in an example of endemic and invasive species.
Red lionfish endemic to coastal seas in Indo-Pacific.
Small number escaped from aquarium, multiplied and spread on coral reefs.
Adapted to avoid venomous vines and lack of predators.
Compete with endemic fish species by establishing territories for which other fish are excluded.
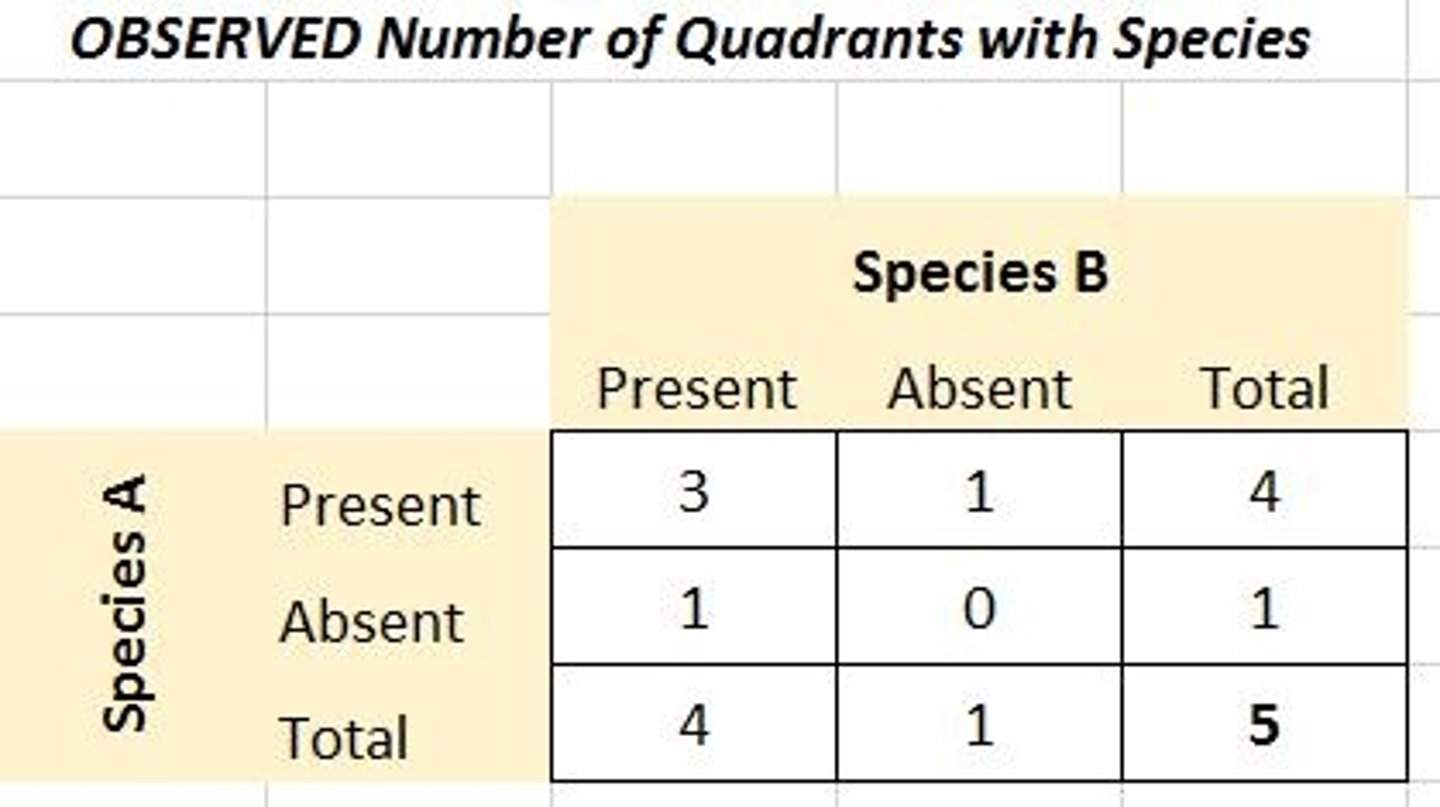
Explain the methodology and limitations of using a chi-square test to assess presence of interspecific competition in a community.
Tests for independence or associations between species and goodness of fit.
1. Define two hypotheses.
2. Draw contingency table of observed frequencies.
3. Calculate expected frequency: (row x column total)/overall
4. Calculate degrees of freedom: n-1 where n is number of outcomes.
5. Critical value is 3.83 (p < 0.05): If chi-squared is greater, alternative hypothesis accepted.
6. Chi-squared = Sum of (observed-expected)^2/expected.
Explain the use of direct experimentation to assess the presence of interspecific competition in a community.
Field manipulation: One of two species removed from quadrats --> if other increases in number, proves competition.
Lab experiments: Species grown together and apart in labs to investigate for competition.
State the null and alternative hypothesis of the chi-square test of association between species in a community.
Null: Two species distributed independently.
Alternative: Two species associated.
Use a contingency table to complete a chi-square test of association between species in a community.
Explain the typical dynamic equilibrium of populations of predator and prey.
Prey individuals are born and lost to predation at equal rates.
Birth and death rates of predators are equal.
Population sizes remain relatively stable.
Describe an example of an oscillating cycle of predator and prey population sizes.
Hunting records of red foxes (predators) and hares (prey) in Sweden --> depend on abundance of target species.
Population rises and falls occurred in a cycle for 16 years until a parasite outbreak occurred to the fox population, but the cycle resumed after about 10 years.
Compare and contrast top-down and bottom-up control of populations in communities.
Top-down: Higher to lower trophic level; increase in predators decreases prey number.
Bottom-up: Lower to higher trophic level; producers limited by mineral nutrient availability.
Define allelopathy.
Secretion of allelopathic agents into soil by plants to kill/ deter growth of neighboring plants.
Outline an example of allelopathy.
Tree of heaven in China became invasive across North America.
Releases allelopathic chemicals to stop growth of neighboring plants.
Define antibiotics.
Secreted by microorganisms to kill or prevent growth of other microorganisms.
Outline an example of the natural production and function of antibiotics.
Penicillium (fungi) secrete antibiotic penicillin to weaken cell walls of bacteria causing it to burst and die when penicillium resources are scarce.