Chapter 8 stats
1/43
There's no tags or description
Looks like no tags are added yet.
Name | Mastery | Learn | Test | Matching | Spaced |
|---|
No study sessions yet.
44 Terms
What null hypothesis is appropriate for both two-sample t-tests and for ANOVA?
H(0): The population means are equal.
What one alternative hypothesis is appropriate for both two-sample t-tests and for ANOVA?
H(1): The population means are not equal.
The ANOVA table tell if one population mean is less than another population mean?
False
What is the appropriate situation for the ANOVA method?
When the question is about the equality of three or more population means.
What is the main reason why three two-sample t-tests are not used to find out if three population means are equal?
Losing control of the Type I error rate (α).
In the ANOVA table, why are two variances analyzed when the question is about the equality of three population means?
Analyzing variances takes one hypothesis test, giving control of the Type I error rate (α).
What two variances are analyzed in the ANOVA table.
The theoretical variance of the sample averages coming from probability information.
The actual variance of the sample averages coming from sample information
What two equations express the main logic of the ANOVA table.
Does: the Actual Variance of the sample averages = the Theoretical Variance?
Does:
s^2χ=s^2/n
In the ANOVA table, what information does the Theoretical Variance give?
The spread of the sample averages if they all came from one population.
Select the two tables that make up the ANOVA method, as discussed in this class?
The ANOVA table.
The Tukey table
An overall test to learn if the population means differ.
ANOVA Table
A series of pairwise tests to learn how the population means differ
Tukey Table
In a long view of the data values, what is the column containing the data values called?
The response variable.
In a long view of the data values, what is the column containing the population names called?
The factor variable.
In a long view of the data values, what does levels mean?
The number of populations in the factor variable.
In the method of ANOVA, what does the assumption of Normality mean?
The shape of each population, by itself, is normal.
In the method of ANOVA, what does the assumption of Equal Variance mean?
All populations have the same variance.
The data values are arranged in several columns, one column per population
Wide View
The data values are arranged in one column, all populations together
Long View
In the ANOVA table, what information does the Actual Variance give?
The spread of the sample averages.
In the ANOVA table, how are the two variances actually analyzed?
By dividing the two variances and seeing if the value is close to one (1).
What part of a dataset is the focus when converting a data set from a wide view to a long view of the data values?
The data values.
What part of a dataset is the focus when converting a data set from a long view to a wide view of the data values?
The population names.
When is a long view of the data values most useful?
When using a computer to statistically analyze the data values.
When is a wide view of the data values most useful?
When using hand calculations to statistically analyze the data values.
How is the value of the Theoretical Variance found?
By using the sampling distribution of the sample average
(s^2Pooled/n).
What is the statistical importance of Pooling the variances?
To combine three estimates of the population variance into one better estimate (it has more degrees of freedom).
The ANOVA fraction gives a test statistic that follows what distribution?
The F-distribution.
What does the F-distribution look like?
Uni-modal and skewed to the right.
How is the value of the Actual Variance found?
By calculating the variance of the three sample averages.
In the ANOVA table, what is the major meaning of the result shown below?
ActualVariance/TheoreticalVariance=4.56
The ANOVA fraction = 0.28 . The sample averages are far enough apart implying the population means are different.
For the ANOVA method, select all choices below that are assumptions of this method.
Individuals are chosen randomly from each population.
Each data value is independent of all other data values.
Each population has the normal shape.
All populations have the same variance
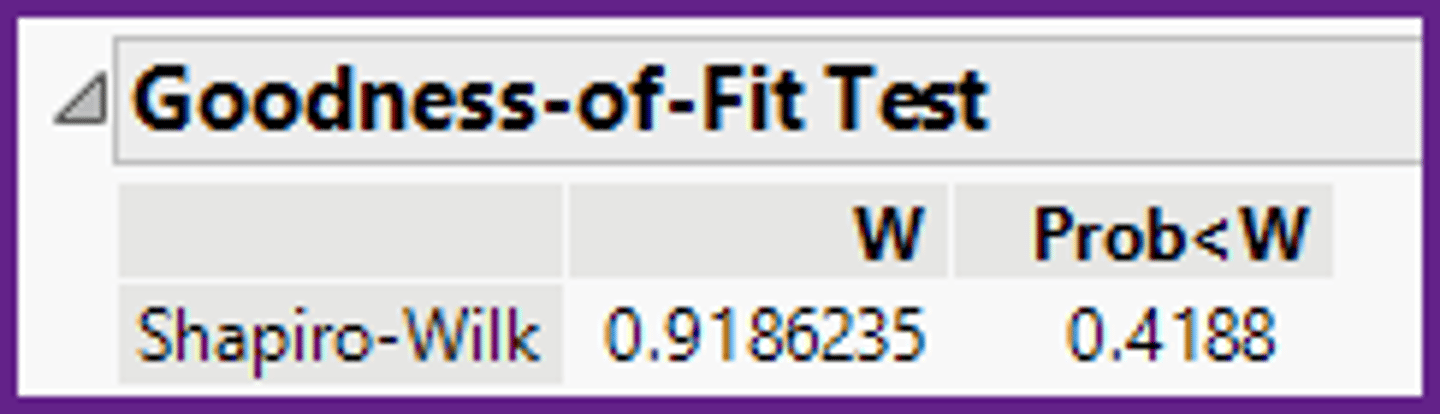
With a computer, which statistical method is used to find out if the shape of a population is normal?
The Shapiro-Wilk test, using the p-value approach.
Using the computer output below, should this population be considered to have the normal shape?
Yes, the shape is normal because the p-value (0.4188) is greater than alpha (0.05).
With a computer, which statistical method is used to find out if all the populations have the same variance?
The Levene's test, using the p-value approach.
Using the computer output below, is it appropriate to consider that all populations have the same variance?
Yes, the population variances should be considered equal because the p-value (0.2903) is greater than alpha (0.05).
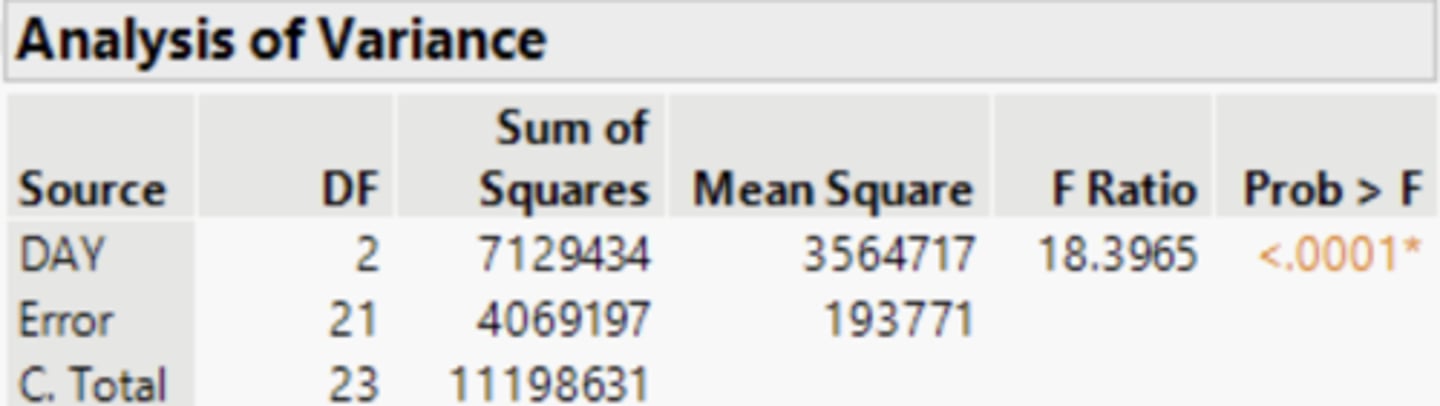
In the ANOVA table below, are all the degrees of freedom correct if there are three (3) populations and ten (10) data values from each population?
No, because the degrees of freedom should be, Error=27 and C. Total=29.
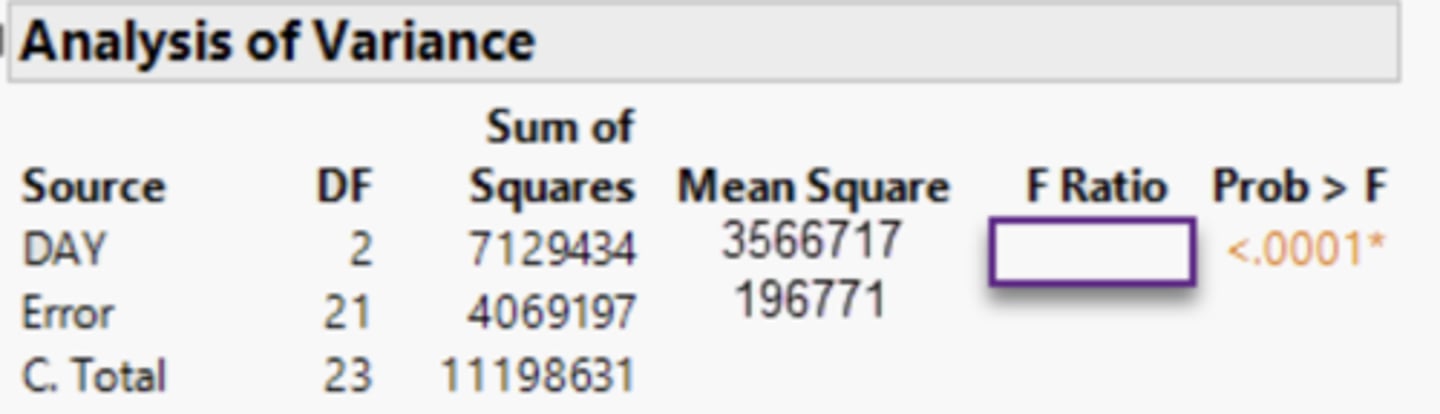
In the ANOVA table below, what is the value of the F-Ratio.
F-Ratio = 18.1262 .
In the ANOVA table below, should the populations means be considered equal?
No, the population means are not equal, because p-value (<0.0001) is less than alpha.
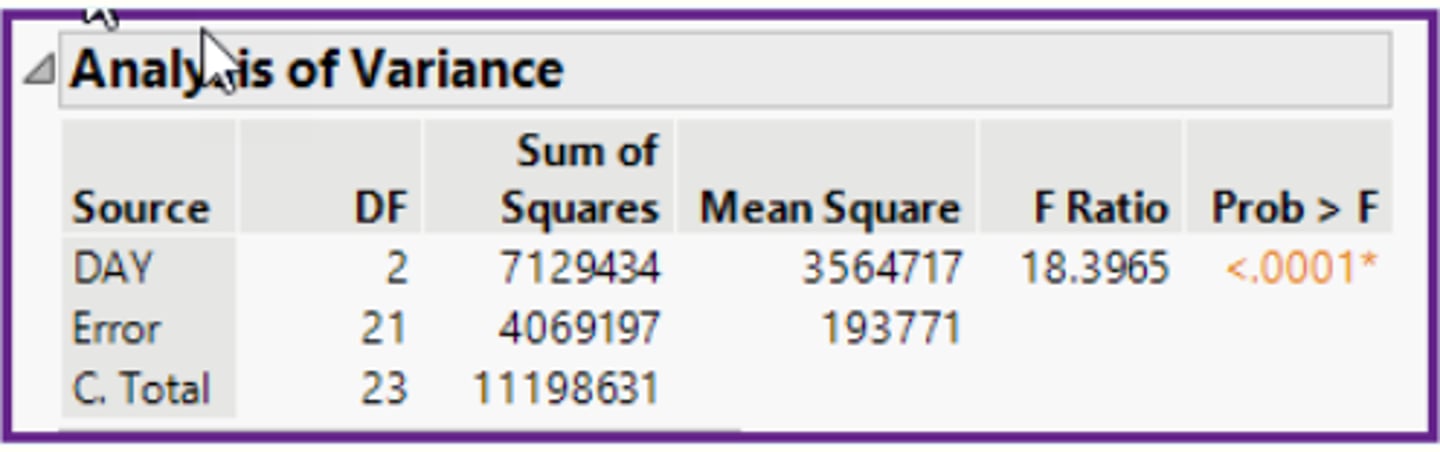
In the ANOVA table below, should the populations variances be considered equal?
Unknown, because the ANOVA table tests for means, not for variances.
Does the Tukey table provide new information when the null hypothesis is not rejected in the ANOVA table?
Not really, because one population mean means one letter in the Tukey table.
Does the Tukey table provide new information when the null hypothesis is rejected in the ANOVA table?
Yes, the Tukey table indicates which population means are equal, and which are not equal.
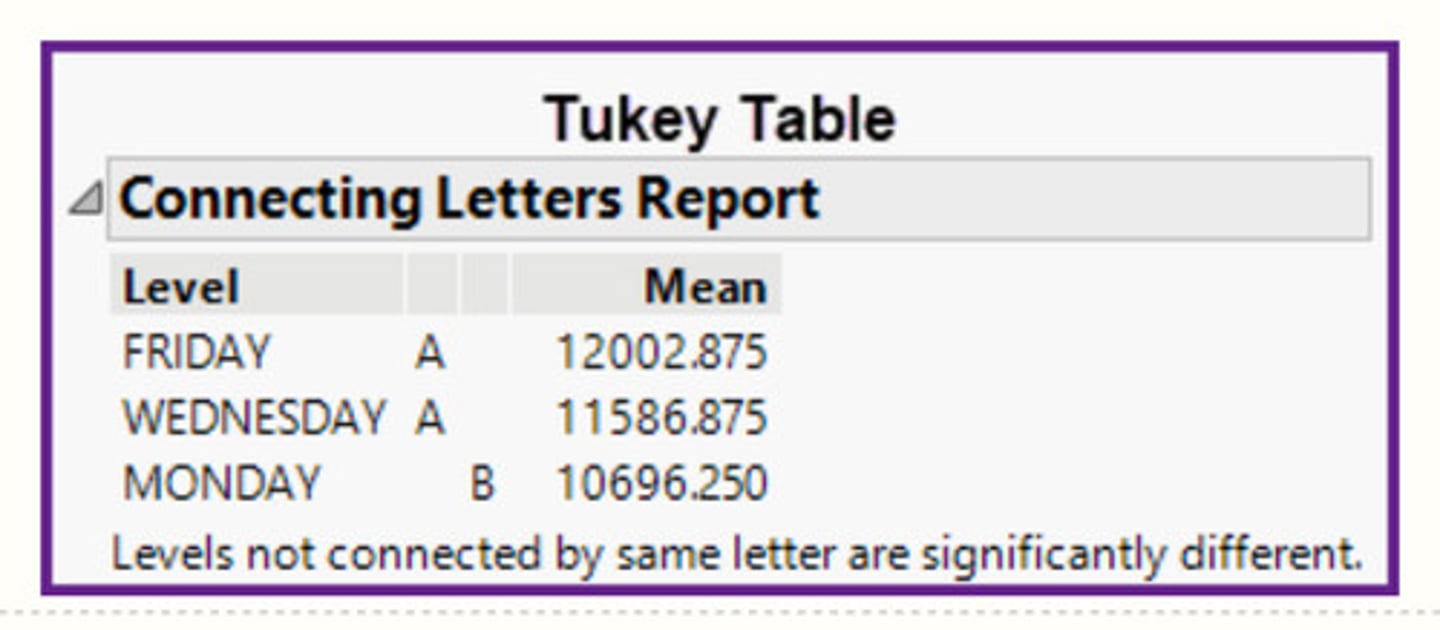
In the Tukey table shown below from a study of the number of births per weekday, what relationship between the values of the population means is NOT appropriate?
Friday's, Wednesday's, and Monday's population mean number of births are equal.

In the Tukey table shown below from a study of the number of births per weekday, what relationship between the values of the population means is appropriate?
Tuesday's, Thursday's, and Wednesday's population mean number of births are all equal.