Stats (RM7-RM13)
1/109
There's no tags or description
Looks like no tags are added yet.
Name | Mastery | Learn | Test | Matching | Spaced | Call with Kai |
|---|
No analytics yet
Send a link to your students to track their progress
110 Terms
Quantitative data
Numerical data that can be measured, counted and analysed statistically. Can show how much/ many or how often a behaviour occurs
When is quantitative data collected?
Collected using using structured methods such as experiments, closed questionnaires and structured observations
Give and explain a strength of quantitative data
Is objective and reliable - because numerical data is not open to interpretation, meaning different researchers analysing the same data will reach the same conclusions, increasing replicability and scientific credibility.
Give and explain a limitation of Quantitative data
Lacks depth and meaning as it doesn’t explain why behaviour occurs, over-simplifying complex human behaviour and therefore reducing validity.
Qualitative data
Non-numerical, descriptive data (e.g. words from interviews or observations), that focuses on meanings, experiences and explanations of behaviour.
How is Qualitative data collected?
Collected using unstructured or open-ended methods such as interviews, open questions in questionnaires, and case studies to gain an in depth understanding of thoughts and feelings.
Give and explain one advantage of qualitative data
Has high validity → provides rich, detailed insight into participants experiences giving more realistic understandings of behaviour
Give and explain one limitation of qualitative data
subjective and low reliability
→ data requires interpretation, meaning different researchers may draw different conclusions, reducing replicability and scientific credibility
Primary data
Data collected first-hand by the researcher for their own study.
When is primary data collected?
Collected directly through experiments, observations, interviews and questionnaires when existing data is unsuitable
Give and explain one strength of primary data
high validity because it is collected specifically to meet the aims of that specific study, giving the researcher control over certain variables and procedures.
Give and explain one limitation of primary data
Time consuming and expensive to collect, which may limit sample size and reduce generalisability
Secondary data
Data that has already been collected by another researcher for a different purpose.
Give and explain one strength of secondary data
Quick and inexpensive to access
→ allowing researcher to analyse larger data sets without practical or ethical issues
Give and explain one limitation of secondary data
May lack validity because the data was not collected for the researchers specific aims and may be outdated or biased
Give and explain one strength of meta-analysis
Increased validity + credibility by combining large amounts of data, increasing statistical power and reducing the influence of individual study biases
Give and explain one limitation of meta- analysis
May be affected by public bias because studies with significant results are more likely to be published and included distorting conclusions
Descriptive statistics
The use of graphs, tables and summary statistics to identify trends and analyse sets of data. Statistical techniques used to summarise and describe the main features of data (e.g. mean, median, range).
Inferential statistics
Statistical tests used to determine whether results are significant and whether findings can be generalised beyond the sample.
What are the measures of central tendency? - descriptive statistics
Mean, median and mode — ways to describe the ‘average’ of data.
What do inferential statistics tell us?
The probability that the results occurred by chance.
Mean (definition) and when is it used?
The average calculated by adding all scores and dividing by the number of scores.
Used when there are no outliers or else they will skew the results
Median (definition) and when is it used?
The middle value when scores are arranged in order.
Used when you cannot use the mean because there are outliers. Doesn’t skew data
Mode (definition) and when is it used?
The most frequently occurring score.
Used when dealing with frequency data/ nominal data and/ or where there is a clear modal value in the set
What are measures of dispersion and give examples? - descriptive statistics
Measures showing how spread out the data are — e.g., range and standard deviation.
Measure of dispersion give an indication of spread (range) and variation (standard deviation)
Range (definition)
The difference between the highest and lowest score.
Standard deviation (definition)
A measure of dispersion showing the average distance of scores from the mean.
Shows how clustered or close around the mean the scores are. It shows how much, on average the scores vary around the mean
What does a big Standard deviation value signify?
lots of variation in the scores in a set of scores, meaning they are quite spread out around the means and thus quite varied
What does a small Standard deviation value signify?
scores are closely packed around the mean thus less variation
One advantage of the mean
Uses all scores so is more representative.
One disadvantage of the mean
Easily distorted by extreme values (outliers).
One advantage of the median
Not affected by extreme values.
One disadvantage of the median
Does not use all scores.
One advantage of the mode
Easy to calculate and useful for nominal data.
One disadvantage of the mode
May not be representative and there may be more than one mode.
One advantage of the range
Quick and easy measure of spread.
One disadvantage of the range
Only uses two scores and is distorted by outliers.
One advantage of standard deviation
Uses all data values and is more precise than the range. - most accurate measure of variation
One disadvantage of standard deviation
More complex to calculate.
Content analysis (definition)
A method for analysing qualitative data by coding it into categories to produce quantitative data.
Name ways to present quantitative data
Graphs, tables, scattergrams, bar charts, histograms.
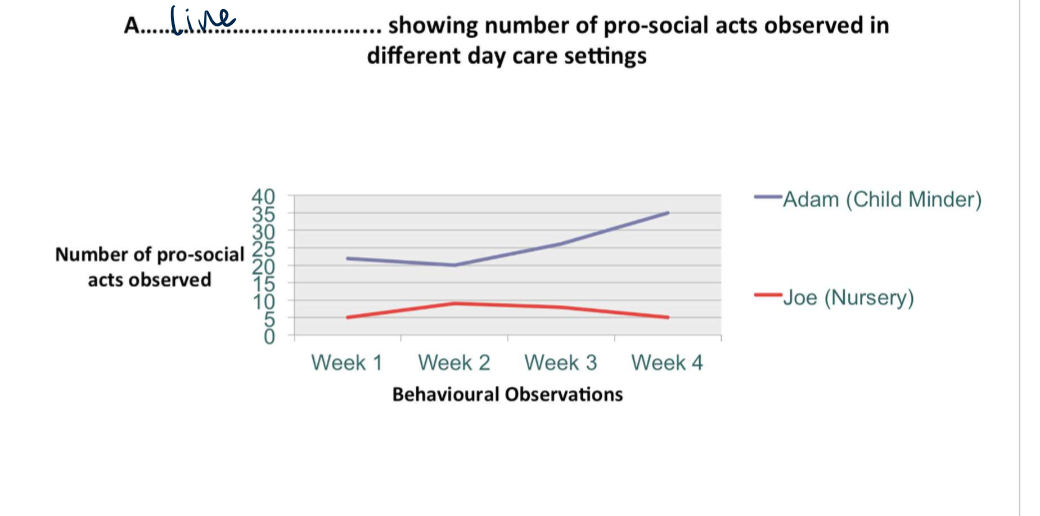
When are line graphs used/ advantages?
with data over time
when comparing 2 things
accurately represents change over time
allows comparison
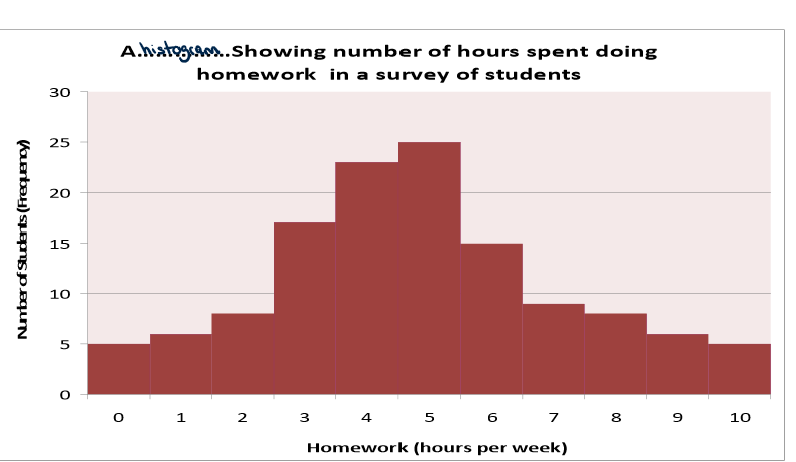
When are histograms used?
when continuous data (consecutive numbers) are being used - touching columns
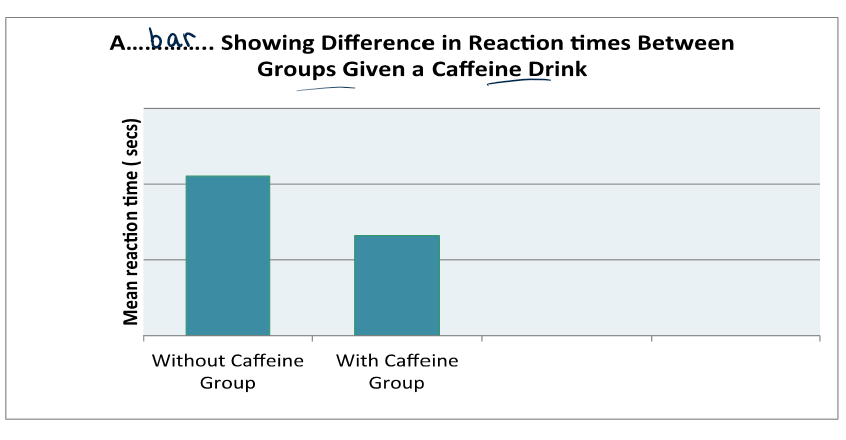
When are bar graphs used
used with discrete data (categorical data) - gaps between bars
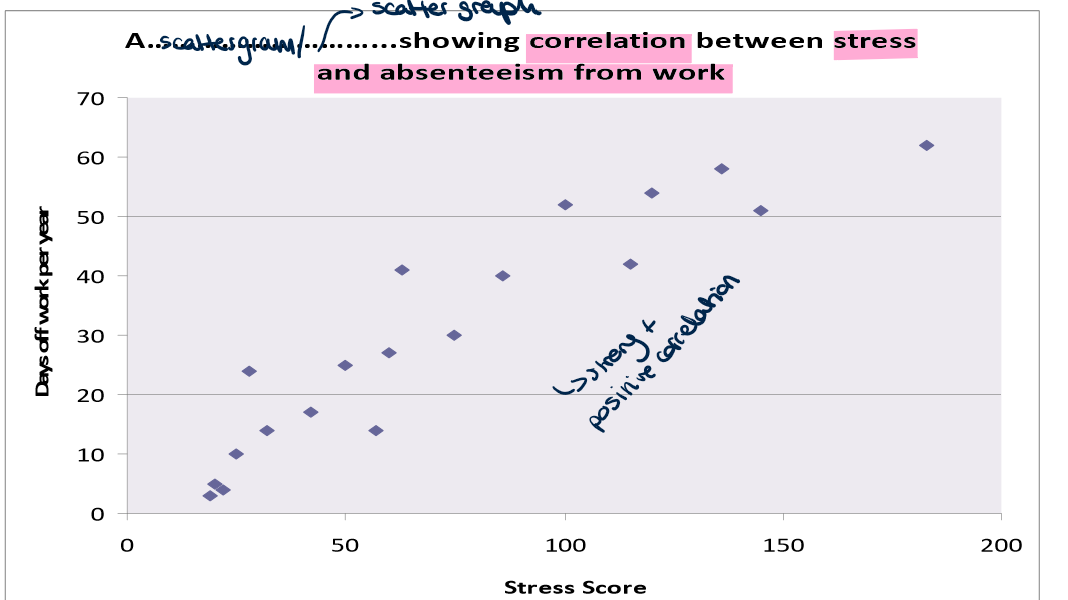
What is the purpose of a scattergram?
To show the relationship between two quantitative variables.
What are the types of distributions?
Normal distribution and skewed distributions (positive and negative).
What characterises a normal distribution?
symmetrical
bell-shaped curve where most scores cluster around the mean.
mean, median and mode all fall on the same central point
the two tails never touch the horizontal axis
What characterises a skewed distribution?
An asymmetrical shaped curve, with a lack on even spread of data, with a long tail extending to one end. These distributions can be visualised as a bell curve with a long tail on one side, indicating a concentration of score at one end of the distribution.
What does a positive skew indicate?
The mean is greater than the median and mode
What does a negative skew indicate?
The median is greater than the mean.
Why is qualitative data hard to analyse?
Because of the detail of information given & the fact that each participant’s answers may be different, it is hard to draw a fair/ objective summary just by someone reading over it
What is content analysis?
a form of indirect observation of communication between people where a psychologist studies the content of various media. e.g books, Tv, adverts ect
Generally how is a content analysis carried out?
By breaking down the material into categories (coding) and then counting up the number of times a category occurs (i.e turning qualitative data into quantitative data), so conclusions can be drawn easily
What are the 5 step of carrying out a content analysis? (must know)
Data is collected
Researcher reads through or examines data, making themselves familiar with it
The researcher then identifies the coding units
The data is analysed by applying coding units
A tally is made of the number of times each coding unit appears
(make sure to apply to context of the stem in tests)
Types of data that can be analysed through content analysis
visual analysis - tv
audio analysis - music/ songs
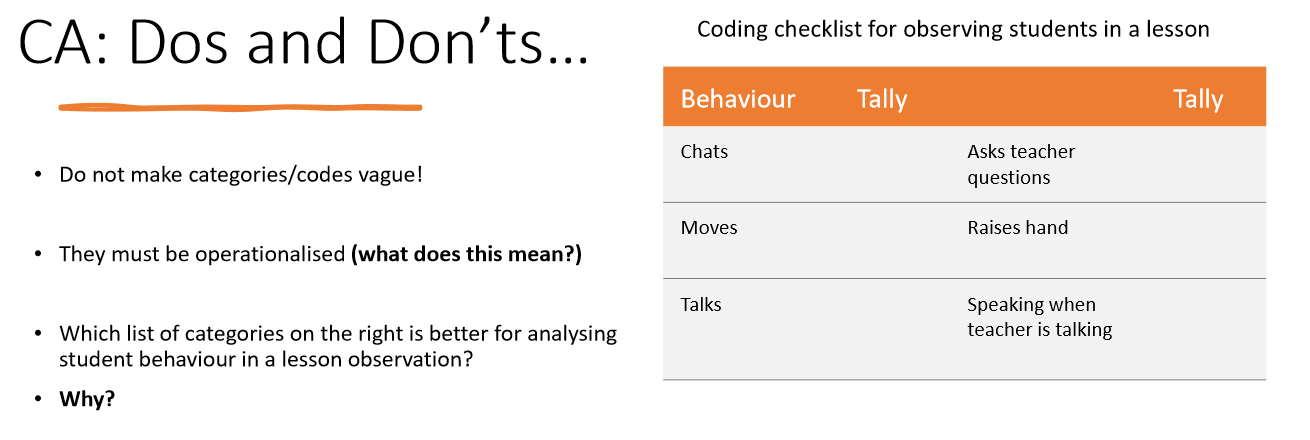
What are some dos and don’ts for making categories/ coding units?
do NOT make categories vague
categories must be operationalised
Coding (in content analysis)
Assigning numerical categories to qualitative data.
Experimental hypothesis - inferential statistics (from now on)
A statement predicting there will be a difference or relationship between variables.
Null hypothesis
A statement predicting there will be no difference or no relationship between variables.
Correlation hypothesis
A statement predicting a relationship between two co-variables.
Positive correlation
As one variable increases, the other increases.
Negative correlation
As one variable increases, the other decreases.
What does a correlation coefficient indicate?
The strength/direction of a relationship (ranges from −1.0 to +1.0).
What’s the difference between positive, negative and zero correlation?
Positive = as one increases, the other increases.
Negative = as one increases, the other decreases; Zero = no consistent relationship.
Zero correlation
No relationship between variables.
Probability in psychology
The likelihood that a result occurred by chance, expressed as a value between 0 and 1.
What is level of significance
The threshold at which results are considered statistically significant (usually p < 0.05).
What does p < 0.05 mean?
There is less than a 5% probability that the results occurred by chance.
Significance (definition)
When the probability of the results occurring by chance is sufficiently low (p ≤ 0.05).
What is a significant result?
A result where p ≤ 0.05, meaning the null hypothesis is rejected.
Critical value (definition)
The value a test statistic must reach to be significant at a chosen level of significance.
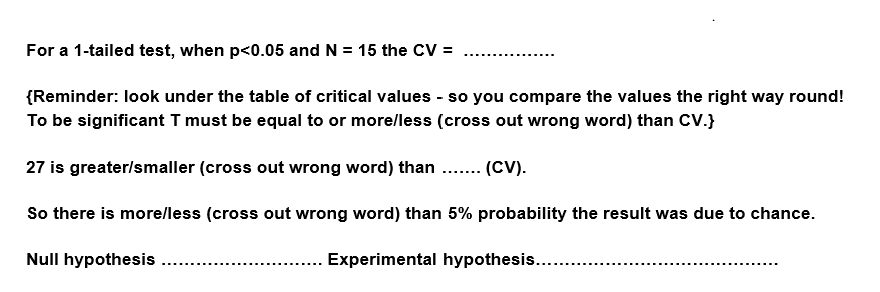
How do you carry out a sign test?
collect your data for example…
find the less frequent sign (S)
Then count up the number of participants (remove the participants who have no sign (neither positive or negative) - this is (p)
Use the level of probability you have been given (it will be p<0.5 unless told otherwise)
then decide whether it is a 1-tailed (directional) or 2-tailed (non directional) hypothesis
then compare the sign value to the critical value - using the sign table (which you will be given)
use the information at the bottom of the table to decide it is significant or not
if significant: accept experimental hypothesis and reject null hupothesis
if not significant: accept null hypothesis and reject experimental hypothesis
How do you format your conclusion to a test of significance?
Make sure to adjust if it is a 2-tailed hypothesis
What is a critical value?
Values that calculated value/ test statistic must reach in order for the null hypothesis to be rejected (for the test to be significant)
What are the three levels of measurement/ types of quantitative data?
Nominal, ordinal, and interval levels.
What is nominal level data?
Data divided into categories with no numerical value or order.
Give an example of nominal data.
Gender, eye colour, or preferred subject.
What are the characteristics of nominal data?
Categories, no ranking, no numerical distance between values.
What is ordinal level data?
Data that can be ranked or ordered, but the intervals between ranks are not equal.
OR data that is measured on a rating scale.
OR items on a test if the items are not equal difficulty/ the test is not standardised.
ANYTHING SUBJECTIVE
Give an example of ordinal data.
Finishing positions in a race (1st, 2nd, 3rd).
What are the characteristics of ordinal data?
Ranked order but unequal gaps between scores.
What is interval level data?
Numerical data where the intervals between values are equal and meaningful.
EXACT MEASUREMENTS OR OBJECTIVE MEASUREMENTS (e.g cm)
Give an example of interval data.
Test scores, reaction times, IQ scores.
What are the characteristics of interval data?
Equal intervals between scores and true numerical meaning.
Which level of measurement is the lowest?
Nominal.
Which level of measurement allows ranking?
Ordinal.
Which level of measurement is most detailed?
Interval
Which measures of central tendency can be used with nominal data?
Mode only.
Which measures of central tendency can be used with ordinal data?
Median and mode.
Which measures of central tendency can be used with interval data?
Mean, median and mode.
Which measures of dispersion can be used with nominal data?
None (range and standard deviation are not appropriate).
Which measure of dispersion is used with ordinal data?
Range.
Which measure of dispersion is used with interval data?
Standard deviation (and range).
Why is it important to know the level of measurement?
It determines which statistical test and measures of central tendency/dispersion can be used.
How does level of measurement affect statistical test choice?
Nominal data usually requires non-parametric tests; interval data allows parametric tests. Coding & Content/Thematic Analysis
What is coding in content analysis?
Assigning labels or categories to qualitative data to turn it into numerical form for analysis.
What is thematic analysis?
Identifying patterns or themes in qualitative data.
Type I error
Rejecting the null hypothesis when it should have actually been accepted (false positive).
Type II error
Accepting the null hypothesis when it is should have actually been rejected (false negative).
Choosing a statistical test depends on
The experiment design (repeated measures/ independent group/ matched pairs), level of measurement (ordinal/ nominal/ interval), and whether testing difference or correlation.