Economics IB
1/123
There's no tags or description
Looks like no tags are added yet.
Name | Mastery | Learn | Test | Matching | Spaced | Call with Kai |
|---|
No study sessions yet.
124 Terms
Opportunity Cost
the cost of the next best alternative when a choice is made
Production possibilities curve
a graphical representation of the maximum output possibilities for two goods given a set of inputs
market/free economy
economic decisions made by individuals and businesses
planned economy
gov makes all economic decisions
demand
quantity of a good or service that consumers are willing and able to purchase at a given price
supply
quantity of a good or service that producers are able and willing to produce at a given price over a particular time period
ceteris paribus
assumption that all else is equal
equilibrium
where quantity demanded and quantity supplied is equal
law of diminishing marginal returns
as more resources are allocated to a good’s production in the short run, productivity of additional resources decrease
consumer/producer surplus
benefit that consumers/producers recieve when they pay a price below what they are supposed to pay/price more than they are willing to sell for
elasticity
responsiveness of quantity of produce demanded/supplied when price changes
PED
% change in quantity demanded/% change in price
% change=(new value-old value) / old value
subsidies
amount of money paid by gov to firm per unit of output
direct taxes
tax paid directly by individual or oganiztion (income tax)
indirect taxes
tax imposed on good or service that consumers consume
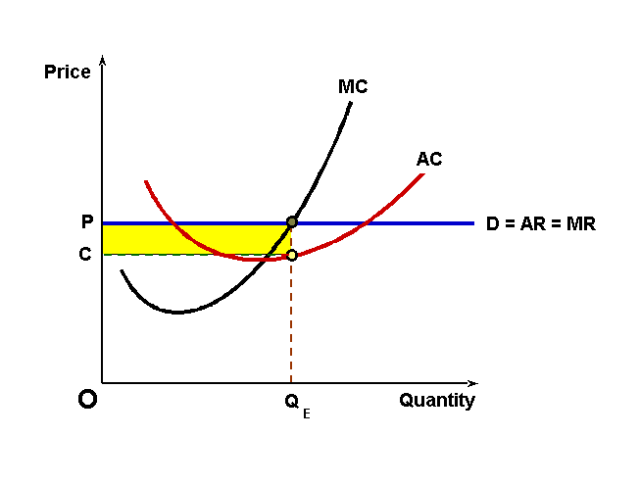
marginal cost and marginal revenue
Marginal Cost (MC) is the cost of producing one more unit of a good, while Marginal Revenue (MR) is the additional revenue gained from selling one more unit.
perfect competition
all firms sell identical products
in short run, abnormal profits can be made, long run = normal profit
VIEW note book for diagrams
abnormal profit
total revenue minus explicit and implicit costs
normal profit
total revenue minus explicit cost
Imperfect Competition
different products, short run = abnormal profits, long run = normal profits
look at diagram
Monopoly
single firm being sole supplier
hydro one
oligopolies
market dominated by a few large firms, high barriers to entry
collusion: can collaborate to limit competition
cartels: formal agreement between firms to increase profits
price leaders: dominant firm in the industry
airlines/banks
monopolistic competition
large # of small firms compete against each other (firm choices have little influence)
restaurants
market failure
situation where allocation of goods in a free market is not efficient
common pool resource
resource that benefits a group of people, but benefit is eliminated if each individual pursues their own interest (Forests)
tragedy of the commons
occurs when individuals act in their own self interest without consideration of long term impact of the resource
the free rider problem
occurs when individual’s benefit from resource without paying or contributing to their provision (libraries)
public goods
non excludable: no one can be excluded from using this good
non rivalrous: one person’s use of the good does not reduce it for others
seen as market failure because private market unlikely to provide them
equity
recognizes that each person has different circumstances and allocates the amount each person needs
equality
given same resources
merit/demerit goods
merit: products that creates spiller over benefits
demerit: goods have a harmful effect on society
negative externality of production/consumption
occurs when the production of a good causes negative effects to unrelated third parties (noise/dust pollution)
occurs when consumption of a good causes negative effects to unrelated third parties
DIAGRAM
positive externality of production/consumption
occurs when the production of a good causes positive effects to unrelated third parties (production of honey)
occurs when goods that are consumed benefits third parties (healthcare)
DIAGRAM
Leakages
any use of income that causes money to be taken out of income stream (Taxes + savings + imports)
DIAGRAM
Injections
expenditure that causes money to be put into income expenditure stream (Gov spending + investment spending + exports)
GDP (gross domestic product)
sum of final goods and services produced in a country over a period of time
GNP (gross national product)
GDP + property income from abroad
Economic Growth and economic development
increase in national income during a time period
economic development is concerned with reducing poverty, income, inequality, education
Recession
2 quarters of zero or negative growth
Nominal GDP vs Real GDP
Nominal: GDP at current market price with inflation
Real GDP: GDP with inflation factored out
National Income Measurement
C+I+G+(X-M)
Purchasing power parity (PPP)
calculates relative purchasing power of different currencies
shows the number of units it would take to buy a basket of goods in the US, and the same amount itd take to buy it in the relative country
consumer confidence
measures degree of optimism that consumers feel about the state of the economy
aggregate demand
total demand for all goods/services in an economy at any given average price level
AD = C + I + G + (X-M)
aggregate supply
total amount of goods/services that all industries in the economy produce at every given price level
determinants of investment
interest rates
business confidence
technology
business taxes
LRAS
perfectly elastic at full employment level of output as it represents what the economy could be producing if it wre operating at full capacity
Keynesian AS
phase 1: AS perfectly elastic as producers can raise level of output without higher average costs
phase 2: spare capacity is used up, as producers continue to increase output, resources must be bid on
phase 3: impossible to raise output any further
DIAGRAM
inflationary classical
economy is at a level of output greater than the full employment level of output
upward pressure on wages and input prices because resources are overutilized.
This causes cost-push inflation, shifting SRAS leftward until the economy returns to Yfe but at a higher price level
DIAGRAM
deflationary classical
economy is operating below the full employment level, leading to downward pressure on wages and input prices, which results in decreasing price levels
DIAGRAM
keynesian long run
equilibrium levels may occur at different levels as wages and prices are sticky and aggregate demand determines real output in the long run. This means the economy can settle at underemployment equilibrium without automatic self-correction
increase in real output wont change price level because of spare capacity
DIAGRAM
fiscal policy
set of government’s policies relating to expenditure and taxation rates
aims: stable inflation, low unemployment, long term growth
expansionary fiscal policy
gov spending and decreasing taxes to increase consumption (AD)
trade off between lower unemployment and higher inflation
DIAGRAM
deflationary fiscal policy
gov reduces it’s spending and increases taxes
pros and cons of fiscal policy
can be used to target specific sectors
cons: time lags, political pressure, unsustainable debt
gov debt
amount of all budget deficits over the years
in short term, spending drives economic growth, in long term, debt servicing costs need to be paid back
multiplier effect
MPC = amount respent as people’s income, example, if 40% leaves flow, 0.6 is MPC
mutiplier= 1/(1-mpc)
or
k= 1/(MPS+MPT+MPM)
to save, to tax, to import
monetary policy
set of official policies governing the supply of money and level of interest rates in an economy
often set by central banks
(base rate)
expansionary monetary policy
increases AD by lowering base rate of interest, increases supply of money which increases consumption
same as fiscal policy diagram
pros and cons of monetary policy
strengths: quickly put into place, bank is independent from gov, ability to make small changes
cons: time lags, cannot cut interest rates infinitely, lower consumer/business confidence
credit creation
commercial banks create money (can lend more money than they have as long as they fulfill the reserve requirement
govs controlling money supply
gov can increase or decrease reserve requirement, buying selling bonds in open market
changing minimum lending rate
supply side policy
designed to increase AS in long run by increasing quality and quantity of factors of production
market based supply side
focus on allowing markets to operate freely
- reduction in household income taxes, reduction in union power, reduction of min wage
intervention for supply side policies
investment in human capital, research and development
cons: significant cost
distribution of income and lorenz curve
graphical representation of a country’s income distribution
gini coefficient
A / (A+B)
A= area between line of equality and Lorenz Curve
B= area below Lorenz Curve
Gini Index
A measure of income inequality. It ranges from 0 (perfect equality) to 1 (perfect inequality).
Importance of wealth concentration
has to be incentives that inspire competition, if wealth is concentrated without mobility, no motivation to do so
absolute poverty
measured in terms of basic need for survival (income needed to stay alive)
relative poverty
comparative measure of poverty, said to be poor if they do not reach some specified level of income
multidimensional poverty index
identifies different aspects of poverty and assigning them each a weight
causes of poverty
inequality of opportunity, different levels of resource ownership and human capital, discrimination
consequences of poverty
less economic growth, less social stability, individual and family struggles
proportional vs regressive vs progressive tax
proportional: tax for which the percentage remains constant as income increases
regressive: tax decreases in percentage as income increases (larger burden on lower income families, ex: taxes on goods)
progressive: percentage paid in tax increases as income increases
calculating progressive tax rates
view note book: take income earned in that bracket and multiply by the rate
avg tax rate: amount paid in taxes/ income x 100
pros and cons for progressive tax system
pros: poor are better able to meet basic needs, marginal utility per dollar decreases with each dollar earned
cons: taxing higher income at higher rates creates a disincentive to work
policies that reduce inequality
investment in human capital, health policies, education policies
transfer payments
gov programmes that shift tax revenues and deliver them to individuals without an exchange of goods or services
pensions, unemployment insurance, business subsidies
universal basic income
periodic payment delivered to all citizens of a population
unemployed people
people who are registered as able/available and willing to work at the going wage rate but cannot find work despite active search for work
unemployment rate: # of unemployed/# in labour force
labour force
% of population of working age who are able and willing to work
full employment
level of employment where economy is working at full potential
underemployment
occurs when full time job seeker accepts a part time job
disguised underemployment
exists where part of labour force is left without work or working in a redundant manner where work productivity is essentially zero
examples. workers leave labour force: forced retirement
discouraged workers: stop looking
part time works who want full jobs
structural unemployment
structure of economy changes - less jobs because of fall in demand
demand for workers reduced from DL1 to DL2 maybe causes by new tech, decreased demand
min wage rises, increasing supply of labour but reduction of demand
DIAGRAM
frictional
workers entering work force on day data is collected
seasonal unemployment
cyclical unemployment
widespread, occurs during recession as aggregate demand is too low to achieve full unemployment
inflation
a general sustained increase in average price level of goods and services in an economy over time
deflation
a general sustained decreases in average price level of goods and services over time
disinflation
a decrease in rate of inflation from a higher to a lower level
consumer price index
measures change in income a consumer needs to maintain same standard of living over time
check notebook
demand pull inflation - increase in AD
supply struggles to satisfy demand, which causes demand pull inflation
DIAGRAM
cost push inflation - decrease SRAS
negative supply shock
DIAGRAM
costs of high inflation
economic uncertainty, redistributive effects, less export competitiveness
deflation
sustained decrease in the average price of a nation’s output overtime
deflation - decrease in AD
fall in consumption = negative demand shock, workers are laid off
deflation - increase in SRAS
output increases so cost decreases
costs of deflation
uncertainty, less consumption