Lec #8: Community Ecology
 Call Kai
 Learn
Learn Practice Test
 Spaced Repetition
 Match
Match Flashcards
 Knowt Play
1/32

There's no tags or description
Looks like no tags are added yet.
Name | Mastery | Learn | Test | Matching | Spaced | Call with Kai | Chat |
|---|
No analytics yet
Send a link to your students to track their progress
33 Terms
Community
Two or more populations living in the same geographic area
Community Characteristics
- Trophic structure
- Species Diversity
- Dominance
- Growth form and structure
How communities are put together
A combination of individualistic and interactive hypothesis (opposites); it is not straight; both are accurate and inaccurate
Individualistic hypothesis: (Gleason 1926)
Communities are chance assemblages of species with similar abiotic requirements
Those that live there handle the abiotic environment
Interactive hypothesis: (Clements 1936)
Communities are assemblages of dependent closely linked species (interconnected, symbiosis, binds community together)
Trophic Structure Ecosystem
Communities of organisms embedded in their physical / chemical environment (Movement of energy and materials; these are both inputs and outputs)
Open-system ecosystem: energy flows through, nutrients (re)cycle and flow though
Nutrient spiral: feedback loop and everything is lost over time
Ex:
Sun (primary energy input with geothermal and chemical energy) (gives off electromagnetic radiation)
Gives off light, H2O, CO2
Creates sugar
Creates O2 waste
Autotroph (primary organism that harvests energy; converts inorganic sunlight to organic biomass; self-feeder)
Plants, algae, anything that photosynthesizes
Heterotroph (other-feeder that eats pre-formed food)
Features of ecosystems:
1. Open biological systems
2. One way flow of energy
3. Cycling of nutrients
Trophic Levels
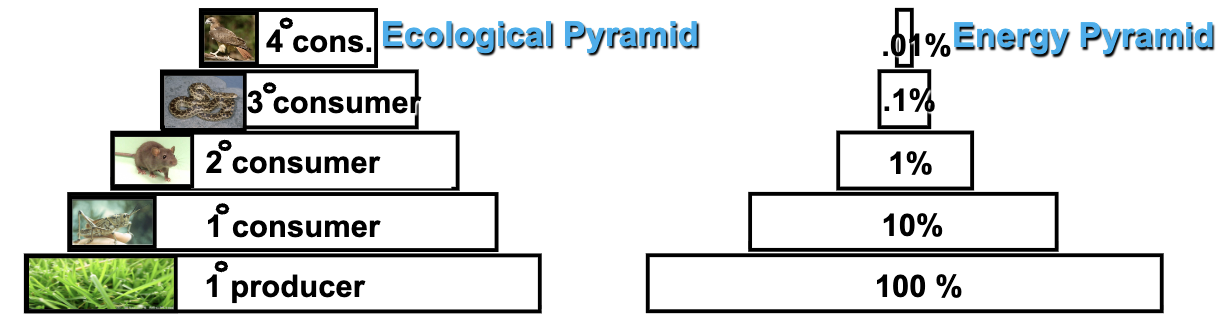
Defined by the # of steps through which energy passes to reach the organisms in it (how many organisms can it support?) (group species by functional similarity)
Usually 3-5 levels (not big because of limited resources)
1. Primary producers (autotrophs):
2. Primary consumers (eat primary producers)
- herbivores: eat living autotrophs
- decomposers: eat dead autotrophs by digesting externally; fungi
- detritivores: eat dead autotrophs by digesting internally; worms
3. Secondary consumers (eat primary consumers)
4. Tertiary consumers (eat secondary consumers)
5. Quaternary consumers (eat tertiary consumers)
Forms a hierarchy of feeding relationships
Food Chain
Linear sequence of feeding interactions
In nature, but rare
Food Web
Multi-linkage feeding interactions
More common
Opportunistic feeding
Energetic Hypothesis
Def: Length of food chain is limited by the inefficiency of energy transfer
Why there are few top predators
Biomass: measure of dry tissue (carbon) weight an organism contains
Energy: average of 10% of energy is transferred from one level to next
Lost to metabolic processes (build, repair, inefficiency, heat)
Ecological Efficiency
How much is transferred level to level and how efficient
Higher trophic transfer efficiency typically results in higher population turnover rate
More biomass you can get from food, more reproductive output, bigger bug, more eggs, bigger population size
Important for farmers
Ex: insects love monocultural crops (don’t need to seek for it) and devastate it, so farmers need to know how fast insects take material and transport it into its own biomass (impacts rate of reproduction in order to decide on what to do)
Higher than 10% means that for everything the organism eats, theres more E available to turn into biomass (fast turnover rate and the population size doubles faster)

Top - Down effects
The abundance of lower trophic levels depends on the effects of consumers from higher trophic levels
Bottom - Up Effects
The abundance of higher trophic levels depends on factors such nutrients & prey availability from lower trophic levels
Trophic levels in nature
Terrestrial systems: 3 trophic levels
Aquatic systems: 4 (nutrients high) or 3 trophic levels (nutrients low)
Cascade top-down makes terrestrial systems more green (many primary producers)
Cascade top-down makes aquatic systems more blue (few primary producers; consumed by the 1st consumer)
Odd number of trophic levels: the bottom is a resource-based community; resource limitation
Even number of trophic levels: the bottom is a consumer-based community; consumer limitation
Invasive specific increases or decreases the number of trophic levels, so the resource of consumer limitations are converted between the two and causes mass extinction
Trophic levels shrinks or expands based on immigration, emigration, and/or introduction of diff species
Species Diversity
Species richness (number of species in a community) + Species evenness (relative abundance of species in a community)
Shannon - Weaver (Wiener) Diversity Index
The most commonly used index of species diversity (H)
For any given species richness, diversity (H) increases with species evenness
For any given species evenness, species diversity (H) increases with species richness
A communication model
Higher value, more diverse

Disturbance
An event that removes organisms and alters resource availability
- Small scale (tree fall, stone flip, etc.)
- Large scale (volcano, hurricane, etc.)
Communities with very high or low disturbance have lower species diversity than communities with moderate disturbance
Intermediate disturbance hypothesis: Joe Connell
1. When disturbance is severe and frequent community is composed of good colonizers (r-selected) with high reproductive rates; per-capita population growth rate
The environment changes fast, so the weeds have adapted
2. When disturbance is mild and rare (stable) community is composed of good competitors (K-selected); carrying capacity
Has intraspecific competition
Fewer reproduction rates (grow slow) because energy is used up (less biomass)
Competitive exclusion with space for the tree
Need to reduce the number of K in order to have coexistence (competition is reduced)
Species Diversity is highest where disturbance is moderate (intermediate) in severity and frequency
Allows both colonizers (r) and competitors to coexist (K)
Example for Intermediate disturbance hypothesis: Ellwood boulder fields - Sousa (1979)
Observation: Boulders of intermediate size had more species of algae & barnacles than small or large boulders
Small boulders flip all the time (heavily disturbed)
Intermediate boulders flip at a moderate rate
Big boulders flip too little
Treatment: Glued small boulders in place (reduced disturbance; modify disturbance regime)
Small boulder glued to intermediate boulder makes a moderate disturbance regime
Small boulder glued to big boulder makes a low disturbance regime
Results:
Glued, small boulders had higher species richness than small loose boulders
2. On largest boulders, 1 Algae (Gigartina) (the competitive species) takes over space and eliminates the r species (diversity stays low)
Conclusion: Species diversity was higher when disturbance was moderate (intermediate)
A model match with high utility
Ecological Succession
Def: Transition in species composition over time in a community
- Primary succession (bare soil, no organisms)
Fresh, sterilized substrate; ground 0
Volcanoes, deep sea riffs, asteroid strike, nuclear bomb
- Secondary succession (soil, some organisms)
Survivors after disturbance
Successional pathway
r —> K
1. Early successional communities (r - selection)
- Good dispersers (colonizers) and high reproductive rates
- First in the new disturbed environment
2. Late successional communities (K - selection)
- Good competitors, exist near carrying capacity
- Will eventually take over; takes longer to get there and build up numbers (poor reproducers)
Successional Patterns
1. Directional succession: progressive change in species composition
A to B (stop at a end point)
Grass to sage (never burns)
2. Cyclical succession: change in species composition in which the original community is ultimately restored
A to B to C to A to…
Grass to sage to fire to open habitat to grass to…
Invasive species
Def: Species that disrupt communities by a dominant colonization of a particular habitat or from loss of natural controls (i.e.: predators or herbivores)
• $26 billion/year cost (over 1.2 trillion dollars in cost since 1960)
• Impacts agricultural productivity, public utility operation, native fisheries, tourism, outdoor recreation, and control efforts
• 50,000 non-indigenous species in US, and 80% of endangered species are threatened by invasion (we moved them in; transplant)
Impacts: Change in ecosystem structure and function
- Altered community composition
- Altered disturbance regimes
Invasive species examples
Zebra mussel: from holes of boats, out compete natives, good filter-feeders and sponge (hurt pipes and water sources), grow fast
Kudzu: a leaf encasing a forest (the support structure); blocks light and kills the forest and all organisms that are dependent on it
Burmese python: from Burma to Florida, it was a pet that people threw out; hunts and adapts
Nutria: beaver-like animal that strips the river bank of vegetation; little resistance to flood because there is no stability; more destruction
Process of Invasion (Levine et al. 2004)
Introduction (of invasive species): not native
Establishment: survives and reproduces; successful transplant
Spread (area and volume)
Impact: extinction, elimination, reduction; change rules of the assembly; after disturbance regimes
Increase or change abiotic factors
Niche relationships
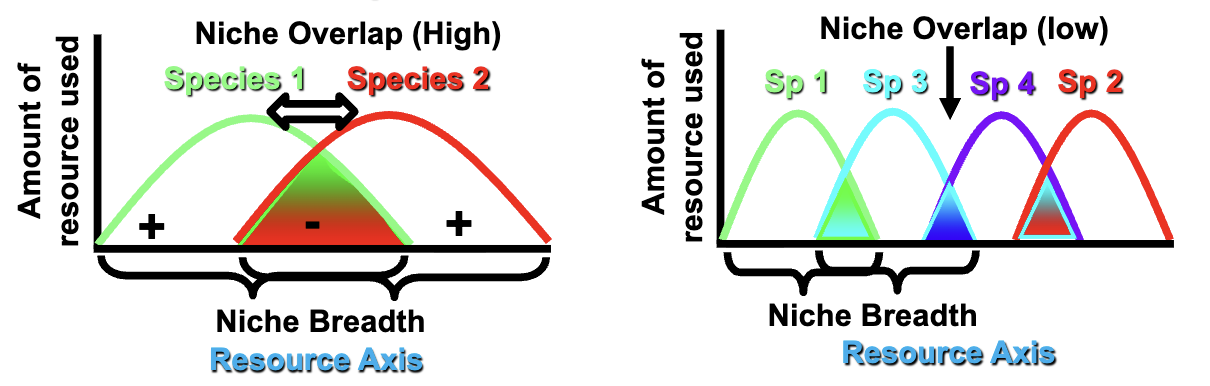
Niche: ecological space; all ways to occupy resources in an environment
Species 1 (ex: ones that eat small seeds) +
Intraspecific competition and more reproductive success on the ends
Species 2 (ex: ones that eat big seeds) +
Intraspecific competition and more reproductive success on the ends
Intermediate:
Interspecific competition (worse)
The wider the average niche breadth the fewer the number of species in the community that can fit with that niche (due to extreme competition) (extinction via competitive exclusion)
Seen in the short-term
Almost complete overlap; complete competitor and competition exclusion
The narrower the average niche breadth the more species in the community (coexistence via resource partitioning)
Coexist with resource partitioning
More intraspecific over interspecific
Less overlap
If time is stable and long enough curves will eventually spread out to reduce interspecific competition
The middle (niche) opens up and a species can drop in and specialize on the intermediate seeds (creates overlap again; more interspecific competition)
Specialized characteristics (ex: beaks), more success, more offspring
Stable environment: coral reef and tropical rainforest
Repeats
Character Displacement
Divergence in morphological, physiological, or behavioral characteristics to reduce competition
If the spread is too wide
Darwin’s Finches Example for Character Displacement
- Eat seeds or insects but specialization on different food sizes reduces interspecific competition (resource partitioning)
- Results in divergence of beak length (character displacement), leads to coexistence; more species can pack in
- Diversification
Short time scales (ecological): interspecific competition will decrease diversity
Long time scales (evolutionary): interspecific competition increases diversity
Dominance and the 3 Kinds
Certain species have large impacts on communities because of abundance or role in community dynamics
Foundation species, Ecosystem engineer, Keystone species
Foundation species
Strong effects on community through their large size or abundance (Kelp)
Ecosystem stability
Kelp is already suffering because it is a cold-water species, and it is too hot now
Large size and abundance, forming a base for entire diverse community (underwater forest)
A niche space for a myad of different organisms
Ecosystem engineer
Strong effects on community by modifying the abiotic environment (Beavers)
Colonize a stream immediately and build a dam for a home and offspring
The river turns into a lake/pond
Keystone species
Species influence on the community (ecological role) is greater than expected relative to its abundance (Sea otter)
By eating sea urchins, the kelp is benefited. More diversity, more fisheries (except urchin fisheries)
Sea urchin fisheries don’t want competition, so they poach sea otters (also hunted for fur; its low reproduction rates will also cause slow recovery)
Predation may increase richness by allowing competitively inferior species to coexist with superior competitors