AP Human Geography - Population Test Questions
1/67
Earn XP
Name | Mastery | Learn | Test | Matching | Spaced | Call with Kai | Chat |
|---|
No analytics yet
Send a link to your students to track their progress
68 Terms
Which of the following describes a concern for a country with an aging population?
As the proportion of older people in the country increases, fewer young workers are available to contribute tax revenues to support programs that provide services to the older population.
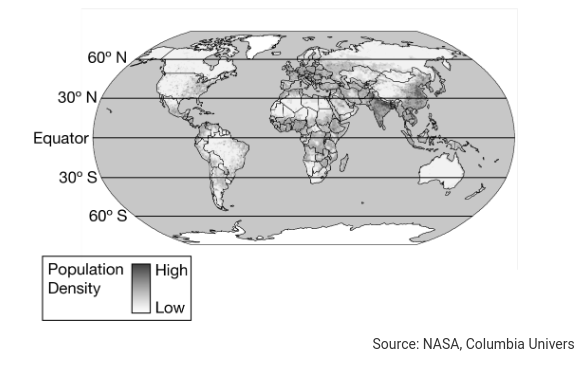
The map shows the number of people per unit of land. Which of the following types of data are shown in the map?
Arithmetic density
The measure of the average number of children who are born to women of childbearing age in the population is called the
total fertility rate
A country at the end of the demographic transition usually has which of the following?
Low birth and death rates
A country in the first stage of the demographic transition demonstrates which of the following?
High birth rates, high death rates, and low rates of population growth
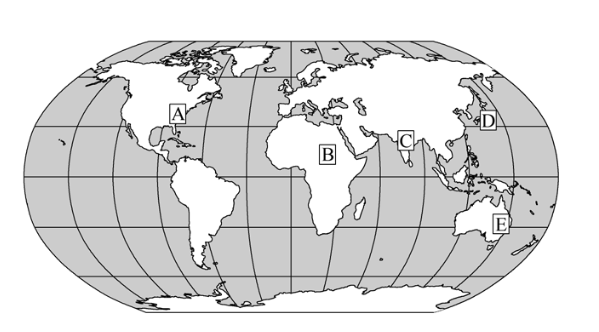
On the map above, which one of the following boxes is in an area where the population density is high and the level of economic development is low?
C
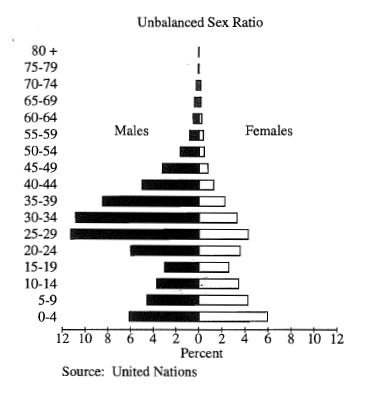
The sex ratio represented in the age-sex graph above for Country X is most likely the result of
a large guest-worker population
Assuming a world population of 5,700,000,000 and an annual growth rate of 1.6 percent, how many people will be added to the world's population in the next year?
91,200,000
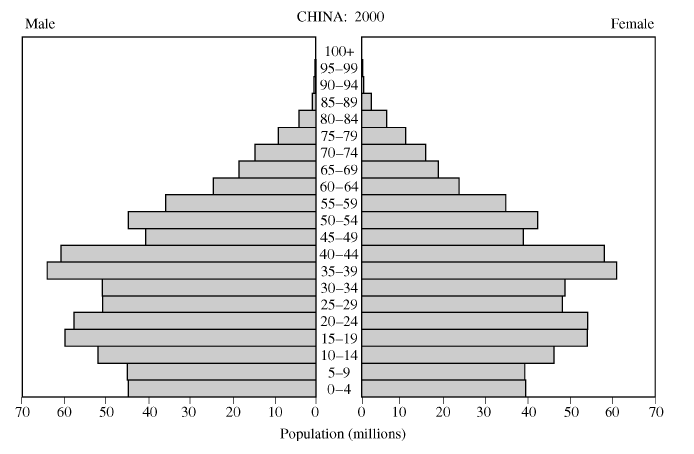
Based on the population pyramid above, which of the following will pose the greatest demographic challenge to China beginning in 2029?
Providing for the needs of its aging population

Based on the data shown, which of the following describes the most likely population context for the countries listed?
Stage five of the demographic transition model due to very low birth rates
Which of the following characteristics is currently shared by Switzerland, Canada, and New Zealand?
Low population-growth rates
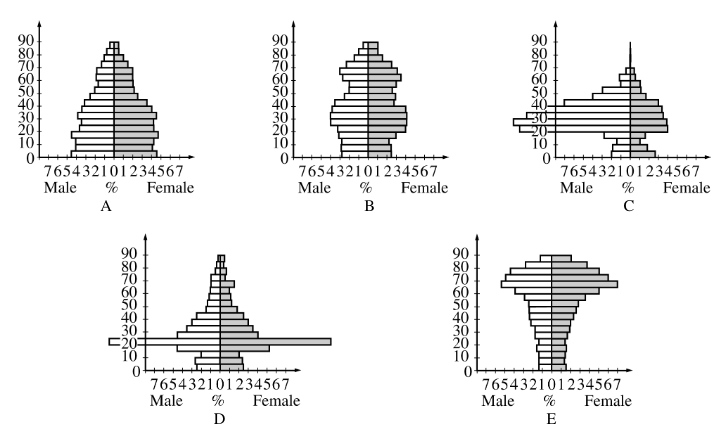
Which population pyramid shown above best represents a college town?
D

Which population pyramid shown above best represents a town with a military base?
C
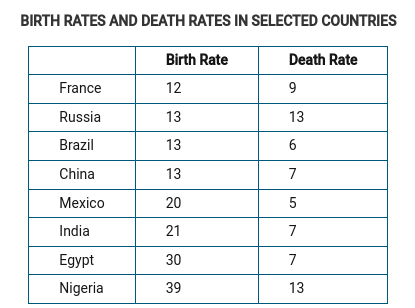
Based on the data provided, which of the following best describes how changing roles for women influence patterns of social values?
Higher birth rates in African countries suggest that women in African countries have less access to education and employment than European women.
Which of the following explains an unintended consequence of China’s antinatalist one-child policy?
A projected shortage of working-age people to care for the rising elderly population, resulting in an increase in the cost of living for older people.
Country A is a more developed country with a low birth rate, a low total fertility rate, a high life expectancy, and a high percentage of urban population. Based on this information, which of the following outcomes is most likely to occur in Country A?
Pressures on pension and social security programs are at critical levels as the number of elderly increases.
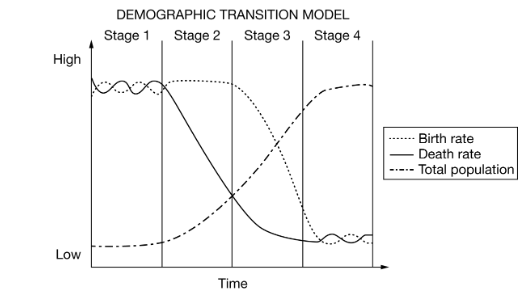
Which of the following is a correct statement about the demographic transition model?
It is characterized by relatively low growth rates at stage 1 and stage 4.
Which of the following countries is best described as being at Stage 3 of the demographic transition model?
Bolivia: birth rate = 24 , death rate = 7
Which of the following country demographics would be used to explain the need for the pronatalist policies shown?
A country with a birth rate of 11, a death rate of 13, and a rate of natural increase of −0.2 , legislates tax credits for working parents
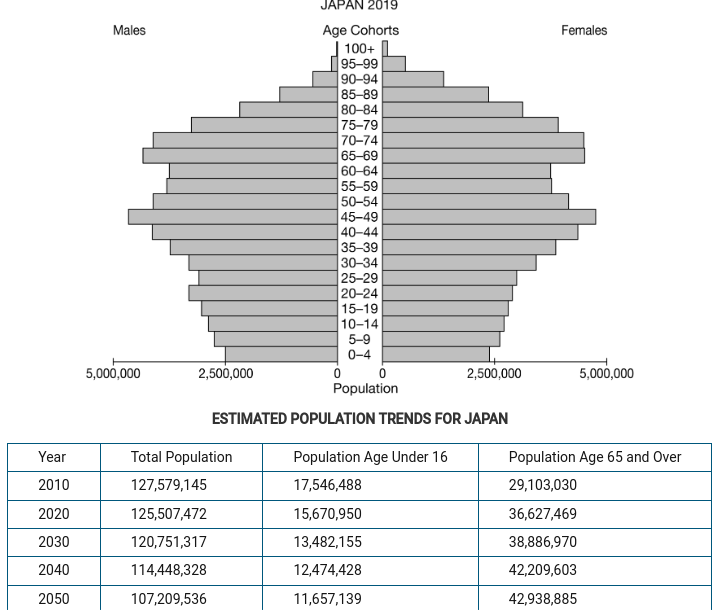
Which of the following best explains a possible limitation of the trends assumed from the population pyramid and estimates in the data table?
Labor shortages may cause the government to reduce the legal barriers to immigration, and immigrant populations could increase the working-age cohorts.

What changes could local governments, businesses, and corporations make to reverse Japan’s national birth patterns?
Adding low-cost or zero-cost infant day care and preschool centers to allow mothers to return to the workforce

What is the likely impact of the numerical change by 2050 of the total population on the eventual shape of Japan’s population pyramid?
Because of low birth rates over many years, the 2050 population pyramid will likely be an inverted pyramid.
Even though total fertility rates have been declining in some less-developed countries, the total population has continued to grow. This is primarily because a high percentage of the population is
under the age of 15
In the nineteenth and early twentieth century, the demographic transition in Europe was best characterized by
urbanization and falling birth rates

Which of the following describes a characteristic of a country moving from stage 2 to stage 3 of the demographic transition model?
Declining death rate

Which of the following describes the most likely cause of death for a citizen of a country in stages 4 and 5 of the demographic transition model?
Degenerative diseases due to old age and lifestyle
Which statement best describes population growth patterns in the world today?
In the world as a whole, fertility rates have fallen in the last 25 years.

The low birth and death rates for a country in stage 4 of the demographic transition model are best explained by
the level of urbanization and technological advancement of a more developed country

Which of the following best explains a likely effect of Brazil’s population distribution?
Uneven economic development as eastern Brazil experiences more growth than the sparsely inhabited western regions
Since the 1970s changes in the social roles, lifestyles, and employment patterns of women in Europe, Canada, and the United States have affected the overall population through which of the following?
Decreased total fertility rates
Which of the following statements best describes how the epidemiologic transition affects the demographic transition?
Improvements in nutrition, sanitation, and health care cause death rates to fall in stage 2 of the demographic transition.

In the model shown, the lines for birth rate, death rate, and total population are indicators of a country’s
level of social and economic development over time

The demographic transition is a general model that seeks to explain
how differences in birth and death rates result in natural population change
Which of the following best explains why, in the late eighteenth and early nineteenth centuries, Thomas Malthus proposed his population theory?
Malthus theorized that, if left unchecked by regular cycles of famine and misery, population would increase beyond the ability to feed itself.
In the first decade of the twenty-first century, which of the following countries had the lowest fertility rate?
South Africa
In which of the following pairs do both countries exhibit zero or negative population growth rates?
Japan and Germany
Which of the following would be most likely to increase life expectancy in a less developed country, resulting in an aging population in that country?
Improvements in access to health care and sanitation
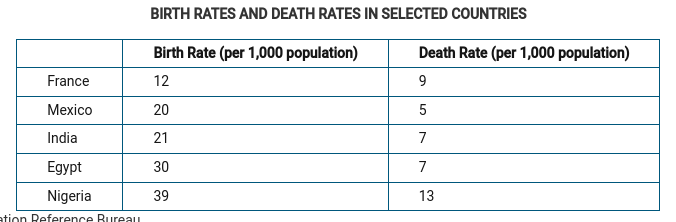
The data in the table can be used to describe a high level of female empowerment for which of the following countries?
France
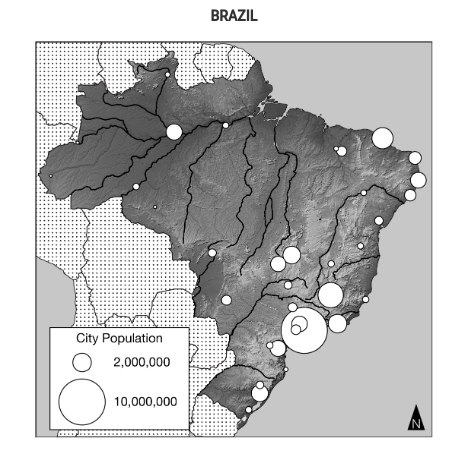
Which of the following describes information a geographer could identify from the map of urban populations in Brazil?
Patterns of arithmetic density within specific regions
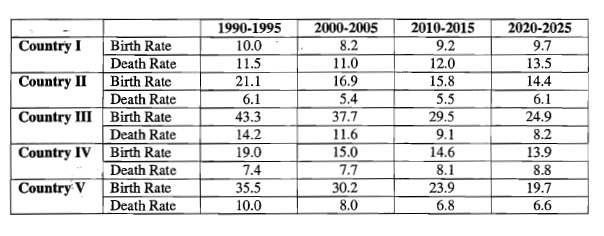
It can be inferred from global patterns of population growth that the country most likely to be in West Africa is
Country III
Which factor is most responsible for the increase in Japan’s dependency ratio?
An increase in life expectancy
Which of the following is most characteristic of societies currently in the last stage of demographic transition?
Aging population
In the early part of the Industrial Revolution in Europe, Thomas Malthus developed a theory that population increases exponentially, while food production can increase only arithmetically. Which of the following statements best explains how the Industrial Revolution reduced the threats forecast by Malthus?
The resulting rural-to-urban migration for jobs in factories led to a decline in birth rates and lowered population growth rates below what Malthus predicted.
In 1798 Thomas Malthus argued that populations grew exponentially while food supplies grew arithmetically. Consequently, Malthus argued that food shortages would develop until famine and other checks slowed population growth. What statement correctly explains why Malthus’ prediction did not come true in 1800s Europe?
Urbanization resulted in smaller household sizes, and the mechanization of agriculture increased food production.

Which of the following explains the pattern of growth in City B relative to City A ?
City B is located in a less developed country and has high rates of rural-to-urban migration, whereas City A is located in a more developed country and has low rates of rural-to-urban migration.
Which of the following profiles characterizes the population group that is the most likely to migrate?
Single, twenty-five years old
Which of the following characteristics applies to more-developed countries?
Long life expectancies
In which of the following contexts could a neo-Malthusian perspective most successfully explain population characteristics?
A country with a high rate of natural population increase, where food supplies are at risk
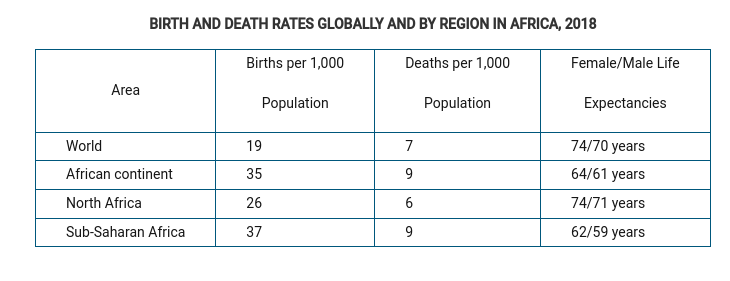
Which of the following best explains the significant difference in North Africa’s demographic data from the rest of the African continent and North Africa’s closer similarity to global demographic data?
North African improvements in nutrition, health care, and sanitation have reduced birth and death rates as well as improved life expectancies over time.
One would expect to find a population with a relatively young age structure in
less developed countries
Which of the following explains why a country with a high physiological density (e.g., Japan, Egypt, or the Netherlands) risks exceeding its carrying capacity?
The population places a large amount of pressure on the arable land to produce enough food without risking severe environmental degradation.
Physiological population density differs from crude population density in that physiological density
explains density in terms of people per arable square land unit, while crude density explains density in terms of people per total square land unit
Sri Lanka and Australia have about the same population. What data would help you determine which country has a higher physiological population density?
The amount of arable land in each country
Physiological population density is viewed as a superior measure of population density for which of the following reasons?
It is more reflective of population pressure on arable land.
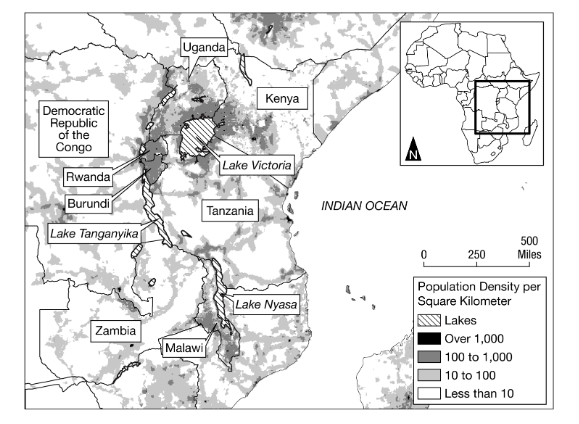
Which of the following best identifies the data for the Eastern Great Rift Valley, shown on the map?
High arithmetic density
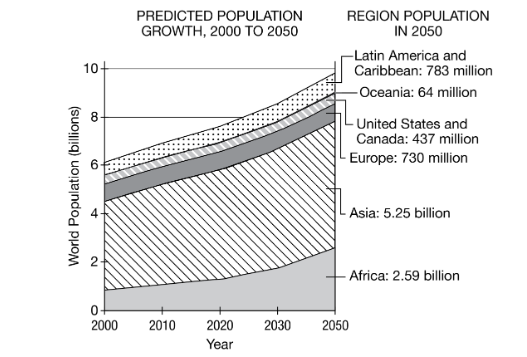
Based on the graph, predicted population growth in which of the following regions is explained by a high total fertility rate?
Africa
Which of the following is a distinctive aspect of population policy emphasized for the first time by the international community in the 1990's?
Women's empowerment
The term that describes the concept that population will continue to grow even after fertility rates decline is known as
demographic momentum
Which of the following best describes a country with a rate of natural increase of 0.4 ?
Slow population growth
Country X has a high youth-dependency ratio. Country Z has fears of running out of agricultural resources. Which of the following explains why Countries X and Z would implement anti-natalist policies?
Antinatalist policies promote family planning and education of women to reduce fertility rates.
The ability of a resource base to sustain a population is known as its
carrying capacity
In many less developed countries, only a small percentage of school-aged youth attend school regularly. In some cases, fewer females than males are enrolled in schools. Which of the following patterns is a concern in less developed countries with low school enrollment?
A lack of qualified males and females to develop a workforce that will improve economic growth
Which of the following regions had the smallest percentage of people living in urban areas at the end of the twentieth century?
South Asia
The dependency ratio is most useful for indicating the
relationship between the potential labor force and the remainder of a country’s population
The Malthusian view of the world argues that
famine in developing countries can be explained by examining their patterns of population growth
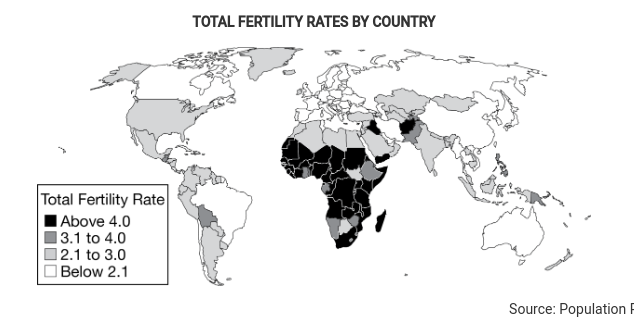
Which of the following describes the spatial pattern shown in the map of total fertility rates?
The lowest total fertility rates are shown in Europe, Russia, East Asia, Australia, and Canada.
The increasing percentage of urban dwellers in more-developed countries is best explained by
greater access to job opportunities, resources, and facilities
Which of the following types of countries are most likely challenged with the problems associated with a large youth-dependent population, such as providing public primary education for all children?
Less developed countries