AP Pre-Calculus Trigonometric Functions and Polar Coordinates Unit 3
1/24
There's no tags or description
Looks like no tags are added yet.
Name | Mastery | Learn | Test | Matching | Spaced | Call with Kai |
|---|
No analytics yet
Send a link to your students to track their progress
25 Terms
Periodic
Y-values repeat over equal-length intervals.
Period
Shortest interval for function to repeat.
Radian
Angle measure based on arc length.
sin, cos, tan
Basic trigonometric functions for angles.
Unit Circle
Circle with radius 1 centered at origin.
Coordinates on Circle
(x, y) represent points on a circle.
Trigonometric Graphs
Visual representations of sin, cos, tan functions.
Graph of y = sin(θ)
Starts at midline, oscillates between -1 and 1.
Graph of y = cos(θ)
Starts at maximum, oscillates between -1 and 1.
Amplitude
Distance from midline to extrema in graphs.
Phase Shift
Horizontal displacement of trigonometric function graph.
Midline
Average of maximum and minimum values.
Period of Tangent
π radians; asymptotes at x = kπ.
Frequency
Cycles completed per second; reciprocal of period.
Inverse Trigonometric Functions
Functions that reverse sine, cosine, tangent operations.
Solving Trig Equations
Set equal to zero and solve for angles.
Reciprocal Functions
Functions like csc, sec, cot related to sin, cos, tan.
Sum/Difference Formulas
Formulas for sin(a ± b) and cos(a ± b).
Polar Coordinates
Coordinates defined by radius and angle.
Rectangular to Polar
Convert (x, y) to (r, θ) using formulas.
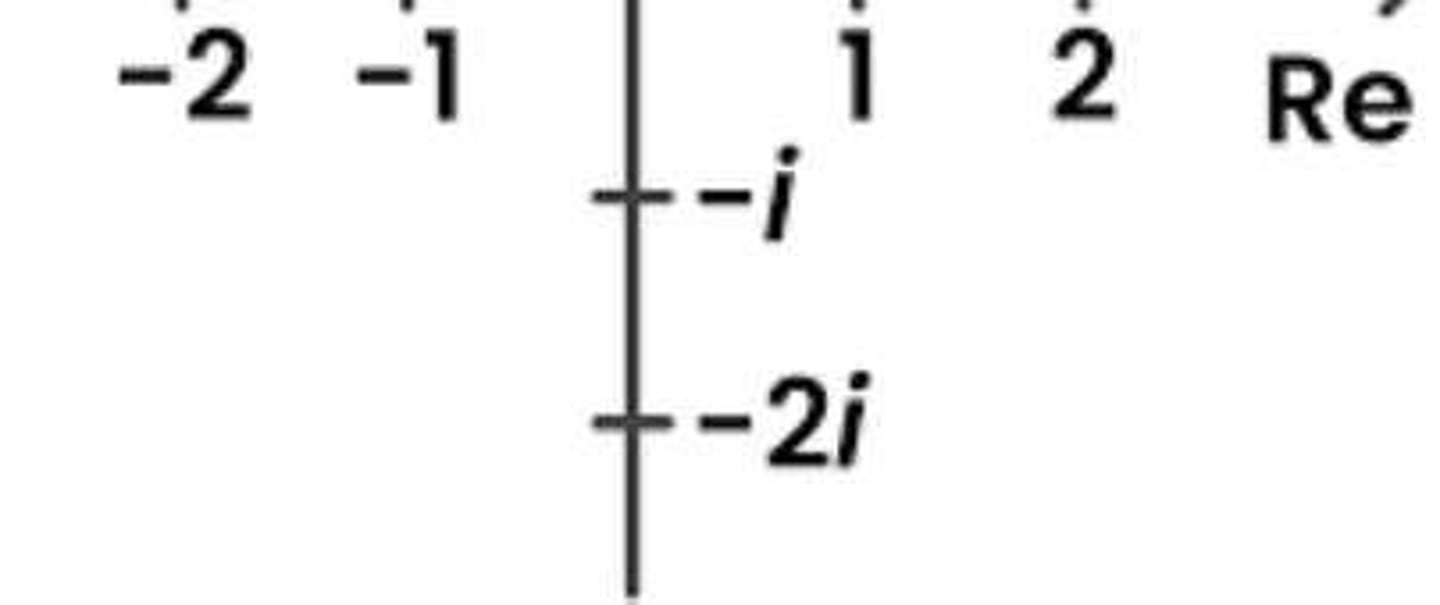
Complex Plane
Graphical representation of complex numbers.
Polar Graphs
Graphs defined by polar equations.
Extrema of Polar Graphs
Points where radius changes direction.
Average Rate of Change
Slope calculated using two points.
Estimating Values
Graphing helps find key points in functions.