AP Micro - Unit 6
1/19
Earn XP
Description and Tags
Name | Mastery | Learn | Test | Matching | Spaced |
|---|
No study sessions yet.
20 Terms
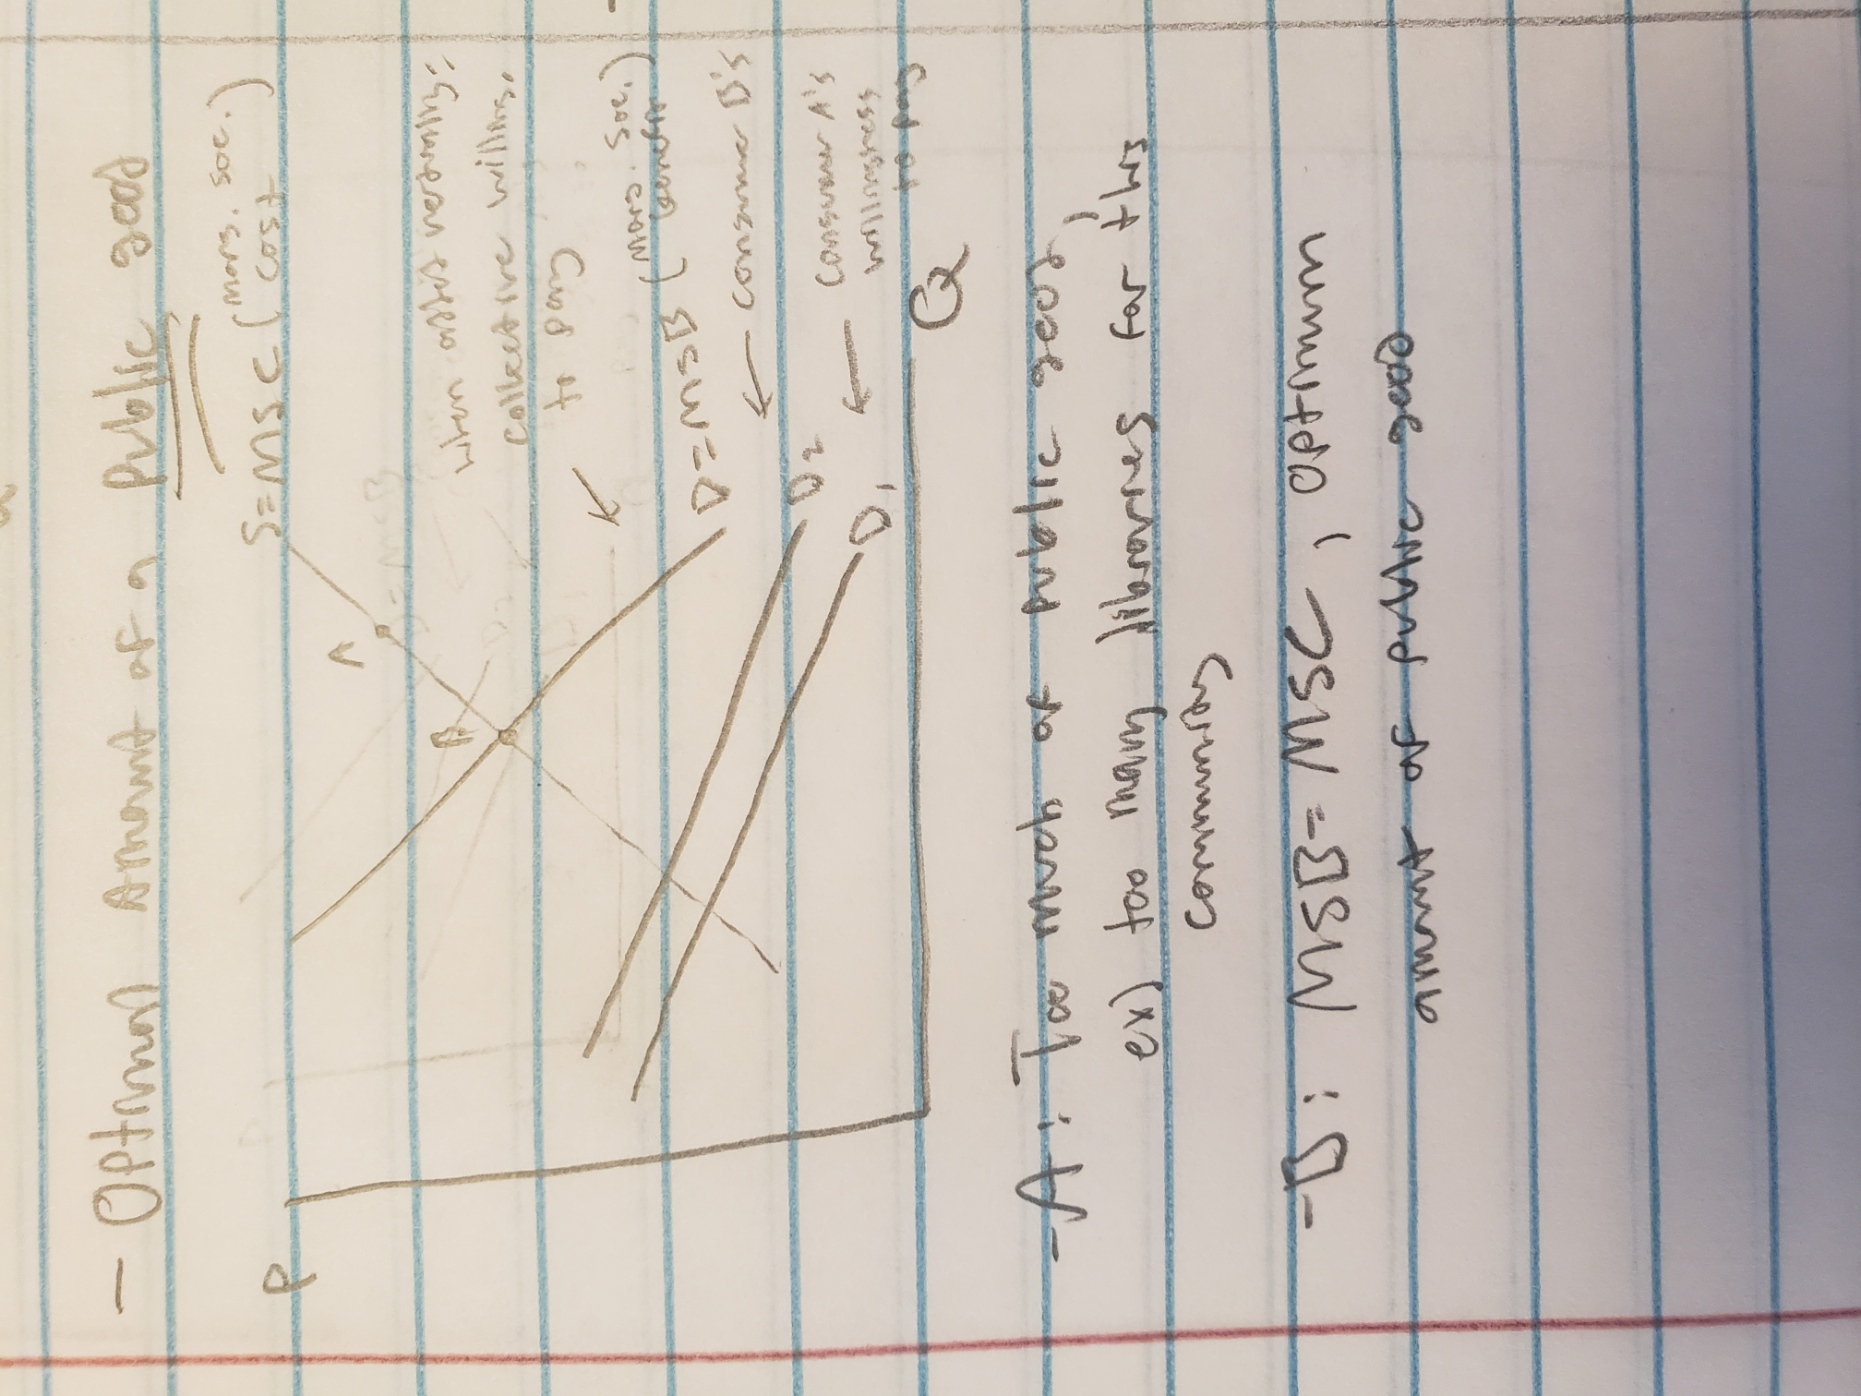
optimal amount of a public good
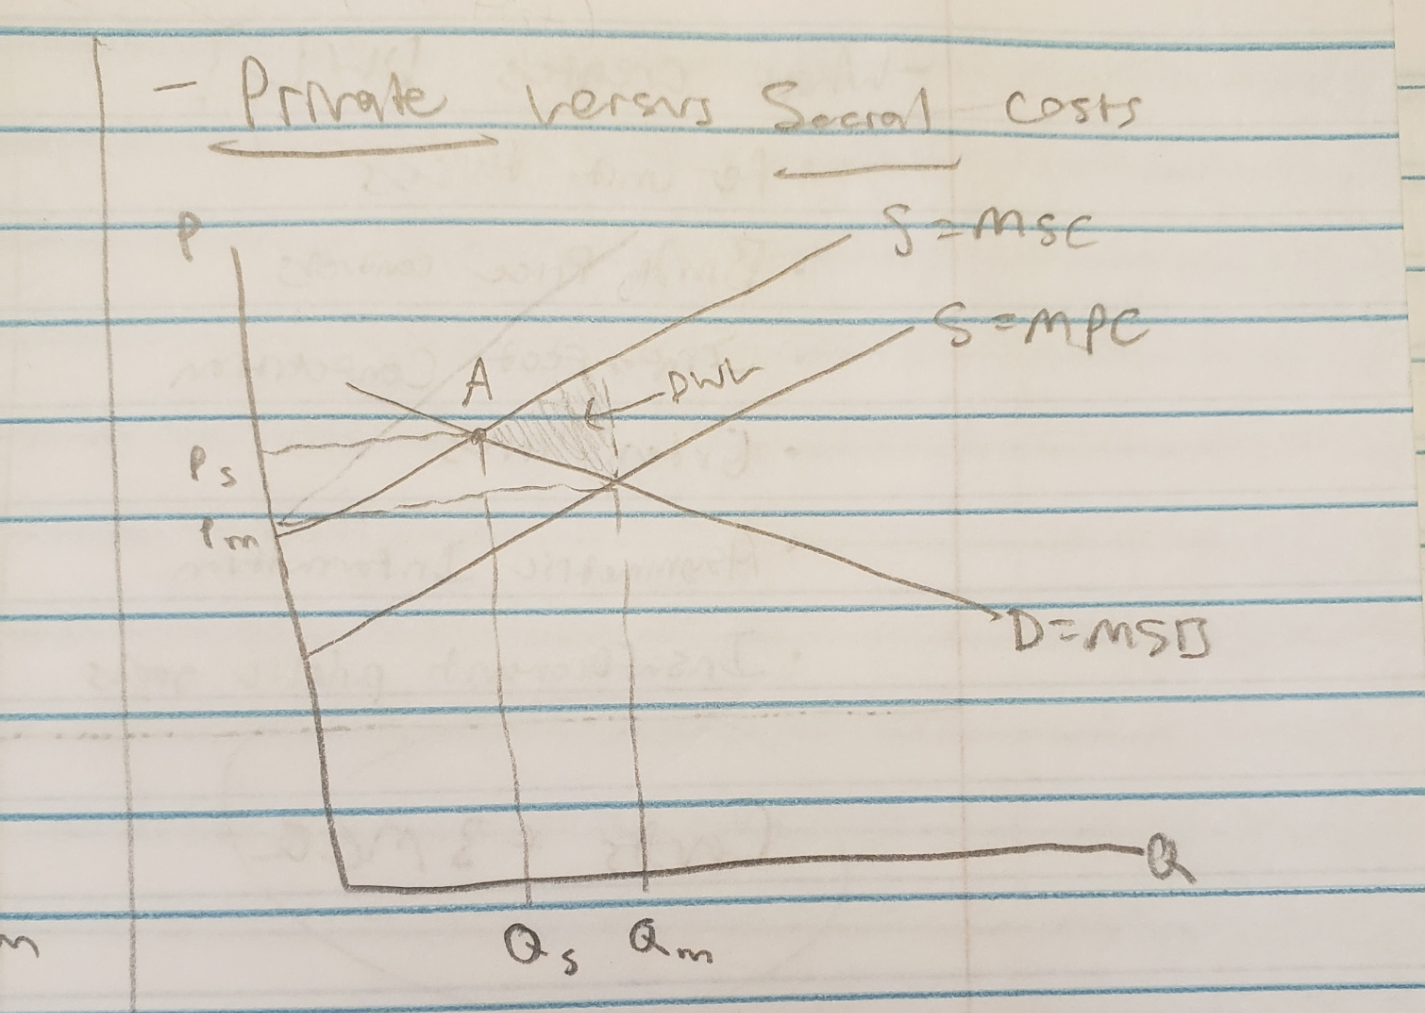
private costs vs. social costs
private costs = firm’s costs to produce the good
social costs = those costs + the effects of making that good (ex: pollution) (thus, tend to be higher)
The ideal point (A) has less produced (to reduce the impact of negative effects) with a higher price (to give firm more money to address effect)
information failures
asymmetric exchange of info between buyer and seller
Seller side
Licensing (yes, you are a dentist)
Weights and measures (ensures equal in all firms, no firm is selling less for same price)
Buyer side
Moral Hazard Problem (recklessness bc you have insurance)
Adverse Selection (insuring more risky than safe people, example, smokers know they will die so they buy more life insurance and insurance companies allow it)
what creates deadweight loss?
Per unit taxes
Binding price controls
Imperfect competition
Externalities
Asymmetric Information
Insufficient public goods
allocative efficiency
MSB = MSC
externalities
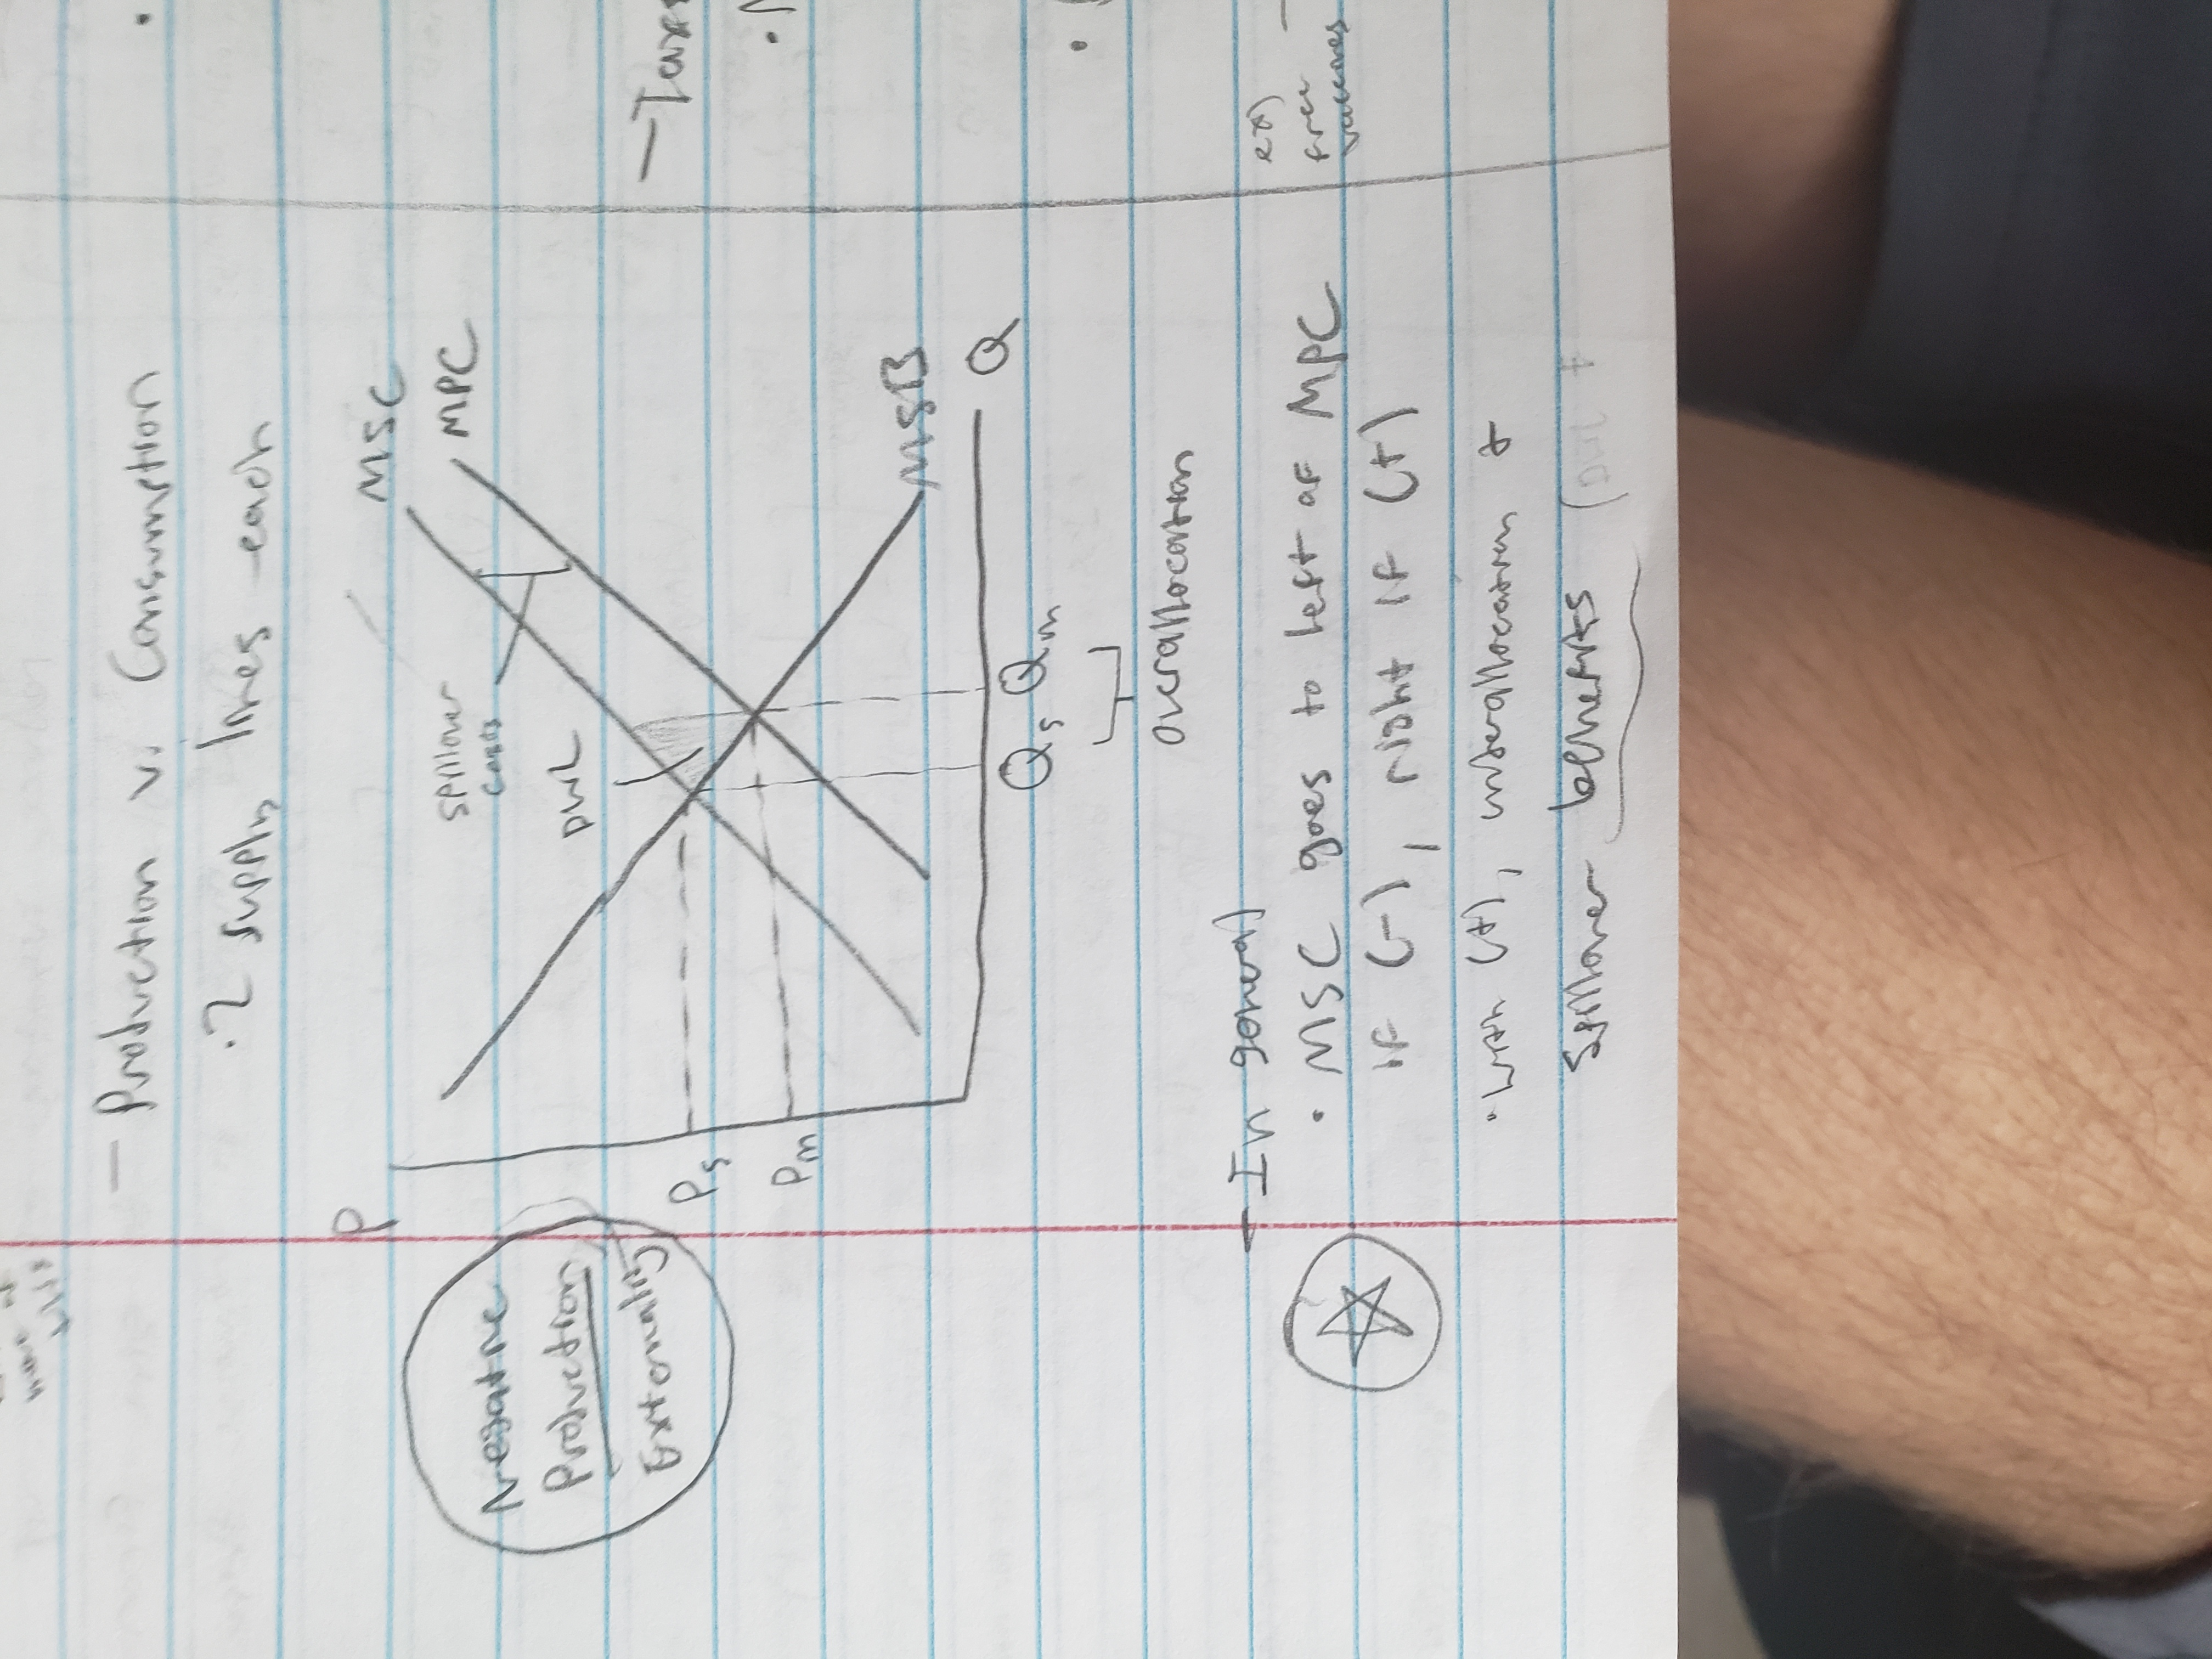
market failure (MSC > MPC)
requires gov. action
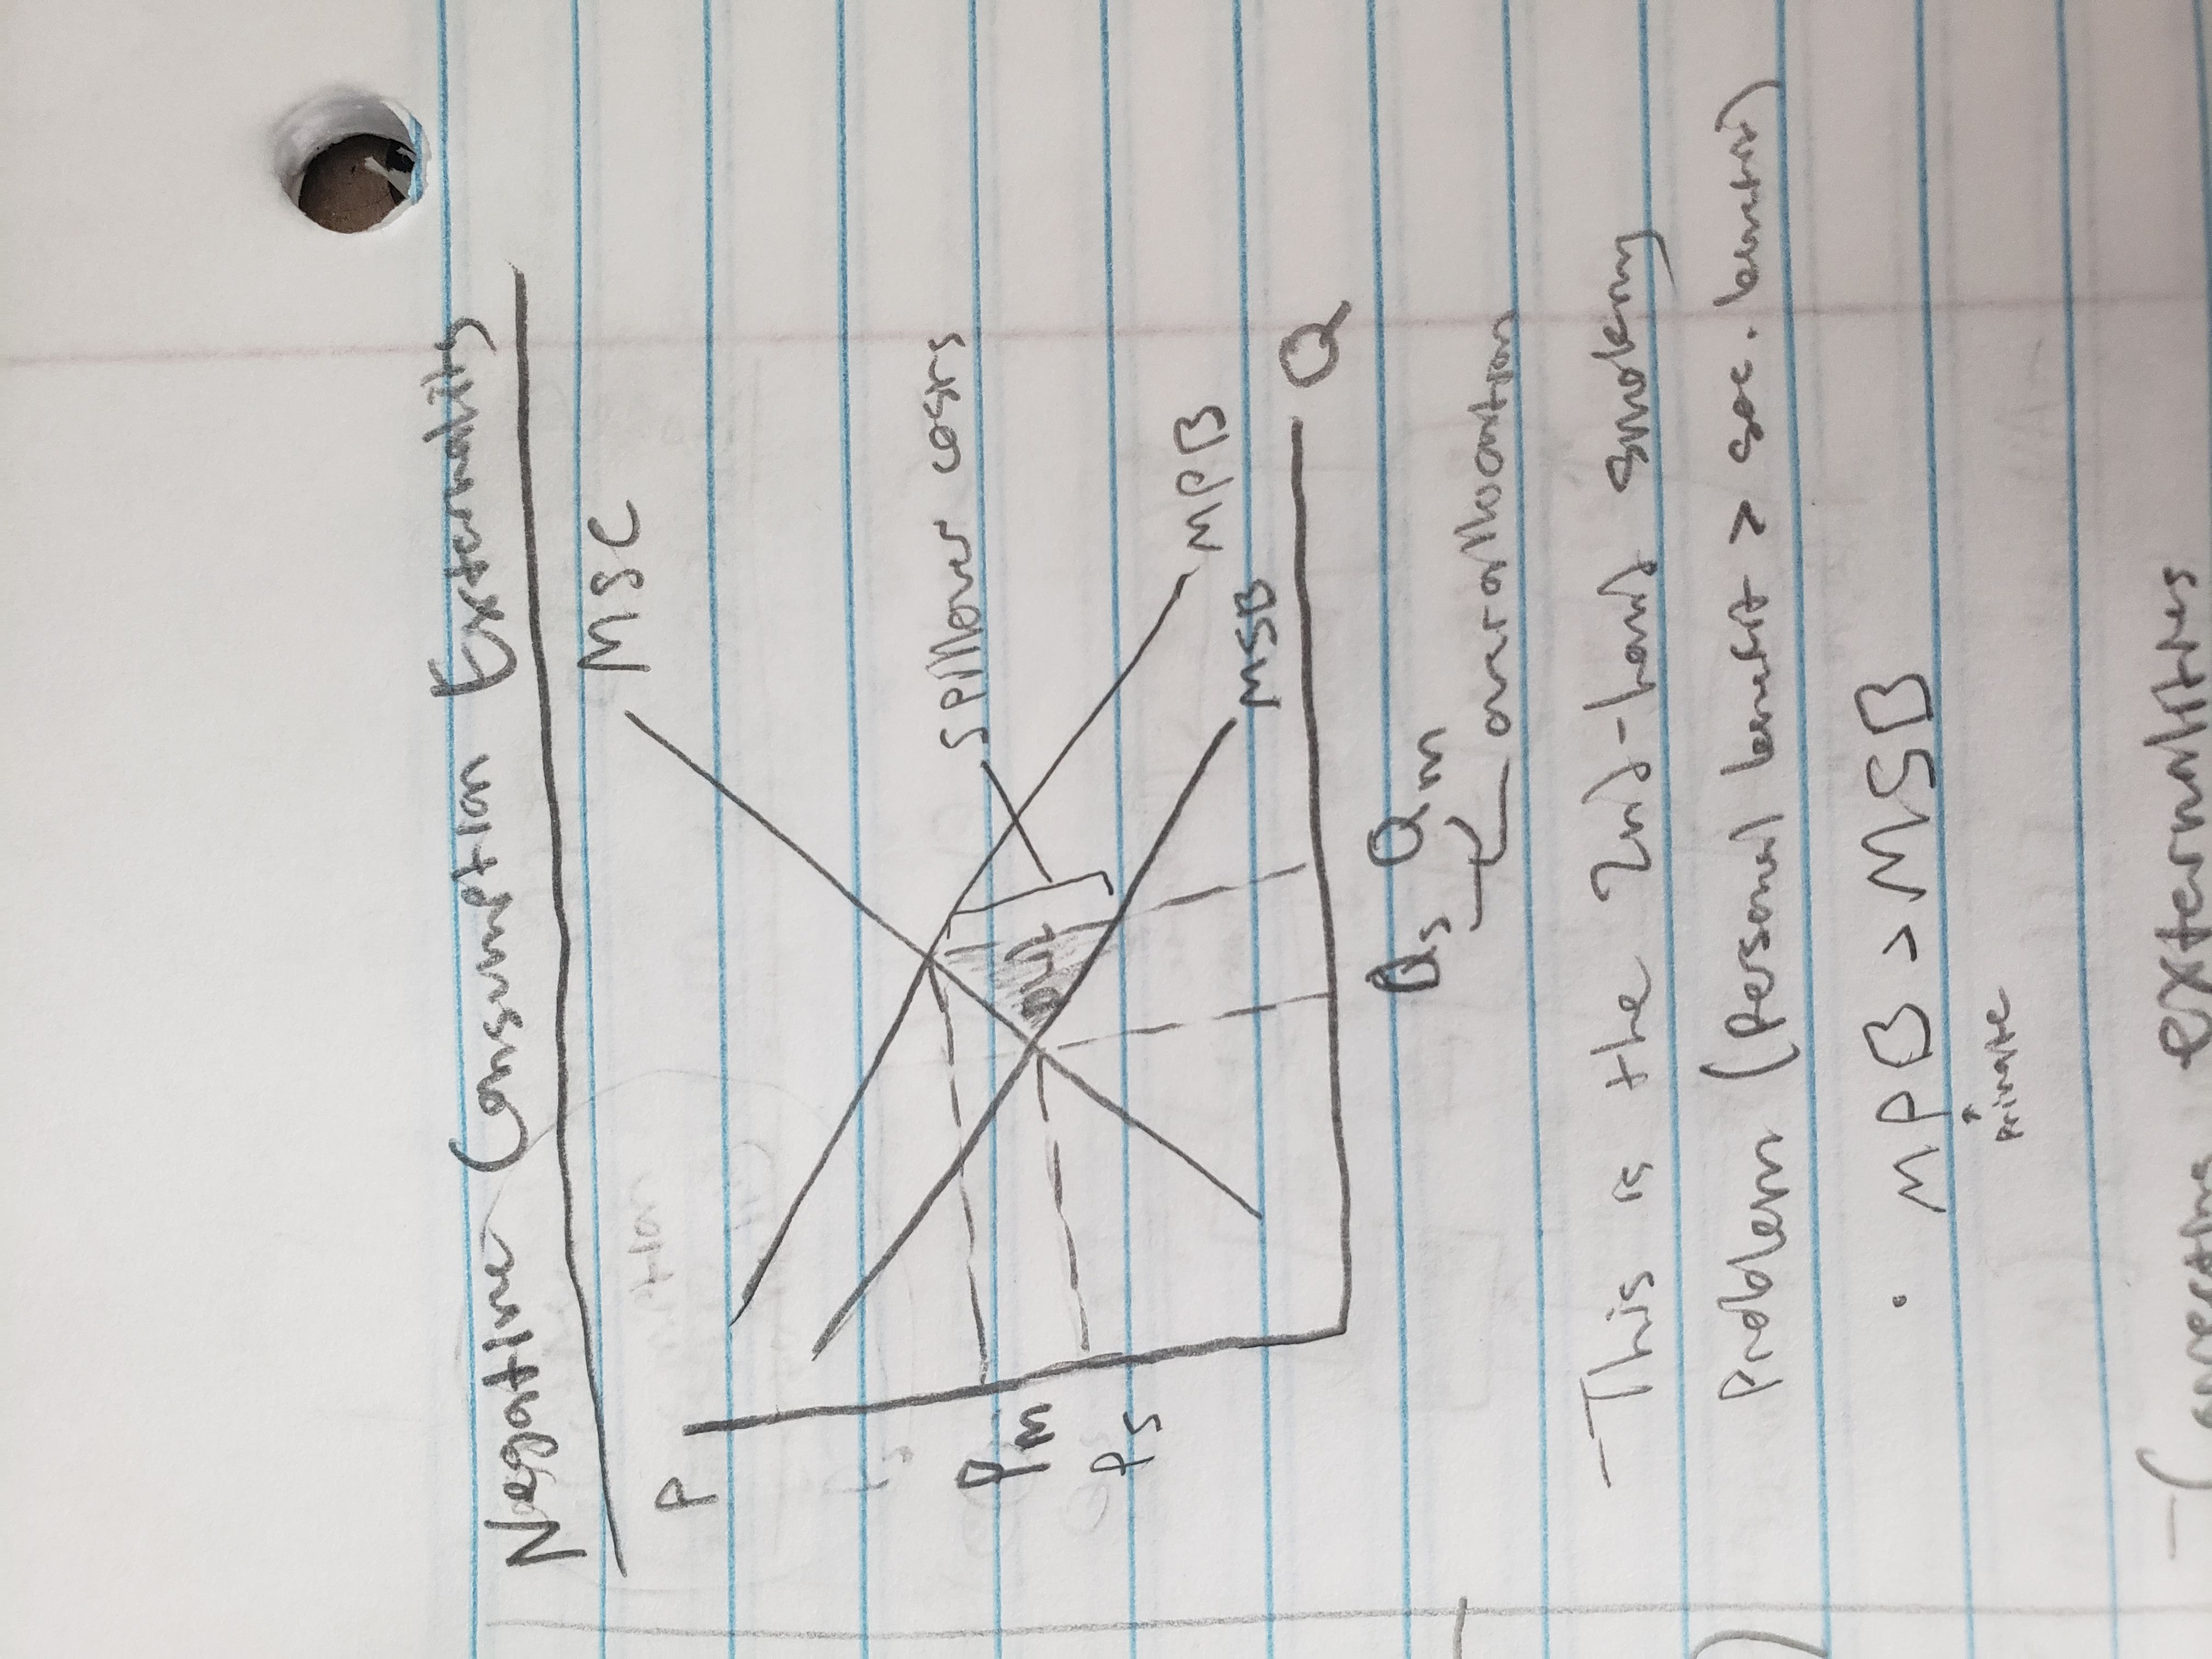
Negative Externalities
external (spillover) cost (2nd hand smoking)
overproduction (want less of it)
Positive Externalities
External (spillover) benefit (getting flu shot)
underproduction (want more of it)
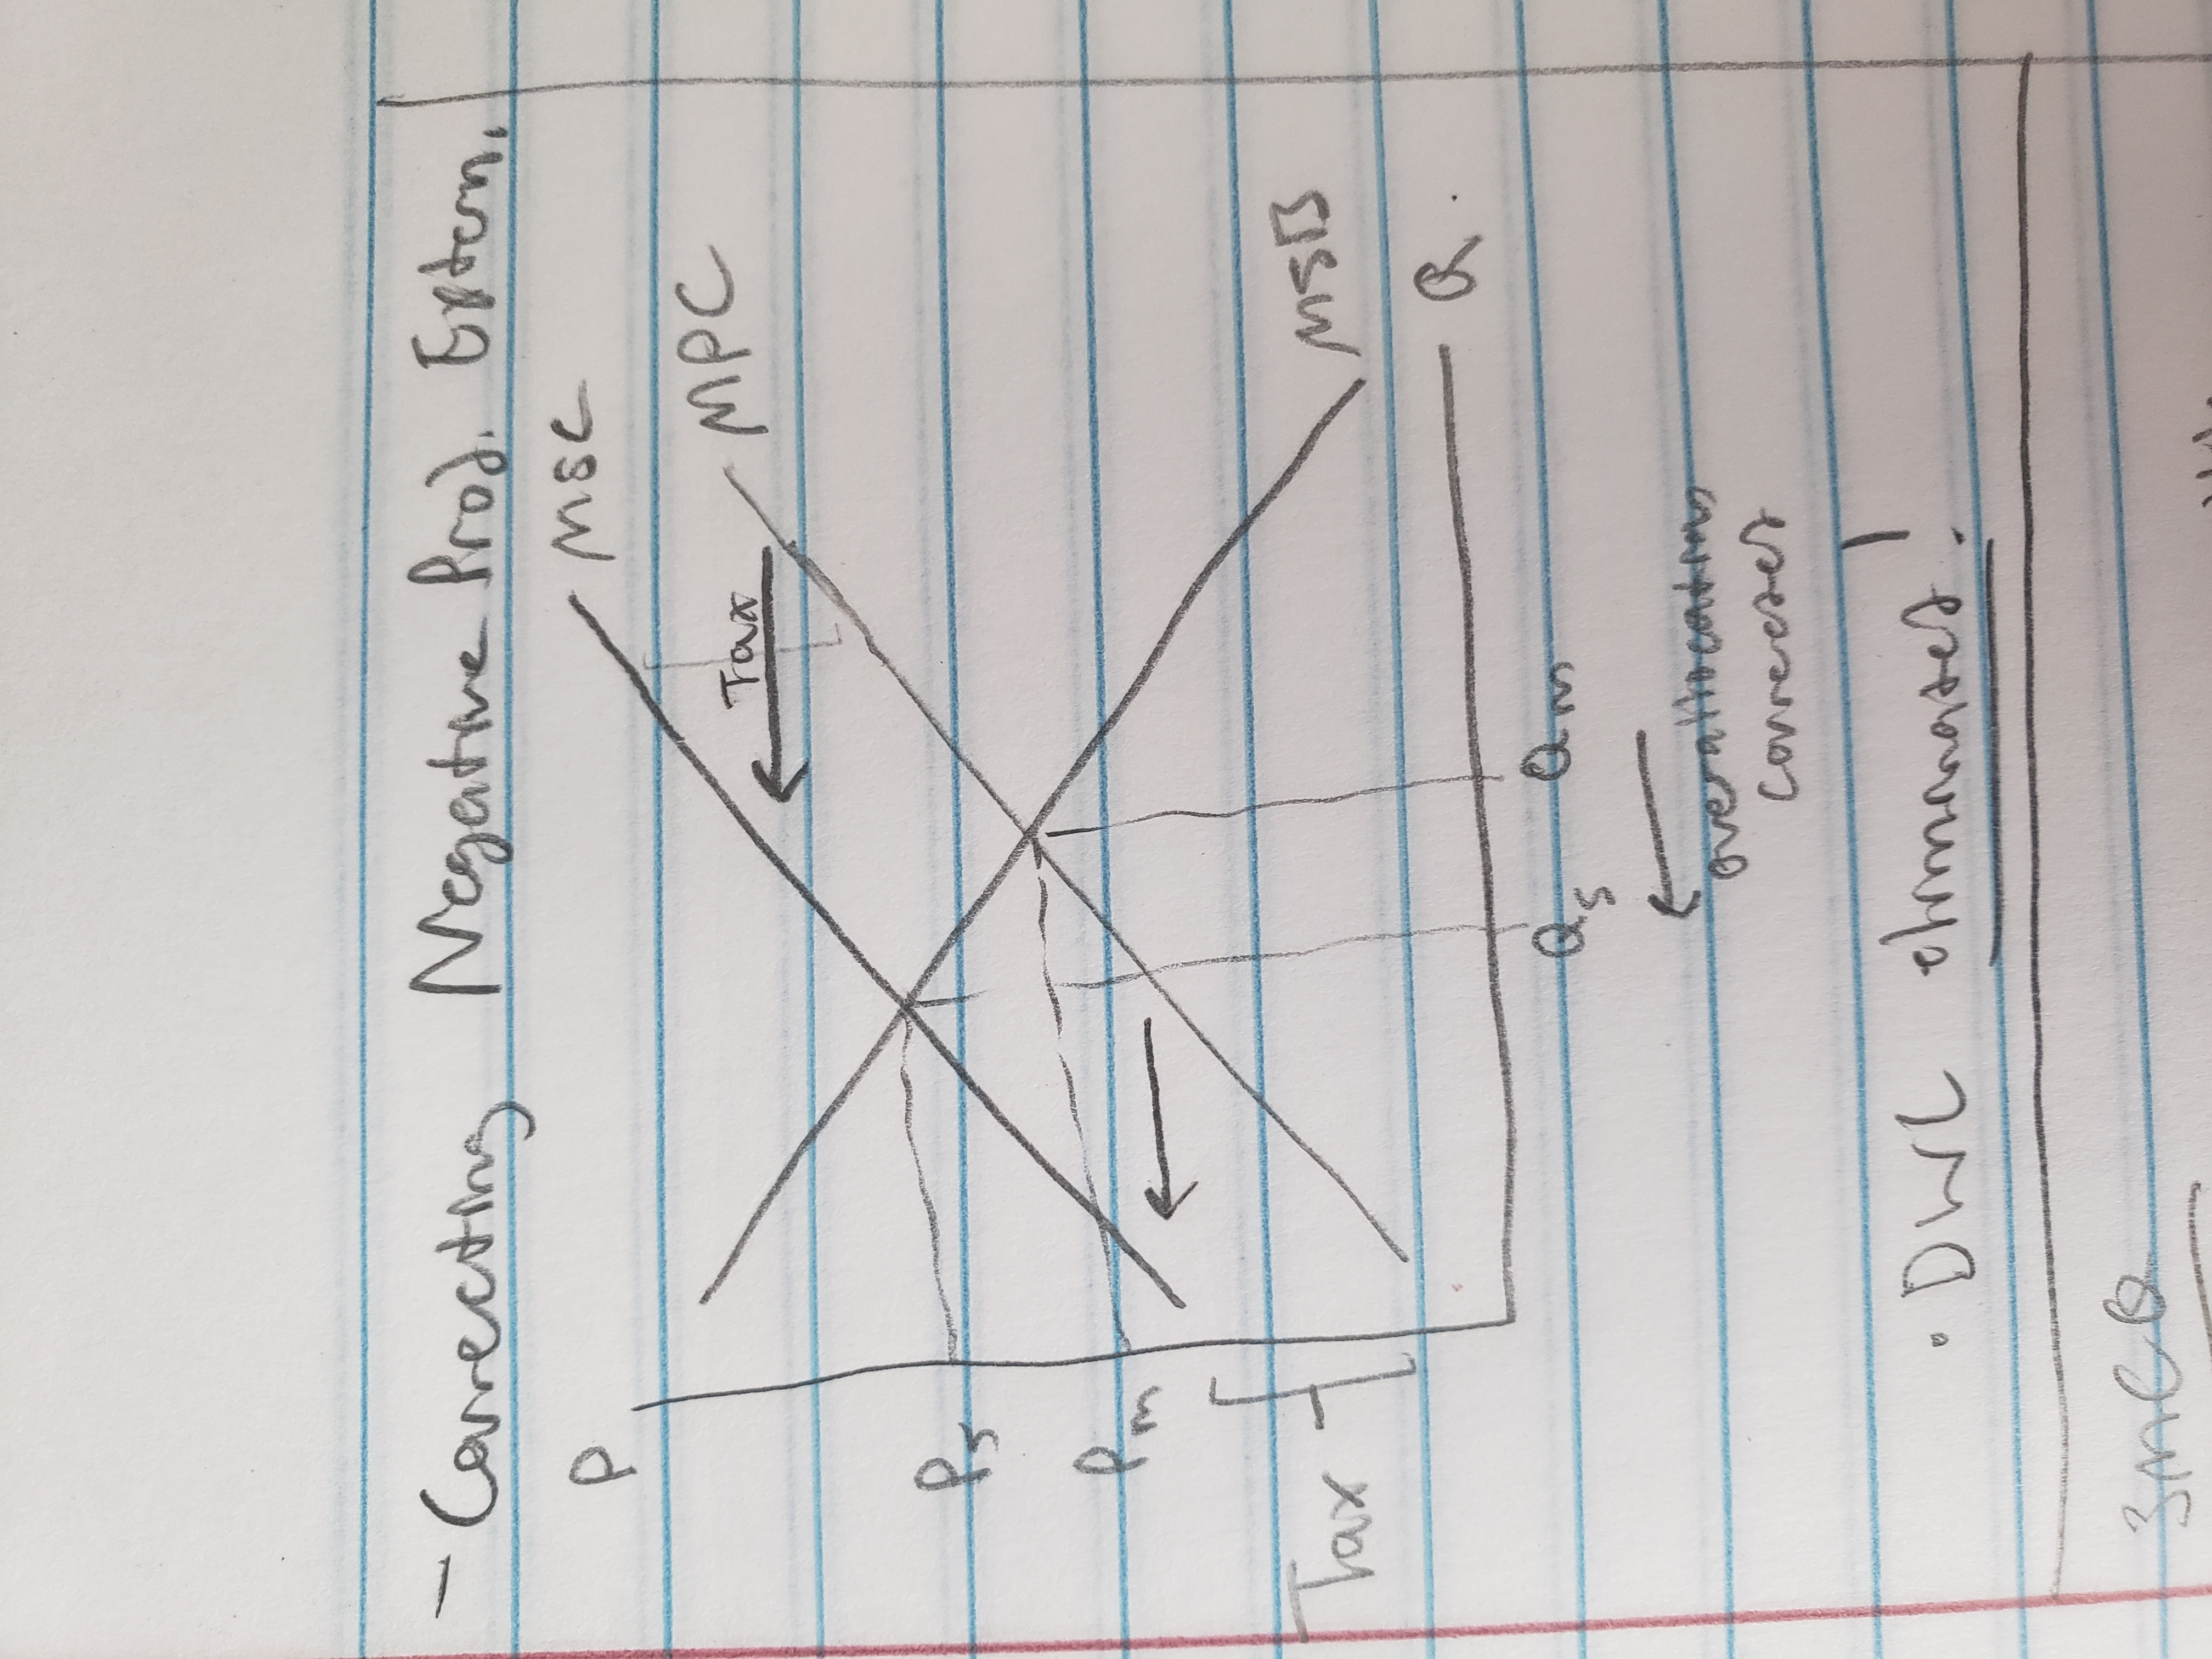
negative production externality graph
negative consumption externality graph
correcting externalities
individual bargaining, Coase Theorem (just asking the smoker to stop)
liability rules and lawsuits
regulations on pollution
Government Intervention
direct control
taxes, subsidies
environmental regulation
assigned property rights
Taxes/subsidies
negative extern: production = tax the product, consumption = tax the product
positive extern: production = sub. producer, consumer = sub. consumer (ex, free vaccines)
private good
rival
excludable (ex, you cannot enter private property)
demand curve = horizontal summation
public good
non-rivals
non-excludable
demand curve = vertical summation
supplied by gov
gov estimates demand
compare MSB and MSC
“Tragedy of the Commons” = People tend to treat public goods worse (litter in public parks)
Free rider problem
Issue with non-exclusion with public goods
If the gov. decides to build a 5th park, and Adam doesn’t feel as if it is necessary, he won’t finance it, but Bob will. As a result, gov. still receives funding and builds the park. Adam can still use it, but didn’t contribute to it, and thus he is a free rider
effects of gov. intervention in diff. market models
review unit 2 effects of taxes in subsidies on AVC, ATC, MC, AFC
Taxes and Elasticity
More elastic curves = more DWL
More inelastic curves = pays more of the tax (tax incidence)
gov. regulation of monopolies
anti-trust acts (clayton, sherman acts)
Ignores short-lived monopolies like a pharmaceutical and their new drug
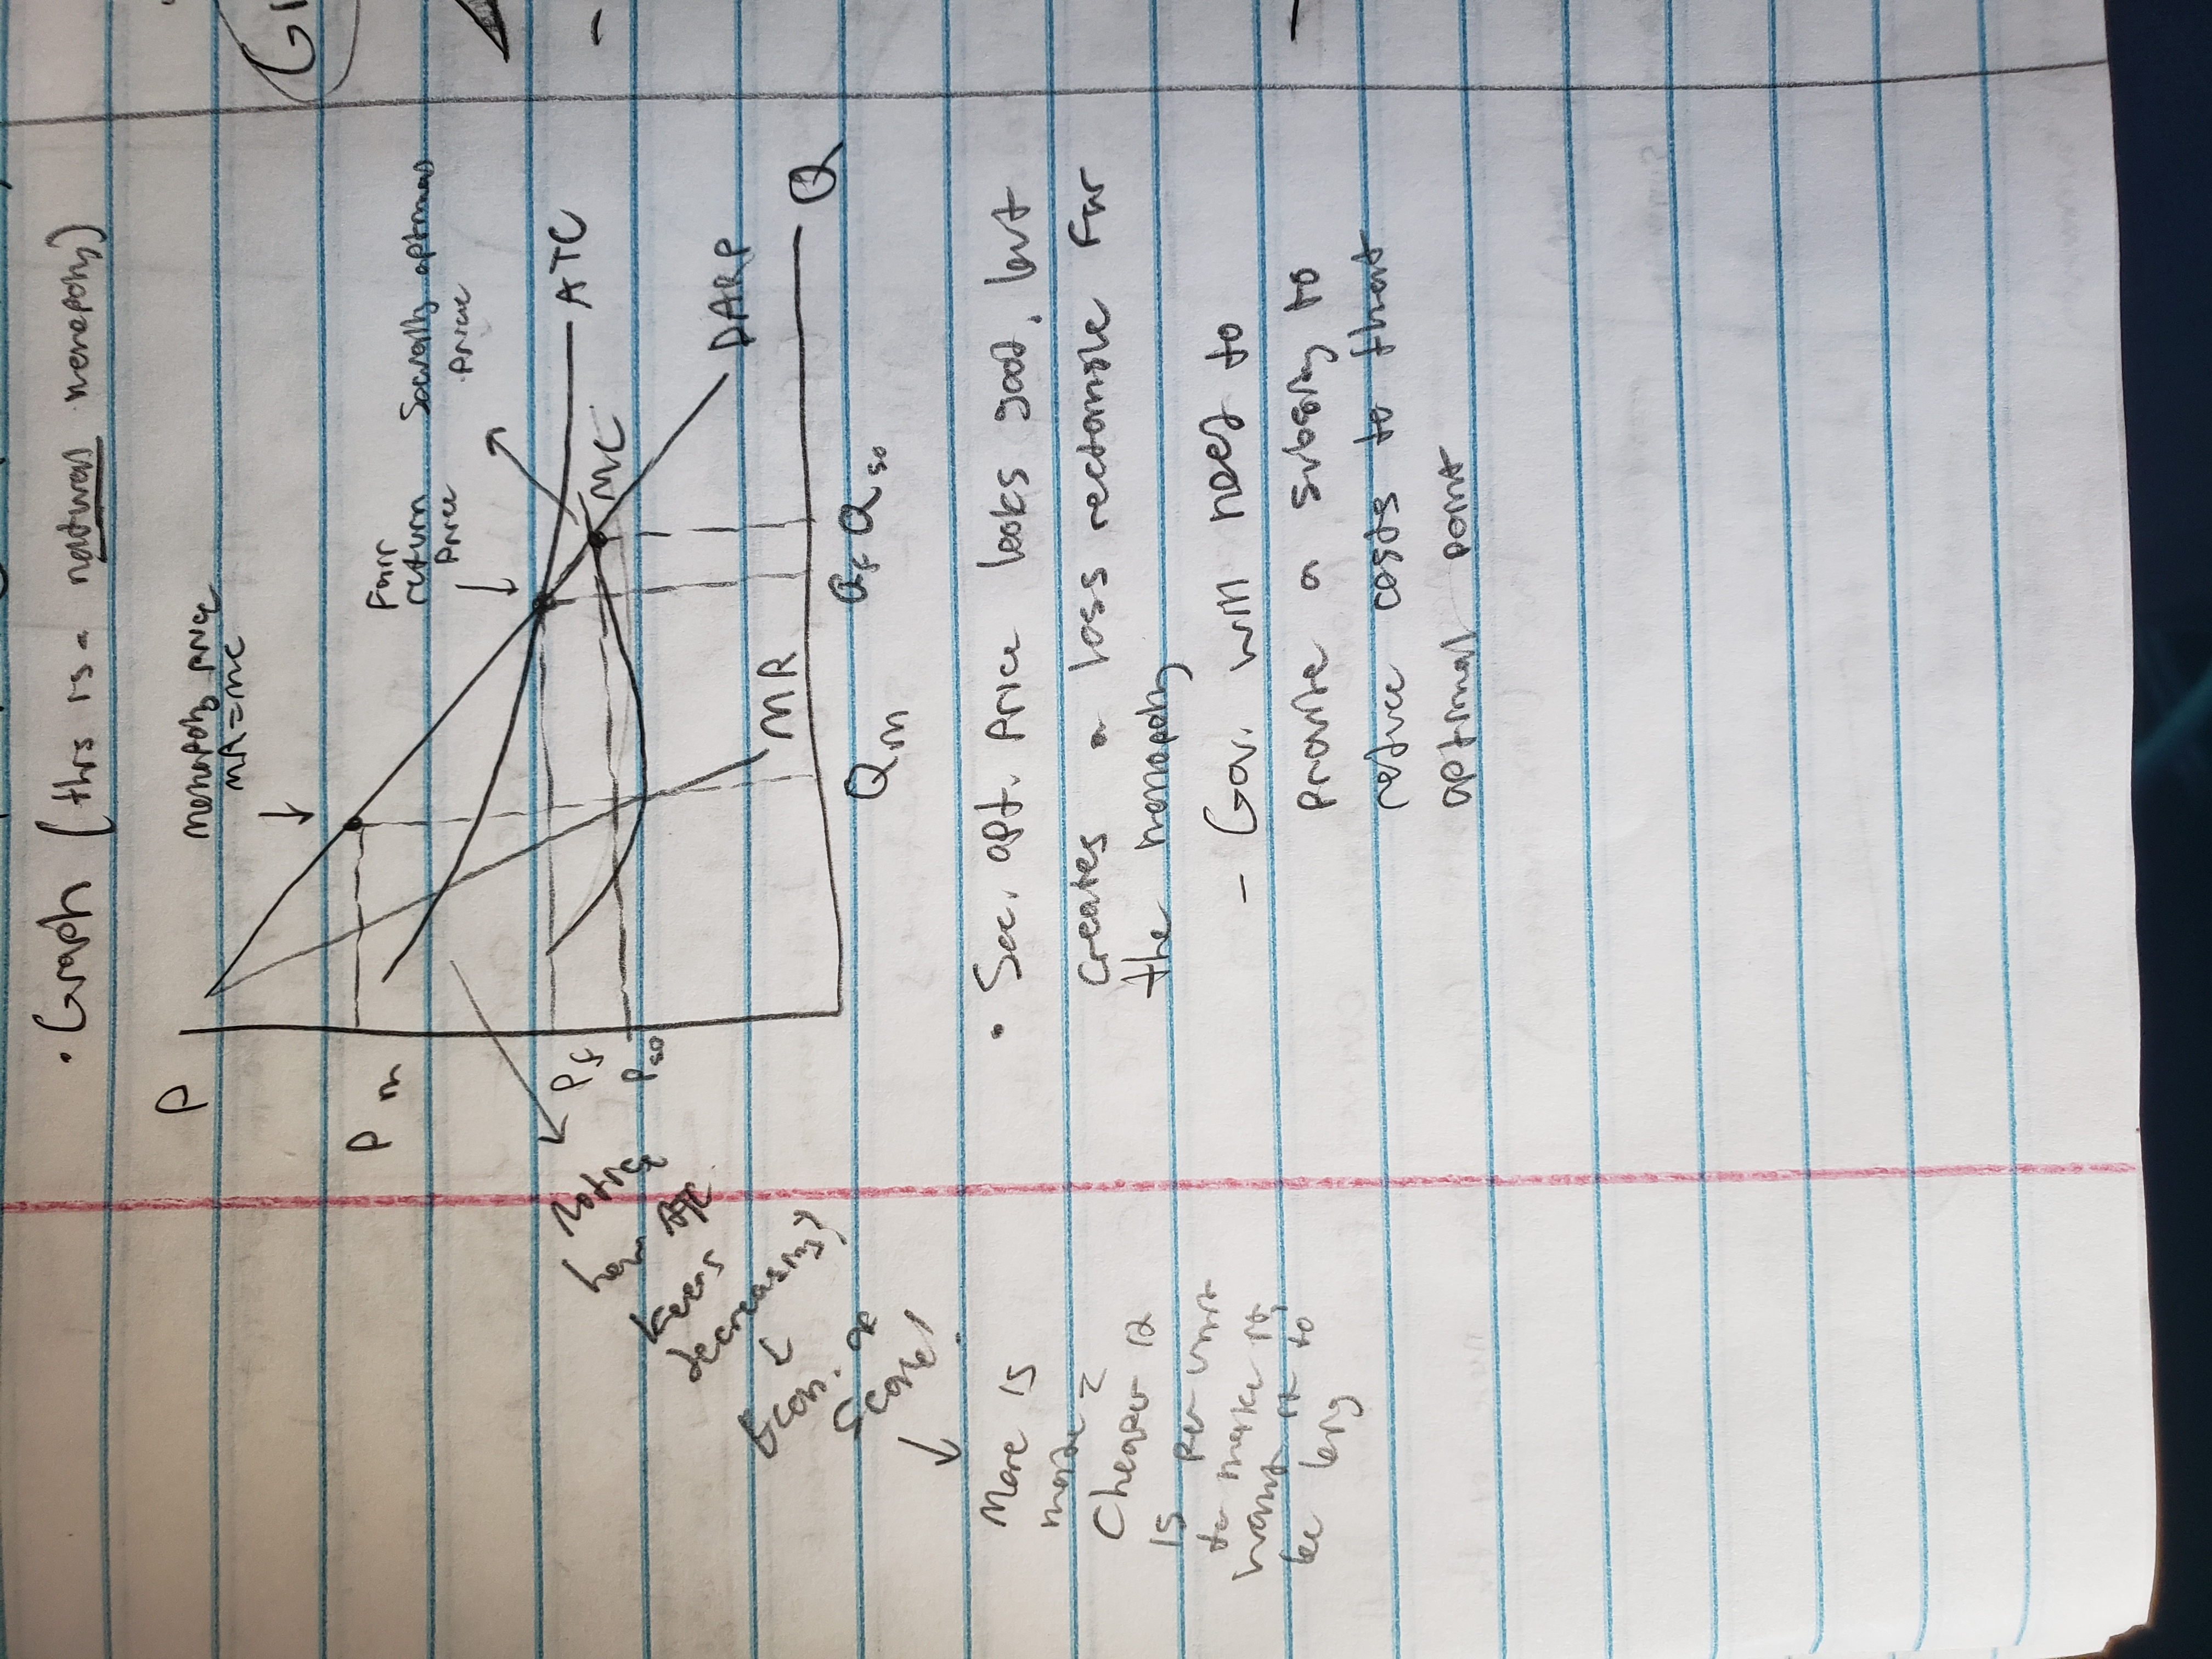
regulates natural monopolies
Gov. set prices
Socially optimal price (P = MC)
Fair-return price (P = ATC) (zero econ. profit, normal profit only)
lorenz curve
graphs inequality
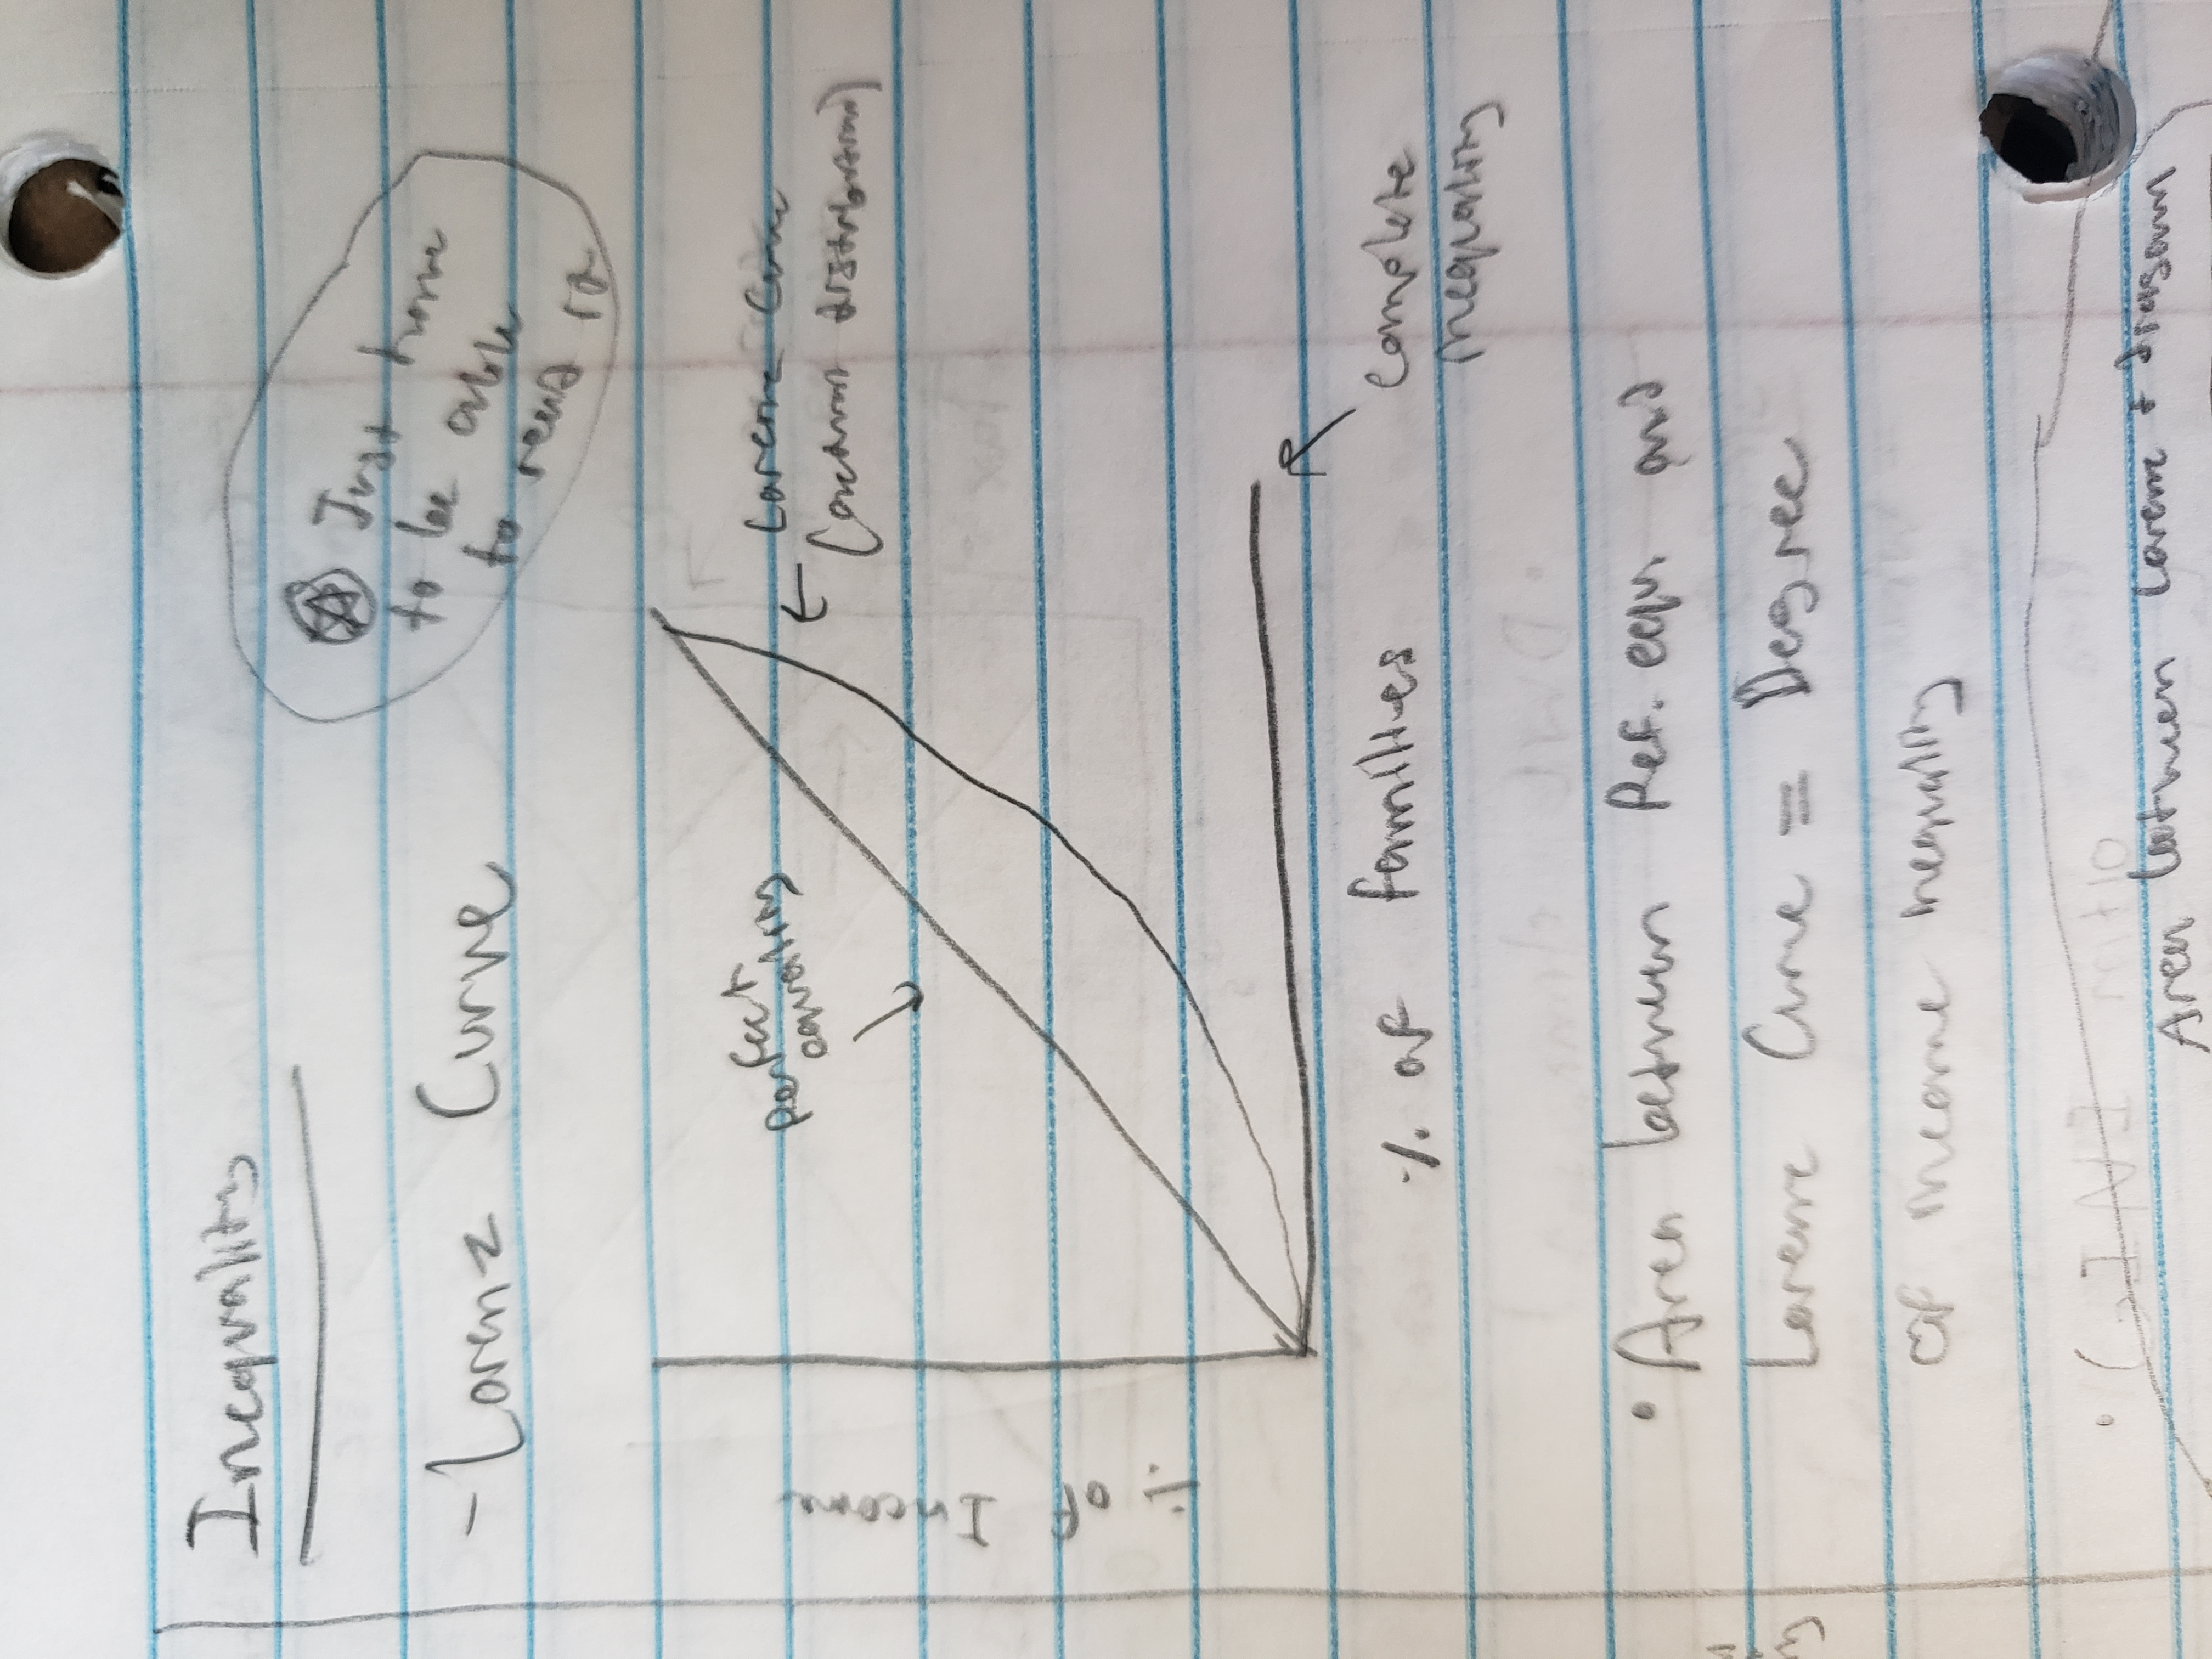
gini ratio
(Area between diagonal and lorenz curve) / (Total area beneath diagonal)
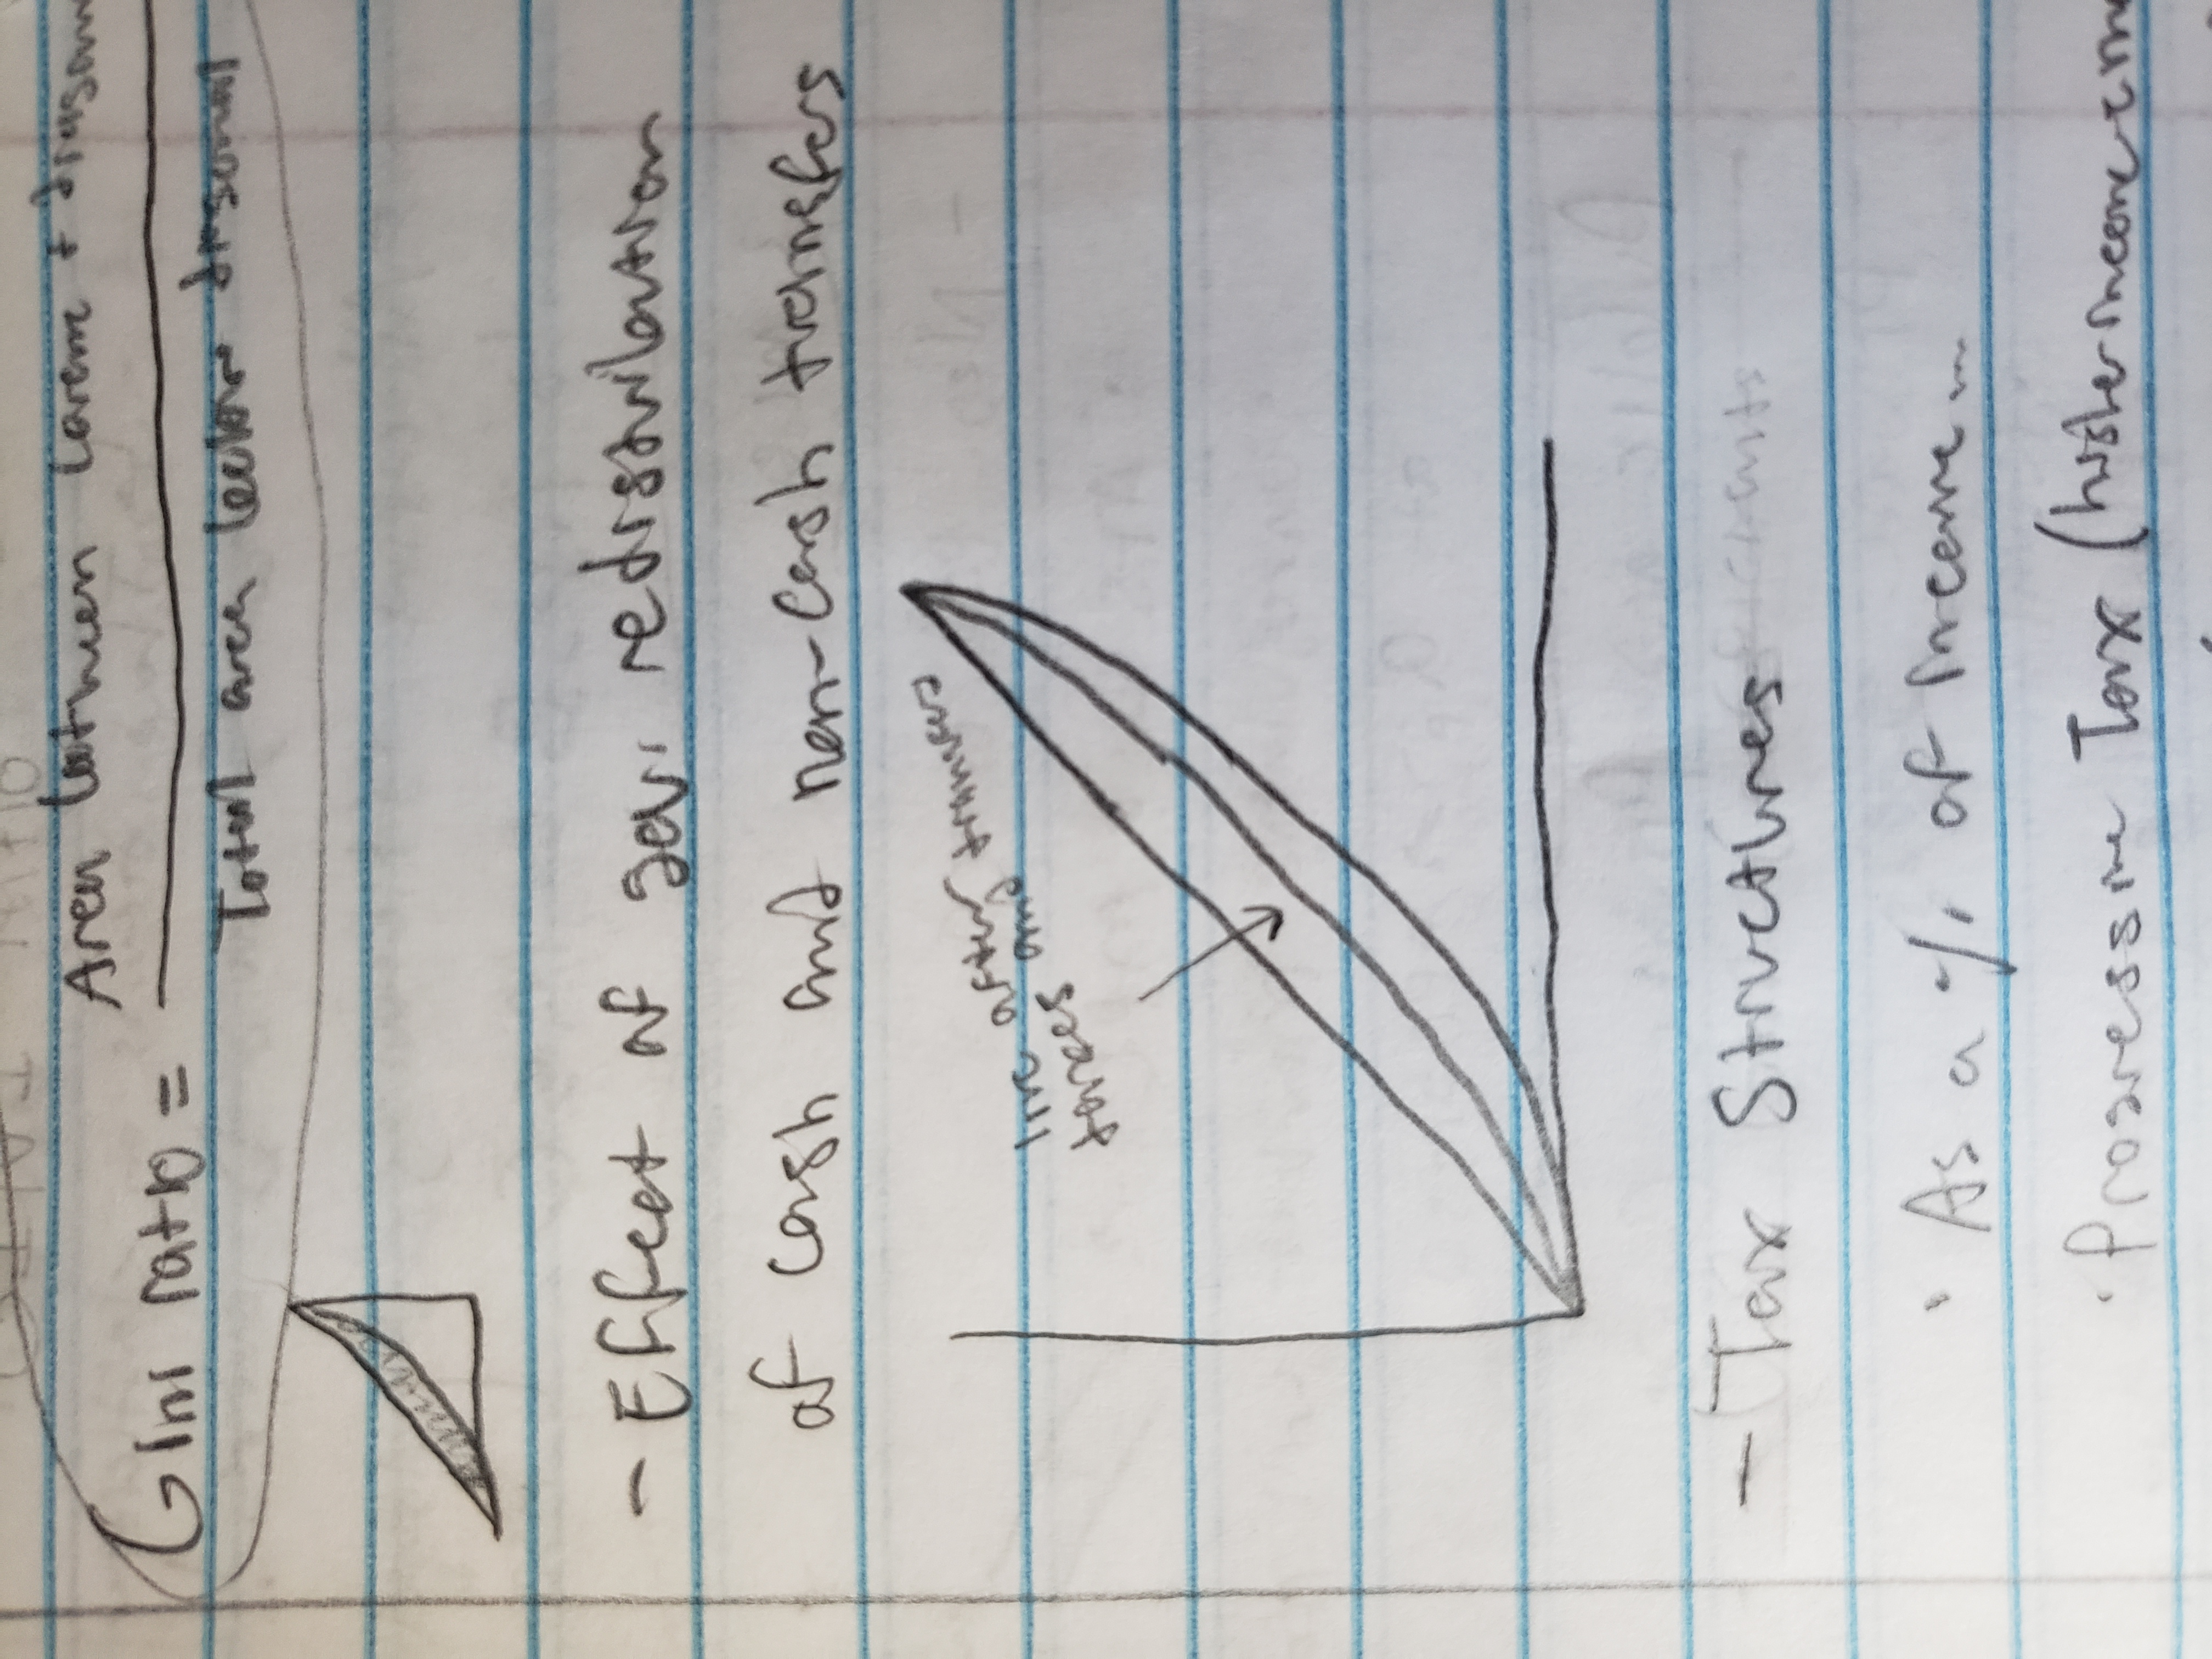
effect of gov. redistribution of cash and non-cash transfers
tax structures
measured as a percentage of income
Progressive tax (wealthier = more)
Regressive tax (poorer = more)
Proportional tax (flat) (all pay same %)
causes of inequality
Greater demand for highly skilled workers
globalization
higher tuition costs (see first point)
decline in unions
Less progressive tax structures
Unequal distribution of wealth
discrimination
poverty
poverty line defines the minimum amount needed to afford food, clothing, shelter, and adequate transportation
pov. rate is 10.5% in USA