Gentics -Day 23
1/20
There's no tags or description
Looks like no tags are added yet.
Name | Mastery | Learn | Test | Matching | Spaced | Call with Kai |
|---|
No analytics yet
Send a link to your students to track their progress
21 Terms
Multifactorial traits
traits determined by multiple genetic and environmental factors acting together
Continuous traits
continuous gradation from one phenotype to the next (height)
categorical traits
phenotype is determined by counting
thershold traits
only two, or a few phenotypic classes but their inheritance is determined bdiabetesy multiple genes and environment (adult onset diabets)
Mean
The average of all phenotypic values
Variance
the spread of distribution estimated by squared deviation from the mean
Standard deviation
square root of the variance
Standard deviation curves
small standard deviation suggests that most data are very close to the mean (narrow curve)
Large standard deviation suggests broad distrubution of data (broad curve)
Genotypic variance
sg2 : Variation in phenotype causes by differences in genotype
environmental variance
se2 : Variation in phenotype caused by environment
Total vairance
Sp2 : combined effects of genotypic and enviormental variance
Sp2 = Sp2 + sg2
How to produce ofspring with 0 genetic variance to measure og and oe
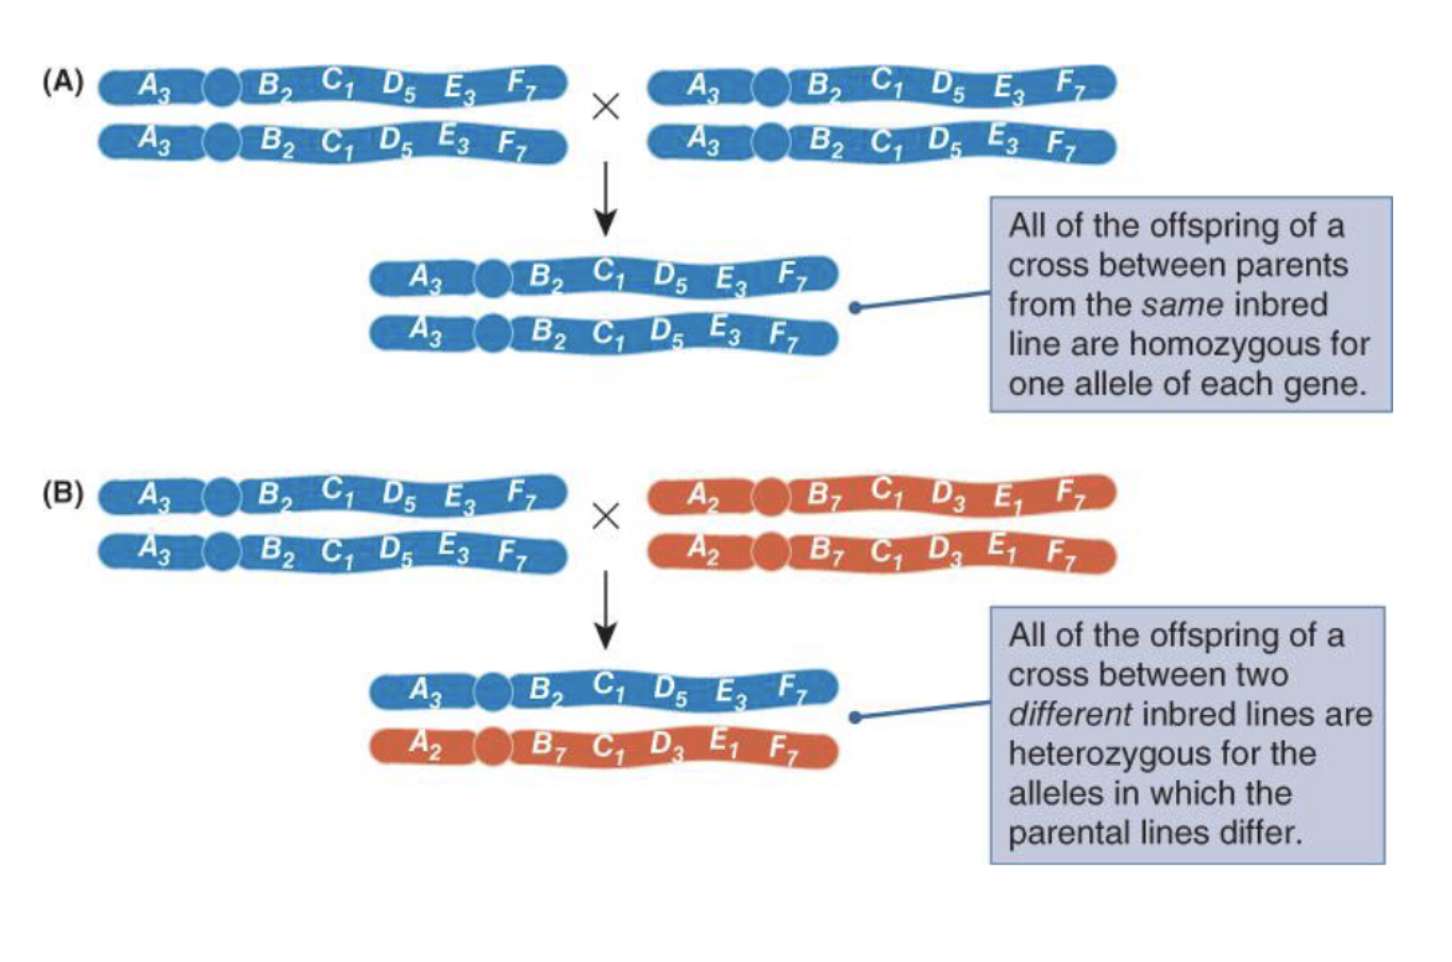
Cross between same inbread line or cross between two different imbreed lines
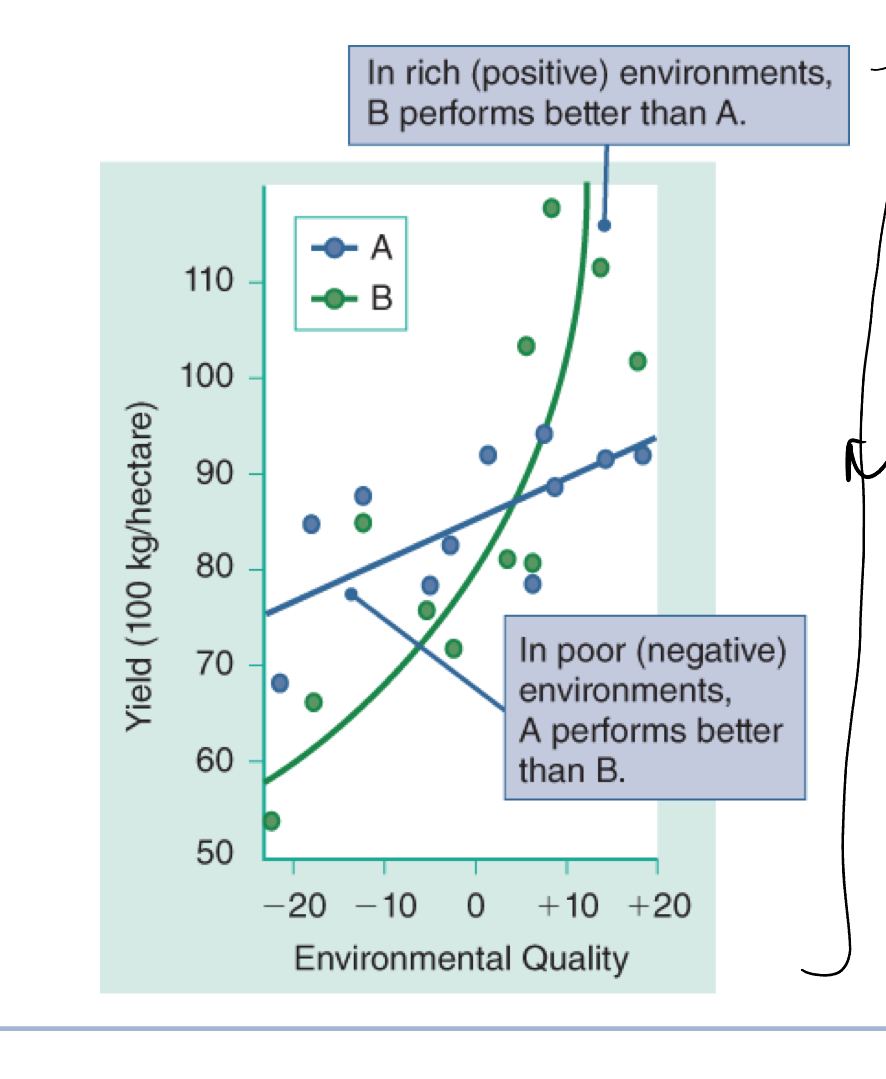
Genotype-enviorment interctions
genotype - environment interactions can change phenotypic distribution
environmental effects on phenotype differ according to genotype
genotype by sex interaction
some genotype produces different phenotype in males and females (height)
Broad sense hertiablity
the proportion of phenotypic variation in a population due to all genetic effects combined
H2=Sg2/sp2= sg2 / (sg2+se2)
narrow sense hertiablity
the proportion of phenotypic variation in a population due to additive affects of individual alleles
h²=sa2/sp2
Artifical selection
Allows for the estimation of hertiablity
M= means of starting population
m*= mean of selected breeders
m’= mean of progeny
selction differential (S): M*-m
response to selection (R)= m’-m
h²=R/S
Articifcal selction limits
Selectional limit: at which succesive generations shsow no futher imporvement can be reached becuse either all alleles have been fixed or lost or naturals elction counteracts artifical selection due to inderect harmful affects of selected traits
Correlated response: effect of selection for one trait on a non selected trait (effects another trait)
Quantitative Trait Loci (QTLs) and Genome-wide association studies (GWAS)
QTLs: Genes that affect a quantitative trait
Localized by determining associations between phenotype and alleles of polymorphic DNA markers
(typically SNPs)
ATLs identified by GWAS
Take DNa sequences ana dcomapre them with millions → can we find some correlation - QTLS
The Basics of Genome-Wide Association Studies
(GWAS)
Sample a large population consisting of unaffected and affected individuals.
• Determine genotypes at a large number (> 500,000) polymorphic markers (usually SNPs).
• Look for statistical correlations between presence of SNP alleles and the phenotype in question.
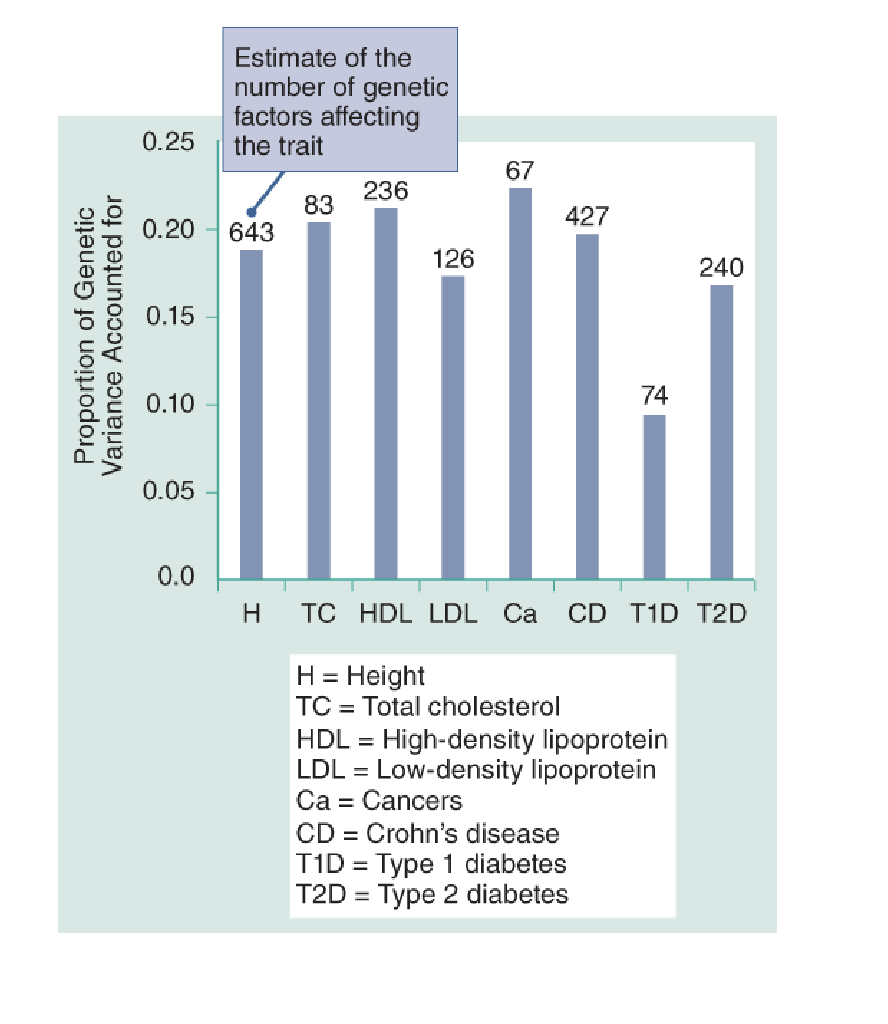
When you exame the traits, most traits are examined are affected by a large number of loci, loci typically explain only 10–20% of the total heritability of a trait.
Why the missing heritability?
epistatic genes are not detected
rare variants are not represented in sample populatiion
effects of some varients are too small to be detected