PERFORMANCE EVALUATION
1/62
There's no tags or description
Looks like no tags are added yet.
Name | Mastery | Learn | Test | Matching | Spaced | Call with Kai |
|---|
No analytics yet
Send a link to your students to track their progress
63 Terms
It is an internal reporting system that supports decentralization of decision making and generation of information specific to the center
Responsibility Accounting
It is the delegation of authority and responsibility to supervisor or mid-level management
Decentralization
It leaves decision making to few top-level management
Centralization
It breaks out a company’s financial data by company divisions, subsidiaries, or other kinds of business segments.
Segment Reporting
Segment Reporting Formula
Sales | xx |
Variable Manufacturing | (xx) |
Manufacturing CM | xx |
Variable Selling and Admin | (xx) |
Contribution Margin | xx |
Controllable Fixed Cost | (xx) |
Performance Margin | xx |
Direct Fixed Cost | (xx) |
Segment Income | xx |
Allocated Fixed Cost | (xx) |
Net Income | xx |
It is the situation in which people in multiple levels of an organization share the same goal
Goal Congruence and Motivation
It is a situation in which a business is not as successful as it could be because one part or department works only on its own or only for its own success
Sub-optimization
These are costs which may be directly regulated at a given level of managerial authority and time-frame
Controllable Costs
This cost is cannot be altered based on a personal business decision or need.
Non-controllable Cost
These are fixed costs under direct supervision of the segment manager (advertising)
Controllable Fixed Costs
These fixed costs are not controllable but is avoidable if a segment or division is discontinued (supervisor’s salary)
Direct/Traceable Fixed Costs
These are fixed cost necessary to sustain operations of multiple segments. It cannot be directly identified to a specific segment or division (salary of top management)
Common Fixed Cost (Unavoidable fixed, allocated fixed)
It is a performance metric intended to evaluate segment manager’s performance considering all controllable costs including controllable fixed cost
Performance Margin
Responsibility Centers
Cost Center
Profit Center
Investment Center
Revenue Center
Comparison of Responsibility Centers
Factor | Cost | Profit | Revenue | Investment |
Accountability | Cost and Expenses | Revenues; Costs and Expenses | Revenue | Investment; Revenues; Cost and Expenses |
Evaluation | Standard Cost Variance | CM; Segment Income | Revenue Variances | Return on Investment; Residual Income; Economic Value Added |
Example | Production; HR; Repairs and Maintenance department | Marketing department | Each sales division in a department store | Branch; Subsidiary |
This is a test of profitability by comparing a desired minimum required rate of return (ROR)
Return on Investment
Formula for Return on Investment (ROI)
Operating Income ÷ Average Investment or Assets
or
Profit Margin x Asset Turnover
It measures the absolute peso return of an investment over the minimum ROR
Residual Income (RI)
Formula of Residual Income
Operating Income - (minimum ROR x Average Investment or Assets) or
(ROI (%) - Min ROR (%) or Cost of Capital) x Asset Base
ROI VS RI
ROI | RI |
Measures net operating income earned relative to investment in average operating assets | Measures net operating income less the minimum required return on average operating assets |
Approach that results to goal congruence
Residual Income
It measures company’s financial performance based on the residual wealth
Economic Value Added (EVA)
Economic Value Added (EVA) Formula
EBIAT - (WACC x Long-term Sources of Financing) or
NOPAT - [(Total Assets - Current Liabilities) x WACC]
It is the price charged by one segment of an organization for a product or service that it supplies to another segment of an organization.
Transfer Price
Three Primary Approaches of Transfer Pricing
Negotiated Transfer Price
Cost of the Selling Division
External Price of the Buying Division
It is a price agreed for goods or services between the buying and selling division without basing it on market price
Negotiated Transfer Price
It is the price charged for an item on the open market and is often regarded as best approach
Transfers at Market Price
Approach where the selling division records one price whereas the buying division is charged a different price for the same product or service
Dual Transfer Price
It is the acceptable transfer price between the highest transfer price of the buying division and the lowest acceptable transfer price of the selling division
Transfer Price Range
Formula of the Lowest/Minimum Acceptable Transfer Price
Variable Cost + Opportunity Cost if any + Incremental Fixed Cost if any or
Variable Cost + (Total CM of Lost Sales ÷ Total Units Transferred)
It is the highest/maximum transfer price
External Price (MV) or Selling Price of selling division
It consists of an integrated set of performance measures that are derived from and support the company’s strategy throughout the organization
Balanced Scorecard
Four Perspectives of Balanced Scorecard
Financial Perspective
Customer Perspective
Internal Business Process Perspective
Learning and Growth (Infrastructure) Perspective
It establishes the long and short term financial performance objectives expected from the organization’s strategy and simultaneously describes the economic consequences of actions taken in the other three perspectives.
Financial Perspective
Three components of Financial Perspective
Revenue Growth
Price-Recovery
Productivity
It defines the customer and market segments in which the business unit will compete and describes the way the value is created for customers.
Customer Perspective
Five Key Core Objectives of Customer Perspective
Increase market share
Increase customer retention
Increase customer acquisition
Increase customer satisfaction
Increase customer profitability
3 Processes of Value Chain
Innovation Process
Operation Process
Post-sales Service Process
It defines the capabilities that an organization needs to create long-term growth and improvement
Learning and Growth Perspective
Three Major Objectives of Learning and Growth Perspective
Increase employee capabilities
Increase motivation, empowerment, and alignment
Increasing information systems capabilities
It is a diagram that describes how an organization creates value by connecting strategic objectives in explicit cause-and-effect relationships with each other in the financial, customer, internal business process, and learning and growth perspectives,
Strategy Map
It is a measure that expresses the efficient conversion of inputs into outputs
Productivity
Formula of Productivity
Output ÷ Input
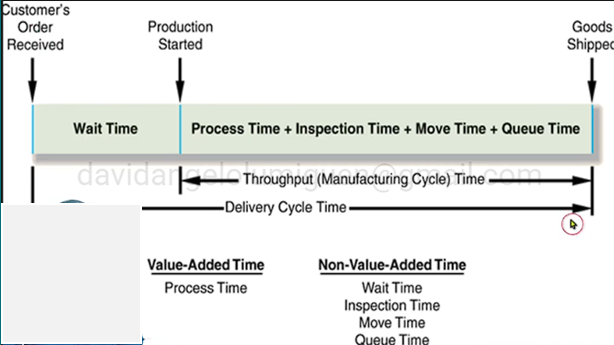
It is the total elapsed time between when an order is placed by a customer and when it is shipped to the customer
Delivery Cycle Time
It is the total elapsed time between when an order is started into production and when it is shipped to the customer
Throughput (Manufacturing Cycle) Time
Formula of Throughput Time
Process Time | xx |
Inspection Time | xx |
Move Time | xx |
Queue Time | xx |
Throughput Time | xx |
Value-Added Time
Process Time
It is the ratio of value-added time (i.e., process time) to total throughput time
Manufacturing Cycle Efficiency (MCE)
Formula of Manufacturing Cycle Efficiency (MCE)
Value-Added Time ÷ Throughput Time = Process Time ÷ Throughput Time
It is the number of units of output that can be produced in a given period of time
Velocity
Delivery Cycle Time Illustration
It quantifies the proportion of time dedicated to activities that directly contribute value to the final product or service activities that customers are willing to pay for
Process/Service Cycle Efficiency
Formula of Process/Service Cycle Efficiency
Value Added Time ÷ Cycle Time
It measures the change in operating income attributable solely to the change in the quantity of output sold
Growth Component
It measures change in output price compared with changes in input prices.
Price-Recovery Component
It measures the amount by which operating income increases by using inputs efficiently to lower costs
Productivity Component
It is the cost incurred in producing the product
Outlay Cost
It is the price representing the cash outflows of the supplying division plus contribution to the supplying division from an outside sale
Outlay Cost + Opportunity Cost
It is the price set by charging for variable costs plus a lump sum or an additional markup, but less that full markup
Variable Cost + Price
Successful implementation of a cost leadership strategy will result in:
Large favorable productivity and growth components
Successful implementation of a product differentiation strategy will result in:
Large favorable price-recovery and growth components
One of the results in using balanced scorecards is a shift from a focus on financial results to a focus on
increasing customer satisfaction
In the balanced scorecard, the financial perspective addresses which of the following questions?
“To succeed financially, how should we appear to our shareholders?”