10.6 representing variation graphically
1/5
There's no tags or description
Looks like no tags are added yet.
Name | Mastery | Learn | Test | Matching | Spaced |
|---|
No study sessions yet.
6 Terms
discontinuous variation
a characteristic that can only result in certain values
often variation determined purely by genetic factors
eg. sex, shape of bacteria, human blood groups
may be shown by a bar chart or pie chart
continuous variation
characteristic that can take any value within a range
there is a graduation between one extreme to another of a characteristic - this is known as a continuum
eg. height and mass
characteristics that show continuous variation are often controlled by many genes as well as environmental factors
data with continuous variation can be collected in a frequency table and plotted in a histrogram
normal distribution curve
the mean, mode and median are the same
the distribution has a characteristic ‘bell shape’ which is symmetrical around the mean
50% of values are less than the mean and 50% of values are over the mean
most values lie extremely close to the mean value - the number of individuals at the extremes is very low
standard deviation
a measure of how spread out the data is
the greater the standard deviation is, the greater the spread of data
in terms of variation, a characteristics which has a high standard of deviation has a large amount of variation
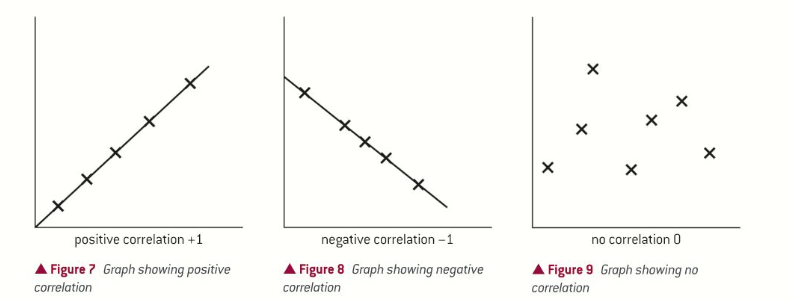
spearmans rank correlation coefficient
no correlation - no relationship between the data
positive correlation - as one set of data increases in value, the other set of data decreases in value
negative correlation - as one set of data increases in value - the other set of data decreases in value
students t test
used to compare the mean values of two sets of data
to use this test the data must be normally distributed and enough data must be collected to give a reliable mean