Psych 2220 Exam 3
1/34
There's no tags or description
Looks like no tags are added yet.
Name | Mastery | Learn | Test | Matching | Spaced |
|---|
No study sessions yet.
35 Terms
Effect Size
The extent of difference between means.
(e.g., observed mean & population mean)
• Alt: The extent to which participants' mean exceeded the value expected by chance (H0)
What factors influence power
Change alpha level
Increase sample size N.
Increase effect size (Cohen's d):
Switch to a one-tailed test (only if you're certain about the direction of difference!)
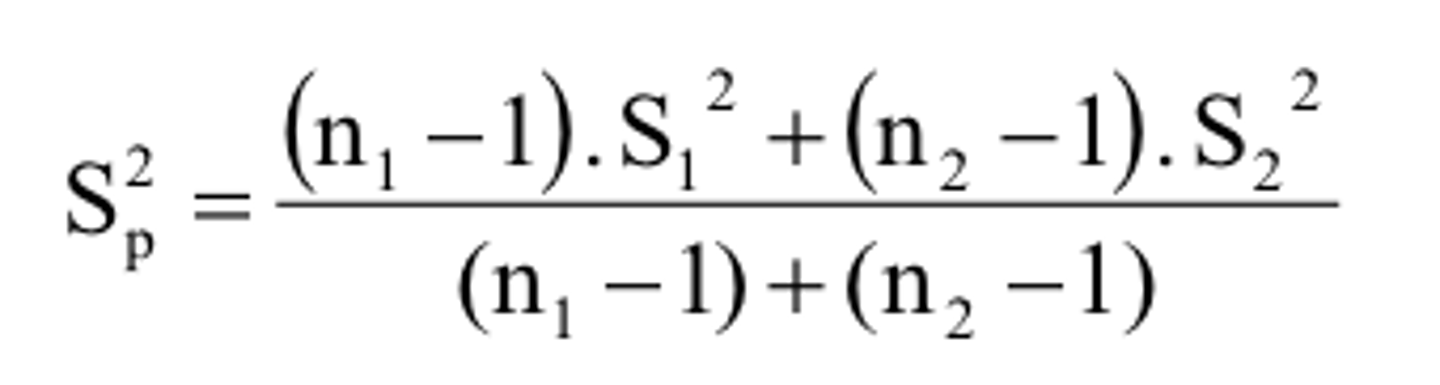
pooling variance for independent samples t test
ssquareda/N + ssquaredb/N
confidence interval formula one sample t test
Mupper= M+tcrit*Sm
Mlower=M-tcrit*Sm
Mlower<----M---->Mupper
confidence interval formula paired samples t test
Mupper=Md+tcrit*Sm
Mlower=Md-tcrit*Sm
Mlower<----M---->Mupper
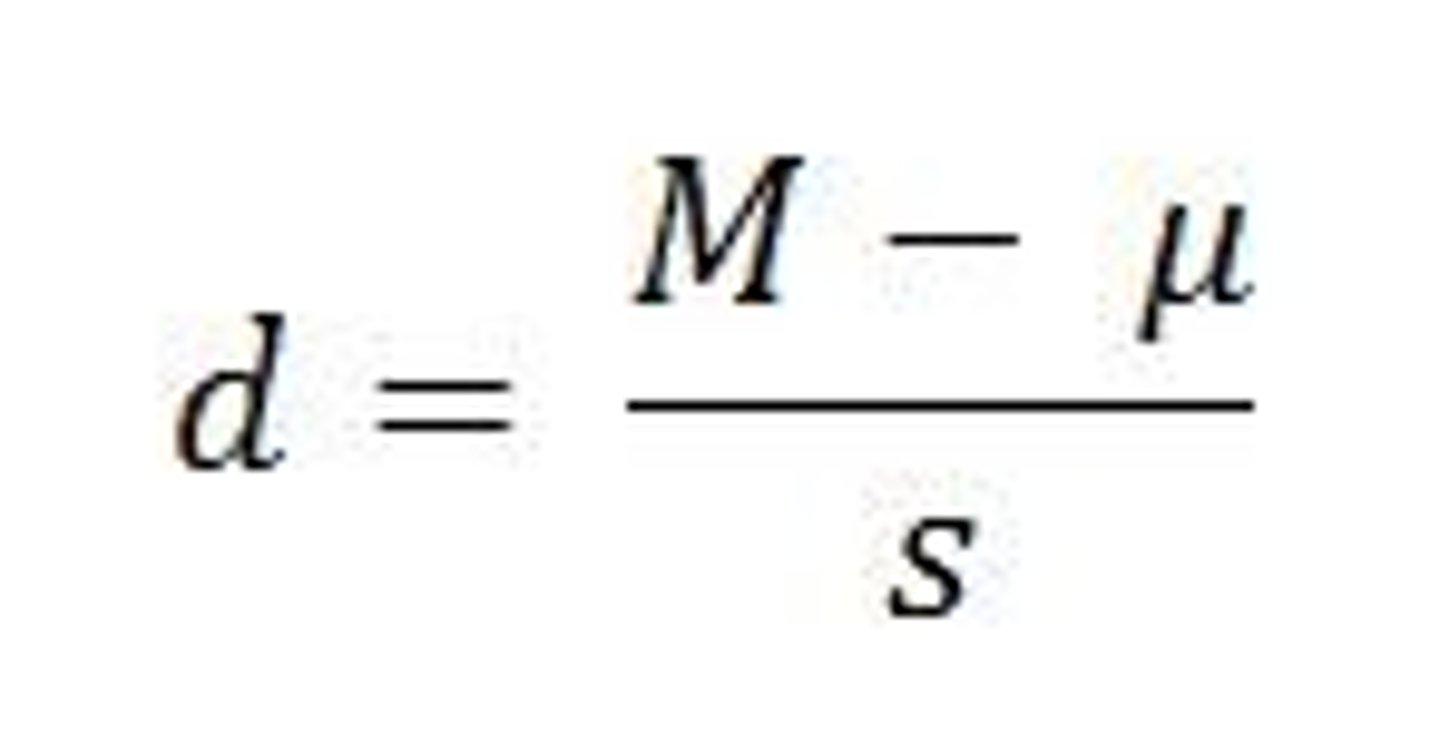
effect size formula one sample t-test
dhat=M-mu/s
effect size formula paired samples t test
dhat=(M1-M2)-0/Sd
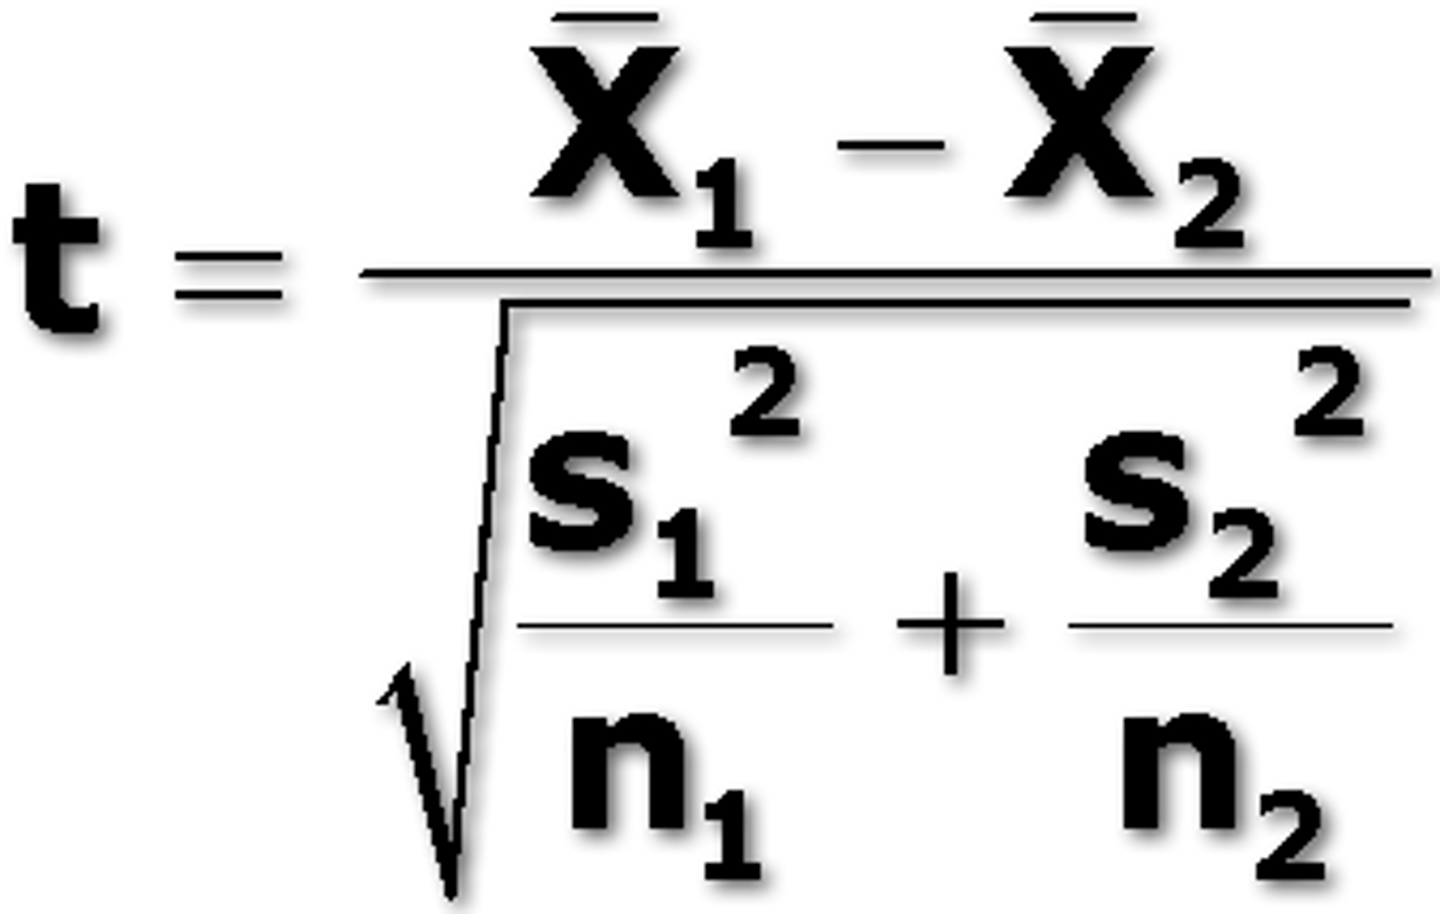
effect size formula independent samples t test
dhat=M1-M2/Spooled
Type 1 Error
false positive
Type 2 Error
false negative
independent samples t test
compares an observed sample mean (MA) to another observed sample mean (MB). If the samples are actually independent, then the scores vary independently of each other.
These are "unrelated" samples or non-paired samples.
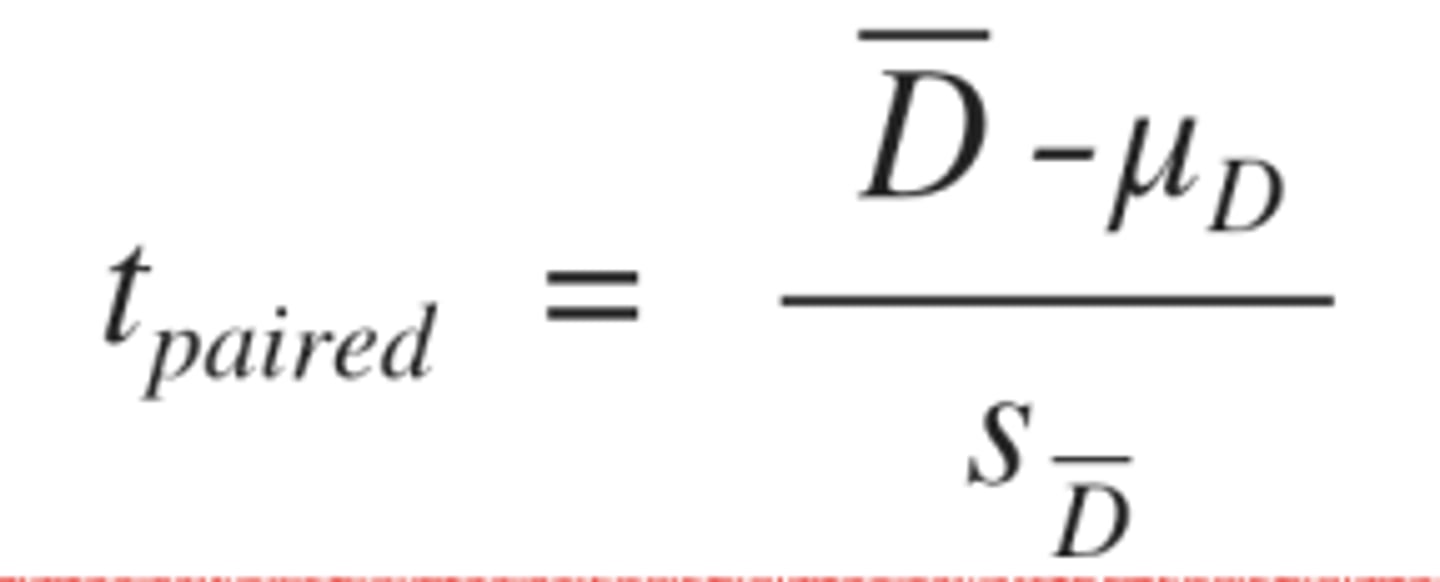
paired samples t test
It represents a single observed mean
difference between two related observations, in terms of its distance from the center of the sampling distribution of the mean difference, as estimated by the observed sample standard deviation of differences sD
one sample t statistic
a test statistic that
expresses the distance between a sample mean M
and some suspected population mean μ, scaled to an
inferentially valuable indication of variability: standard
error of the mean (sM).
ANOVA
"ANalysis Of VAriance"
pooled variance
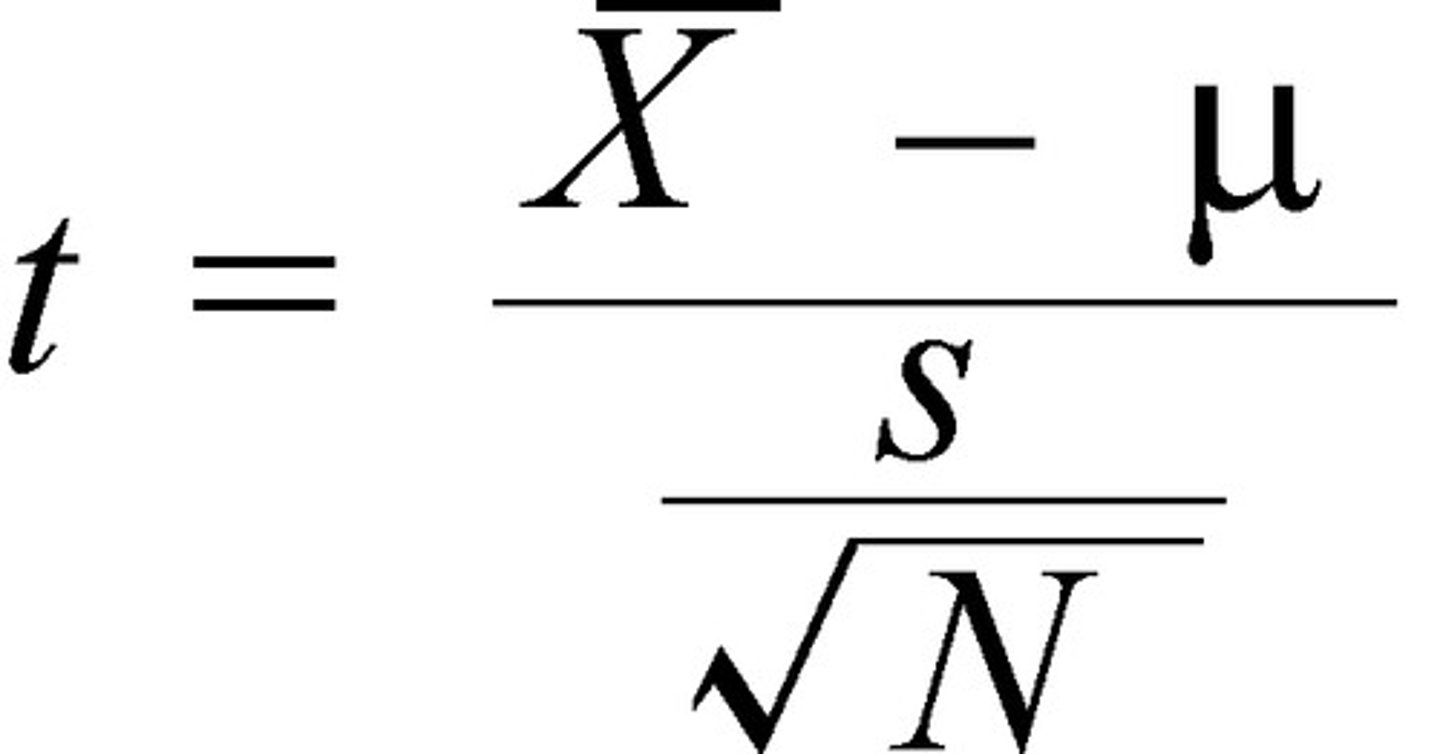
Formula for one sample t test
Formula for paired samples t test
Formula for independent samples t test
standard deviation, s,
We don't know σ, so we need to estimate it somehow.
We'll use the sample's __________ as our
best point estimate of σ.
one sample t test
The hypothesis test we perform to
determine whether we should reject a null hypothesis
about μ.
Follows the same approach as the z test
degrees of freedom for one sample t test
df: N - 1
degrees of freedom for independent samples t test
dftotal = (n1 - 1) + (n2 - 1) = n1 + n2 - 2
Hypothesis' examples for one sample t tests
Do psychology majors' GPAs differ from the OSU average?
• Are students favorable toward the new OSU president?
(Significantly more positive than a hypothesized population
average that reflects "neutral" or "no opinion")
one sample t test
It represents a single observed mean
in terms of its distance from the center of the sampling
distribution of the mean, as estimated by the observed
sample standard deviation s.
paired samples t test
a design in which two
observations covary (i.e., are related to each other),
and the difference between observations is the focal
dependent measure
examples of paired samples t tests
Most common: Same people, measured twice (two conditions or
different times)
• Less common but equally valid: Different people bound by a clear one-to-one relationship (spouses, siblings, interaction partners, etc.), or even unrelated people matched on some extra variable that correlates with the DV.
• Measure depression, then give CBT, then measure depression.
• Measure parent's intent to quit smoking BEFORE and AFTER an educational intervention presenting their child's biochemical SHS exposure data to the parent.
order effects
Taking one observation can affect later
observations recorded from same individuals.
example of independent samples t test
Suppose you're interested in testing a claim that psychology majors perform logic problems better than chemistry majors.
independent samples
(two) sets of observations that
cannot be assumed to share variance on an individual
level. That is, the observations are unrelated across
groups; a test of mean
differences between two unrelated groups of scores.
one sample t test
Compare a sample's mean score to a population
paired samples t test
Compare a mean difference to the population of differences.
independent samples t test
Compare a difference between two sample means to the population of differences between means.
F statistics
compare the observed variance based on a set of means to the expected variance of all the individually sampled observations.
F statistic Formula
F=Ssquared observed/Ssquared expected
standard error
s/squareroot(N)