BUSN 3000 Exam #3
1/58
There's no tags or description
Looks like no tags are added yet.
Name | Mastery | Learn | Test | Matching | Spaced |
|---|
No study sessions yet.
59 Terms
Two Sample T-test = TWO INDEPENDENT
A random sample of 50 conservative and 58 aggressive funds looked at their average annual return rates over the past 10 years.
Paired T-test = TWO RELATED
Do 5-year fund investments result in greater returns than 3-year investments? 77 funds were randomly chosen and for each fund, the 5-year return was recorded as well as its 3-year return. Comparing 2 related measurements for the same fund
One Sample T-test
A cereal company claims that their cereal contains an average of 12 grams of sugar per serving. A health organization randomly samples 30 boxes and finds a mean sugar content of 11.5 grams.
One Proportion Z-test
A tech company claims that 80% of users are satisfied with their service. A survey of 200 customers shows that only 150 say they are satisfied.
No, since 0 is contained inside the interval, there is insufficient evidence the average returns are different.
A 99% confidence interval was found to be (-2.8%, 6%). Can we claim a difference in the average 10 year returns?
Yes, since 0 is not contained inside the interval, there is sufficient evidence that the average returns are different.
A 99% confidence interval was found to be (1.2%, 7.5%). Can we claim a difference in the average 10-year returns?
No, there is insufficient evidence the average 5-year returns are greater, because the p-value (0.088) > α (0.05).
The p-value was found to be 0.088. For 𝛼 = 0.05, do 5-year investments provide greater returns, on average, than 3-year returns?
Reject H₀: There is sufficient evidence the average delivery time for Company A vs. Company B is different. ZERO IS IN THE INTERVAL = REJECT
At the end of the month, a 95% confidence interval for the average difference in delivery times was found to be (1.73, 5.41) days. What is the appropriate conclusion to the above hypothesis test?
Yes, it is statistically valid to claim the difference in delivery times is caused by which company does the delivery.
Regardless of the (randomized) confidence interval above... suppose the furniture company found a difference which was statistically significant: could they claim the cause of the difference in delivery times is due to which company does the delivery?
Paired Design
All selected workers experience both treatments: working with exercise breaks for one month and working out without exercise breaks for one month. The order of the treatments is randomized. Workers are asked to rate their sense of well-being at the end of each month.
Two Independent Sample Design
Selected workers are randomly assigned into two groups: one group is instructed to take exercise breaks during the work day; the other groups continues working without exercise breaks as usual. At the end of the study, both groups are asked to rate their sense of well-being.
Paired Design, because it controls for person-to-person variability in well-being ratings.
If exercise breaks really do improve a worker's sense of well-being, which of these designs would you expect to provide stronger evidence of that effect? Two Independent or Paired?
Yes (niche)
Can the company generalize results of the study to all employees at this accounting firm?
No (too broad)
Can the company generalize results of the study to all American accountants?
Yes
Can the company claim the cause of the increase in job satisfaction level is due to whether or not the employees take exercise breaks?
Two Sample T-test
Which type of test should be done to determine if the average male income is different than for women?
Fit by x → income (y) gender (x) → Means/Anova → T-test → “difference”
What is the average difference in income (USE JMP) between males and females, for this sample?
“t Ratio”
What is the test statistic?
“Prob > [t]”
The P-value to test if the average male income is different than that for women?
If p-val is greater than 0.05 NO
If p-val is less than 0.05 YES=different
For 𝛼 = 0.05, is there evidence that males and females get paid differently?
If H0 was rejected, 0 is outside
if H0 was not rejected, 0 is inside
Based on the above conclusion, would you predict 0 is inside or outside the 95% confidence interval?
t-test → (Lower CL dif, Upper CL dif)
Give the boundaries of the 95% confidence interval
H0: p1 = p2 = p3 = p4 = p5 = p6 = 1/6, implying the dice are fair
You suspect one of the employees in a casino is using loaded dice. You observe them rolling the dice 78 times and record the following results: Which hypotheses should be used to test if the dice are unfair? IDENTIFY H0
Ha: at least one p ≠ 1/6, implying the dice are unfair (Ha IS WHERE YOU’RE LOOKING FOR EVIDENCE)
You suspect one of the employees in a casino is using loaded dice. You observe them rolling the dice 78 times and record the following results: Which hypotheses should be used to test if the dice are unfair? IDENTIFY Ha
Add up all the values, divide by the count. Just like finding the average
What is the Expected count for each side, for these 78 rolls?
Yes, because the Expected count is at least 5 for every category. (each expected count must be ≥ 5 in all categories)
Is the sample size large enough?
If the test statistic is small, the observed values are close to the expected → supports H₀
If the test statistic is large, the observed values are far from the expected → H₀ might be false
Suppose you got a relatively large test statistic. What would this imply?
2nd → VARS → χ²cdf(17.08, 1E99, 5)
lower=17.08, upper is infinity, DF is 5 because this is a chi-test
The test statistic is 𝜒2 = 17.08. What is the p-value?
H0= the complicated one with the equations
Ha= at least one (this SUPPORTS claim)
Which hypotheses should be tested to determine if the ethnic make-up of the police force is consistent with the city's population?
Negative= fewer than expected
Positive = more than expected
The residual for the African-American category is -1.294. What does the negative sign imply?
χ²cdf(6.955, 1E99, 4)
5-1 = Df = 4
The test statistic is 6.955. What is the p-value?
Chi-squared goodness-of-fit test
comparing observed categorical data to expected proportions
Which colors should car manufacturers use? In 2018, white and black cars accounted for nearly half of all new car sales: 20% of cars sold were black and 25% were white; the remaining 55% were a mixture of other colors.
Perhaps this has changed in recent years. In 2023, a random sample of 1,000 new cars yielded the data in the Colors D JMP file. (Note: this data set is randomized, you should download different versions on subsequent tries.)
(a) Which type of test should the researchers use?
Analyze → Distribution → color (y) → test probabilities → input the values
Find test stat on JMP
The conditional expectation E(Y|X)
What does the linear regression model predict for a given value of X?
The predicted or expected value of Y for a given X
Which of the following best describes 𝛽0+𝛽1X in a regression model?
To avoid canceling out positive and negative errors
Why do we use squared errors when calculating the best-fitting line in regression?
Response variable: number of pizzas sold
Explanatory variable": average pizza price
Using historical sales data from the past 3 years, a pizza delivery chain fitted a linear model to predict the weekly number of pizzas sold in a certain city, based on the average pizza price ($):
For each $1 increase in average price, the average number of pizzas sold is predicted to decrease by 132.
Intercept the slope
The intercept is not meaningful because the price will not be 0.
Is the intercept meaningful in this context and if so, what does it tell us?
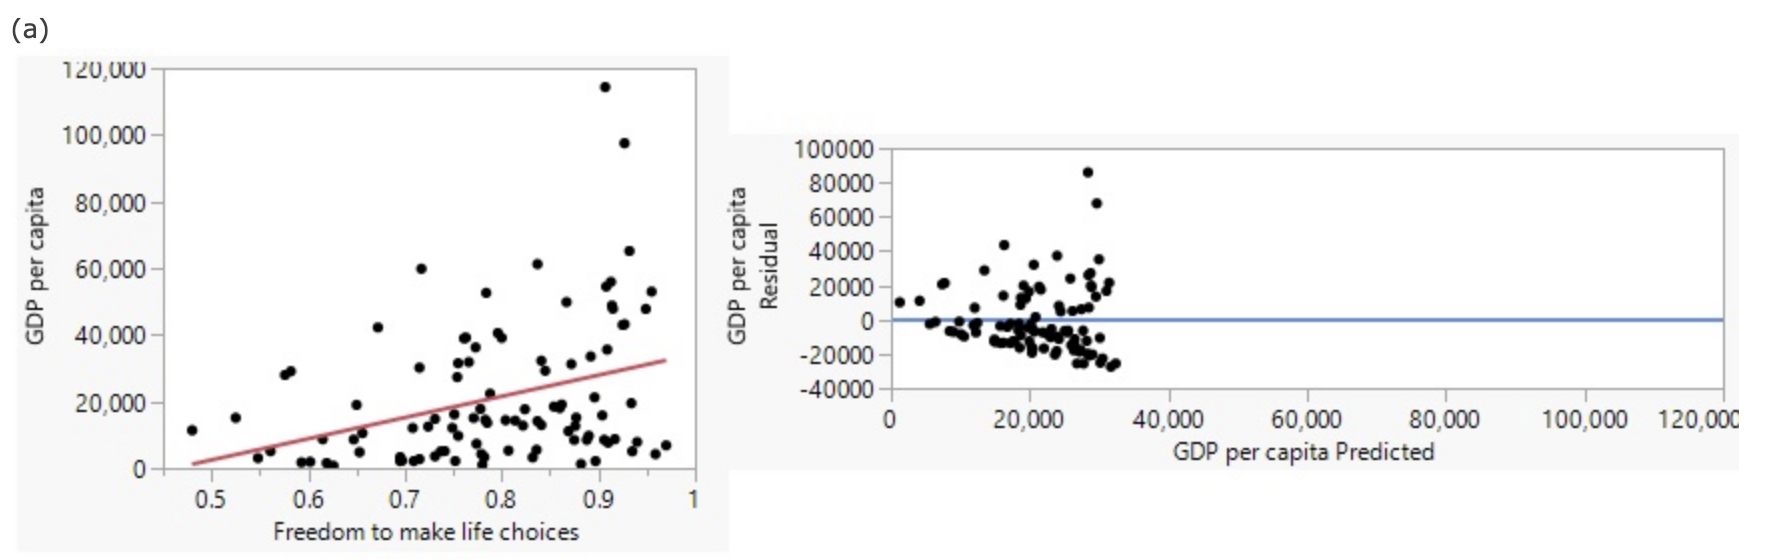
The fanned pattern indicates the current model is not appropriate (the constant variance condition is not met). The errors become larger as X and Y increase.
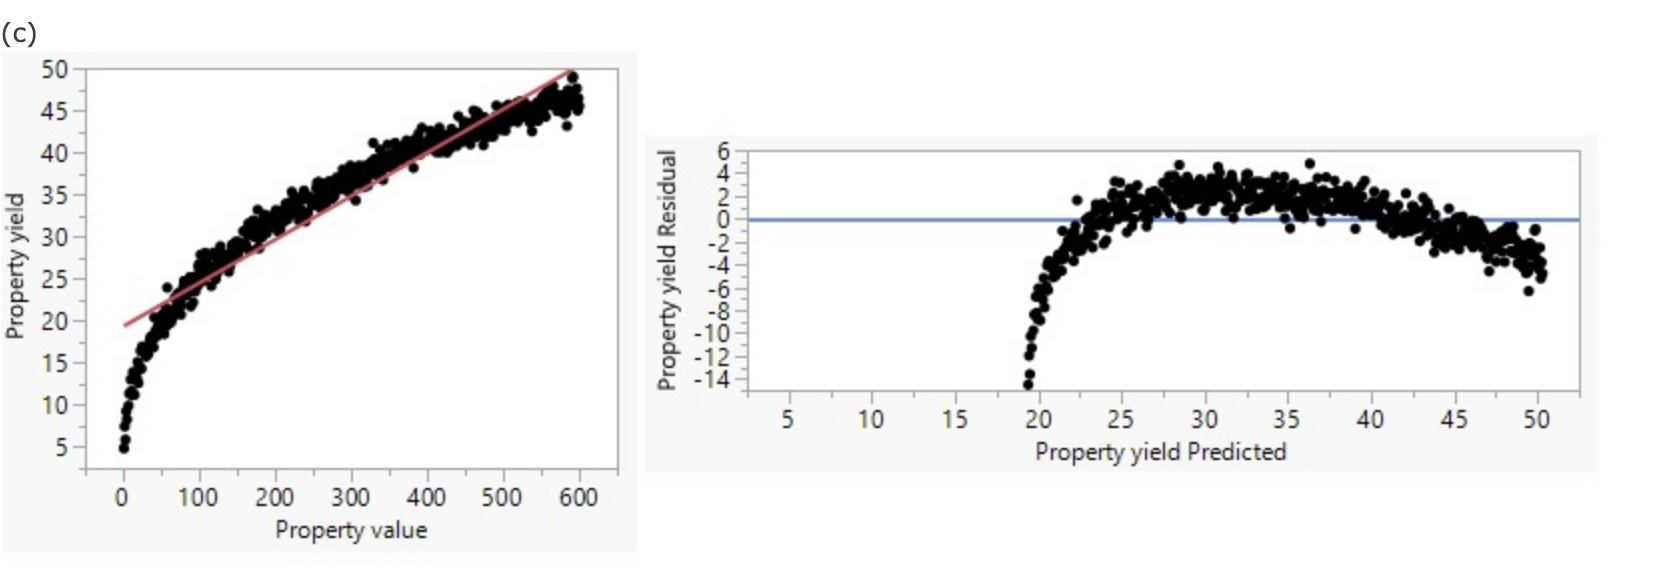
The curved pattern indicates that a nonlinear model would give better results than a linear model (the linearity condition is not met).
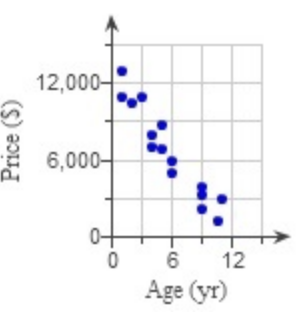
It’s strong, so it’s negative
A car buyer was interested in how the age of a car affected its price, so she took a random sample of cars advertised by an online dealer and recorded their price as well as age.
R2 = 0.814
Square root R2. If R2 is strong (.814 for exmaple), then the answer is negative
What is the correlation?
Use R2
How good is the Age of a car in predicting its Price?
Other factors such as the condition of the car and mileage also contribute to the price of a used car
Why doesn't Age account for 100% of the variation in Price?
Fit Y by X → fit line → equation is displayed on bottom
Find regression equation
No: This is an observational study, which does not address the issue of what causes higher sales
Based on this model, should companies conclude that hiring more employees will cause higher sales?
This model should not be used to predict the sales for a company with 15,000 employees.
What value of Sales does this model predict for a company with 15,000 employees?
Correlation= SAME
R2= SAME
Slope= CHANGE
Suppose the units were changed and total sales values were given in dollars instead of millions of dollars:
Correlation= DECR
R2= DECR
Slope= DECR
Suppose a new company were added to the data set. This company only employs 1,000 people yet it produces $2,500 million in sales. How would this affect the following values?
DNE
DE
invT 0.995
99%
invT 0.975
95%
Since the p-value for the F-test < 0.05, there is sufficient evidence that at least one variable is useful.
What is the conclusion to the above hypothesis test?
Yes, multicollinearity is a problem because the F-test indicates at least one variable is useful, but none of the individual variables have significant p-values.
Is multicollinearity a problem for this model?
Too similar
Why were so many variables removed in the preceding steps?
Linear and constant variance
The Fit Model function produces a Residual by Predicted Plot. Which of the conditions for inference can be evaluated using this plot?
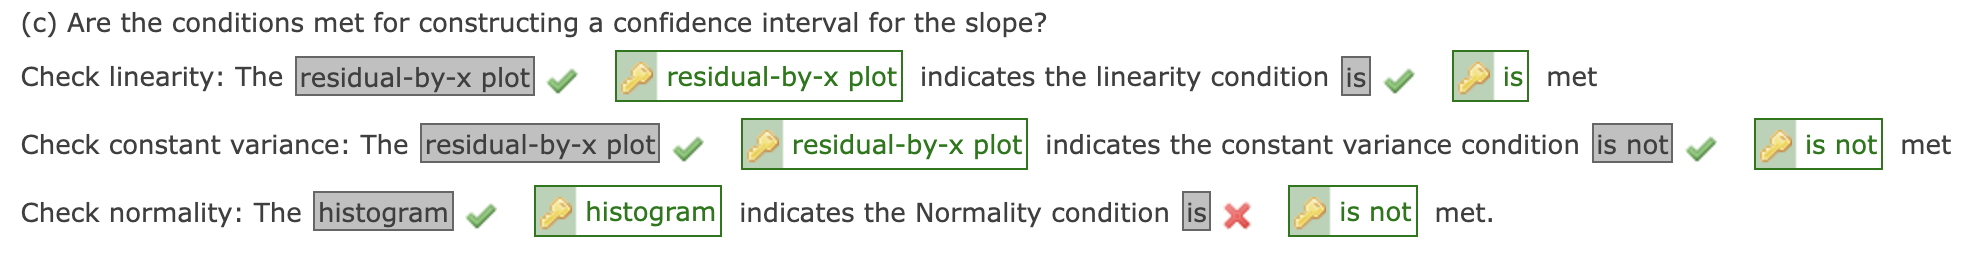
The residual-by-x plot does not show a curved shape, so the linearity condition is met. It shows a fan shape, however, indicating the constant variance condition is not met. The histogram shows a uniform rather than Normal (bell) shape, indicating the Normality condition is not met.
invT (.975, 13 (-2 for DF)) * Std error for sq ft +- estimate = (x,y)
Find intervals for 95%