Geographical Concepts and Mapping Techniques
1/49
There's no tags or description
Looks like no tags are added yet.
Name | Mastery | Learn | Test | Matching | Spaced |
|---|
No study sessions yet.
50 Terms
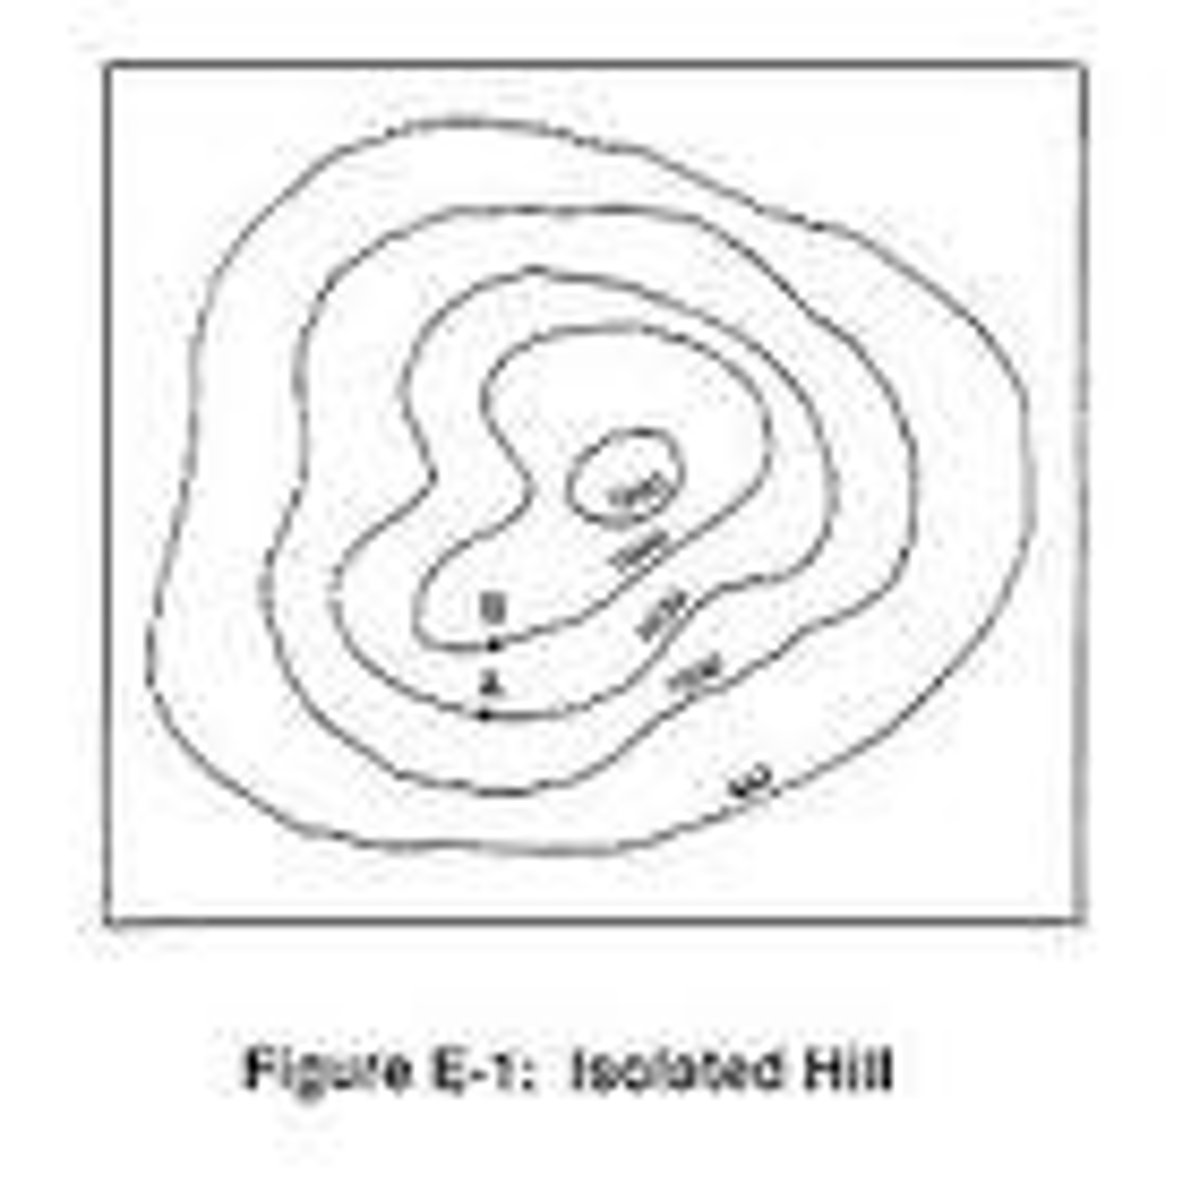
Topographic Map: Contour Lines
Close lines = steep slope; wide lines = gentle slope.
Topographic Map: Gradient
Gradient = Vertical Height ÷ Horizontal Distance.
Topographic Map: Aspect
Aspect = The direction a slope faces (e.g. North).
Topographic Map: Bearing
Bearing = Angle measured clockwise from North using a protractor.
Topographic Map: Local Relief
Local Relief = Difference between highest and lowest points in an area.
Topographic Map: Scale
Scale tells the ratio between map distance and real distance (e.g. 1:50,000).
Latitude
Horizontal lines (Equator = 0°). Measure distance north/south of Equator.
Longitude
Vertical lines (Prime Meridian = 0°). Measure distance east/west of Prime Meridian.
Latitude & Longitude Coordinates
Written as (Latitude, Longitude).
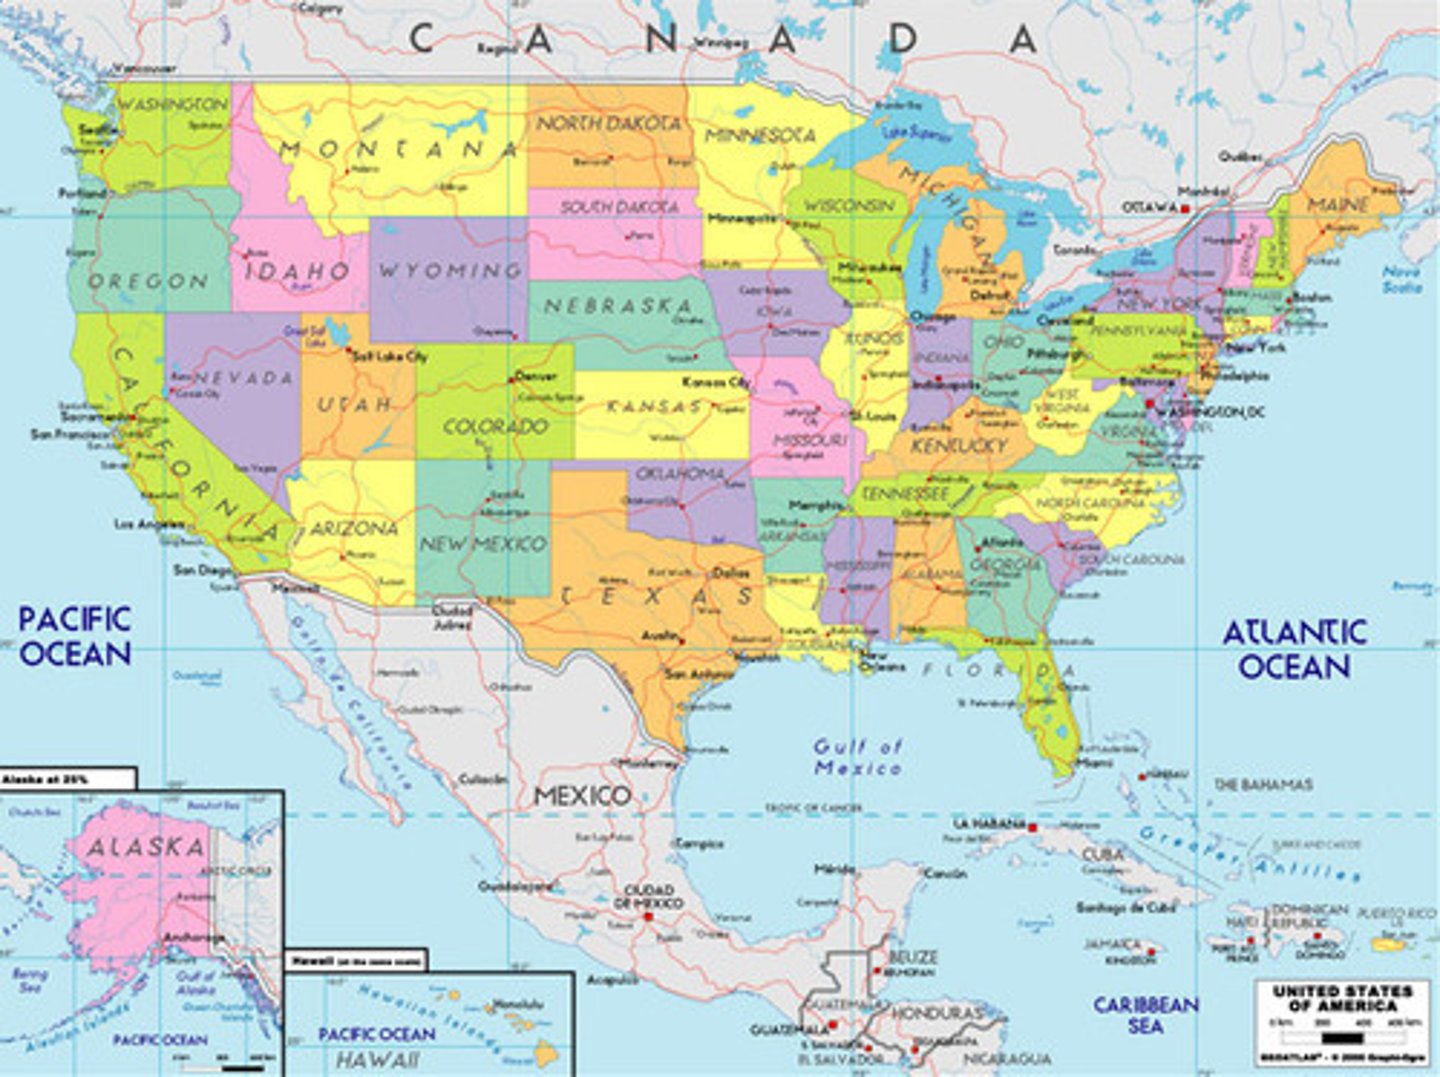
Political Map
Map showing countries, borders, or cities.
Topographic Map
Map showing elevation and physical features using contour lines.
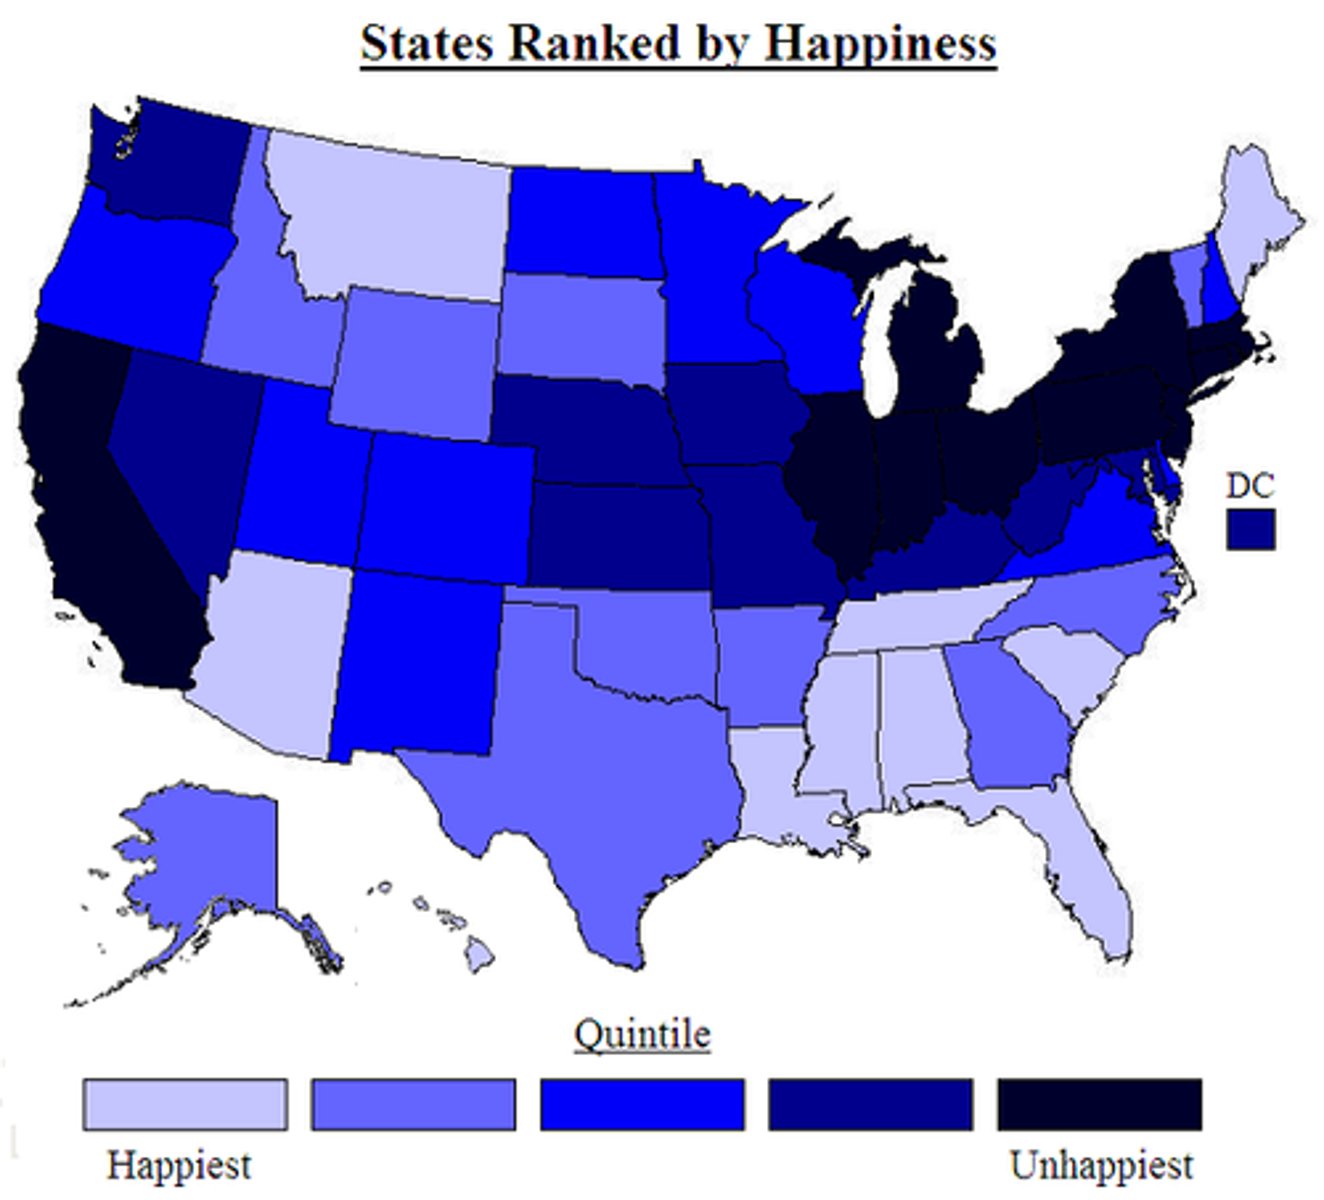
Choropleth Map
Map that uses colours/shading to represent data (e.g. population density).
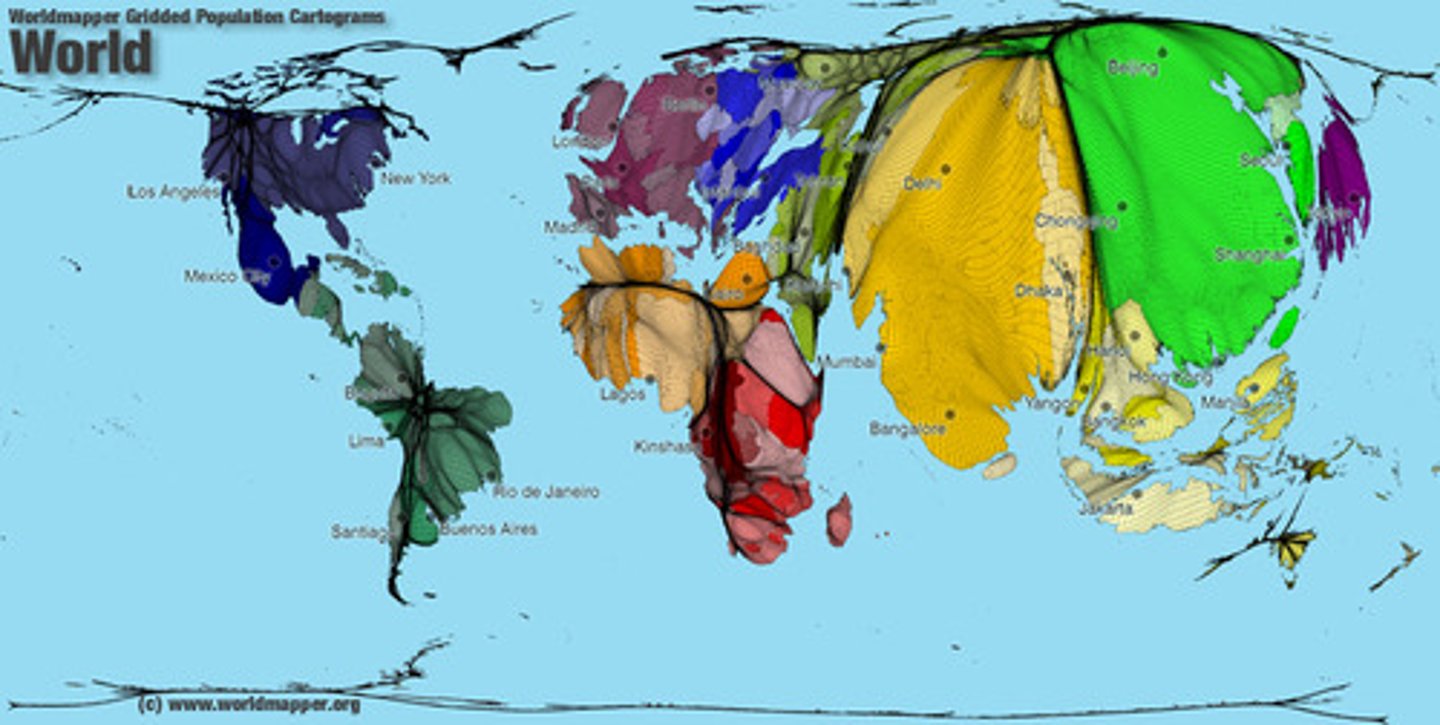
Cartogram
Map where area size is distorted to represent data (e.g. GDP).
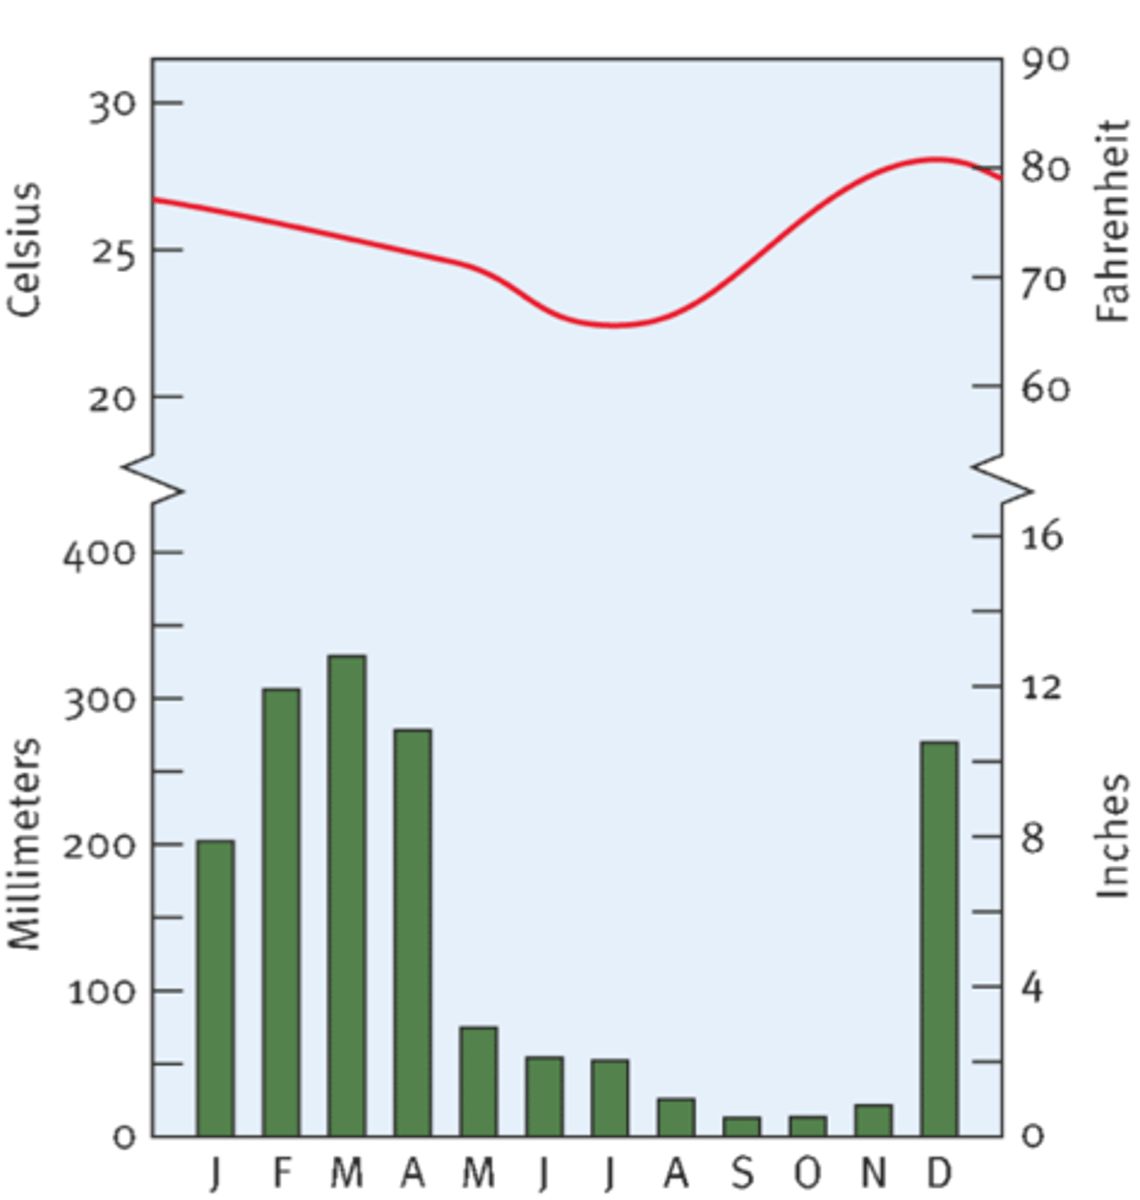
Climate Graph
Shows average monthly temperature (line) and rainfall (bars).
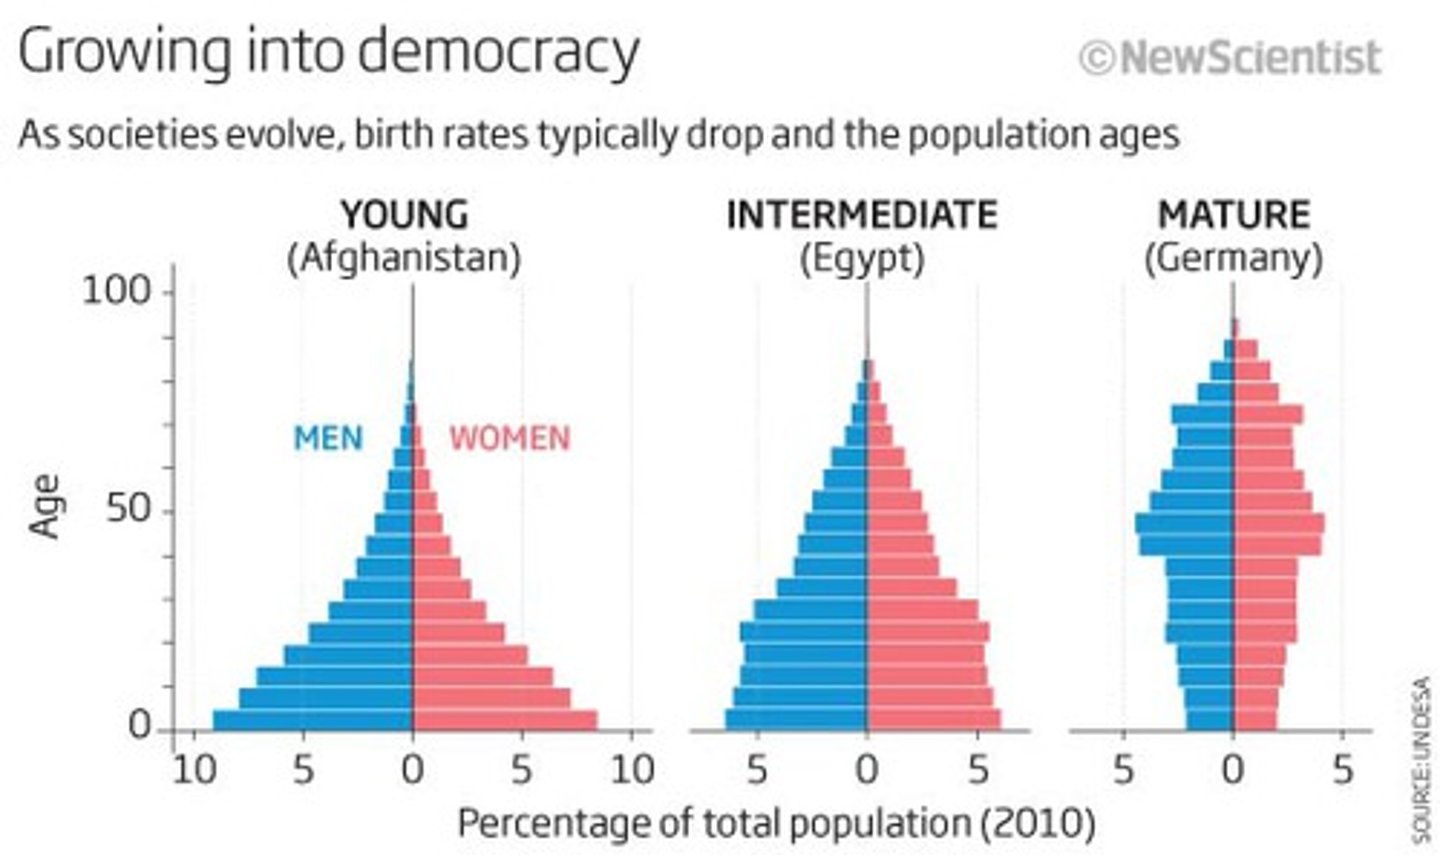
Population Pyramid
Graph showing age and sex distribution of a population.
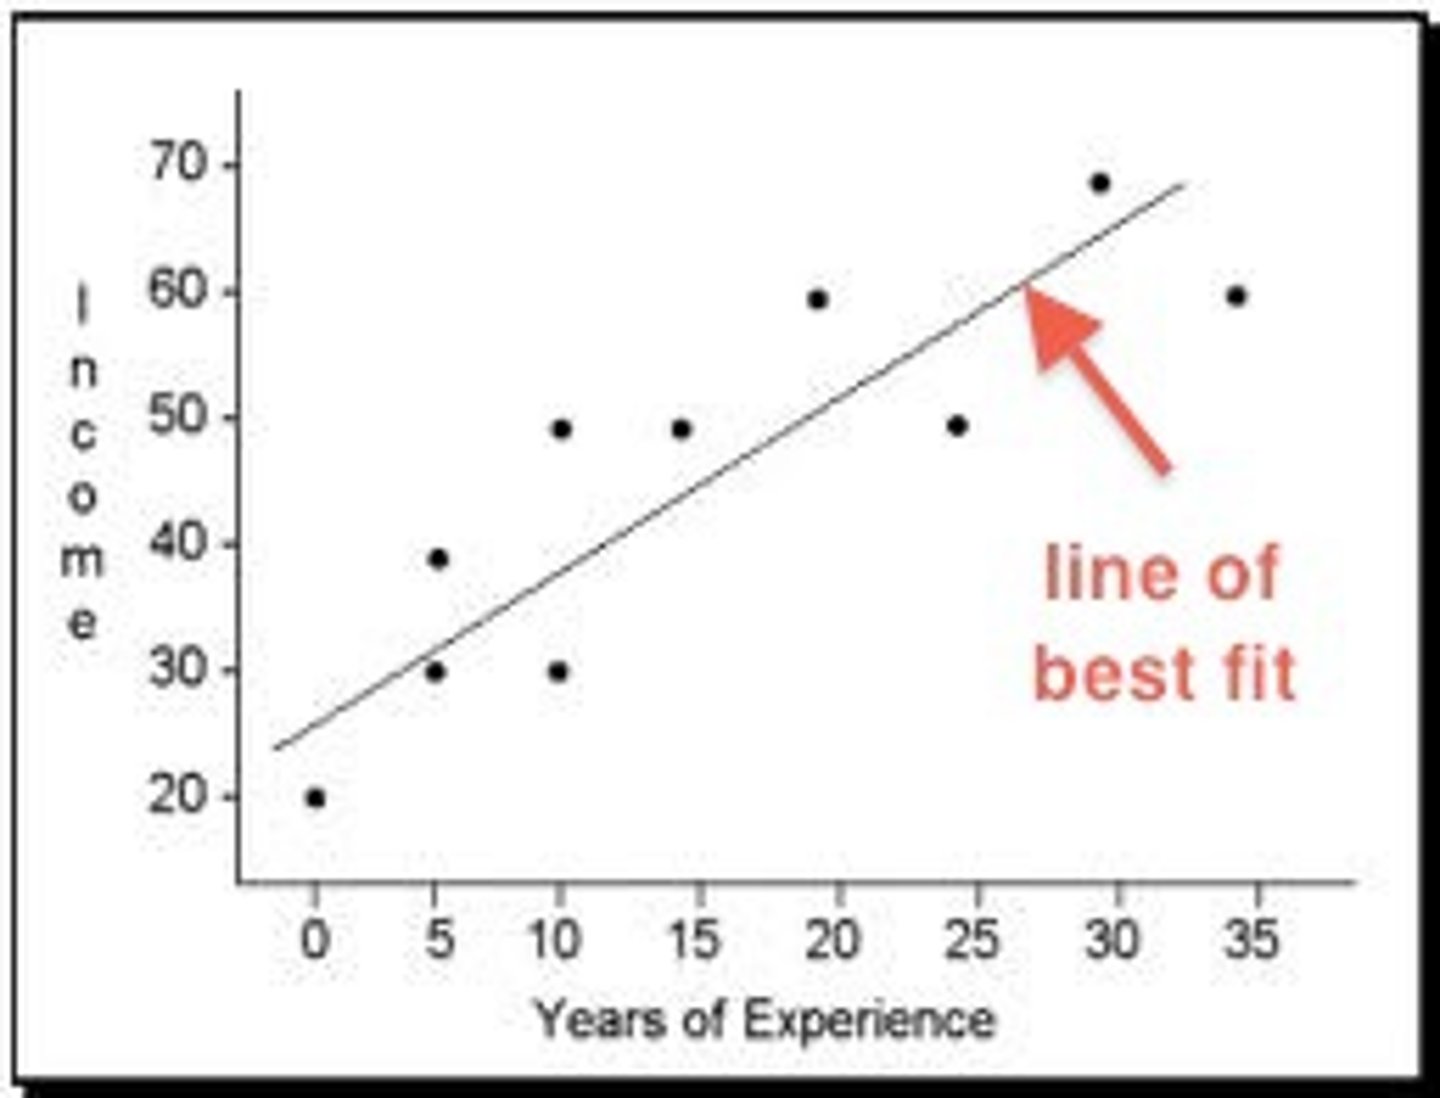
Scatter Plot
Graph showing the relationship between two variables (e.g. income vs literacy).
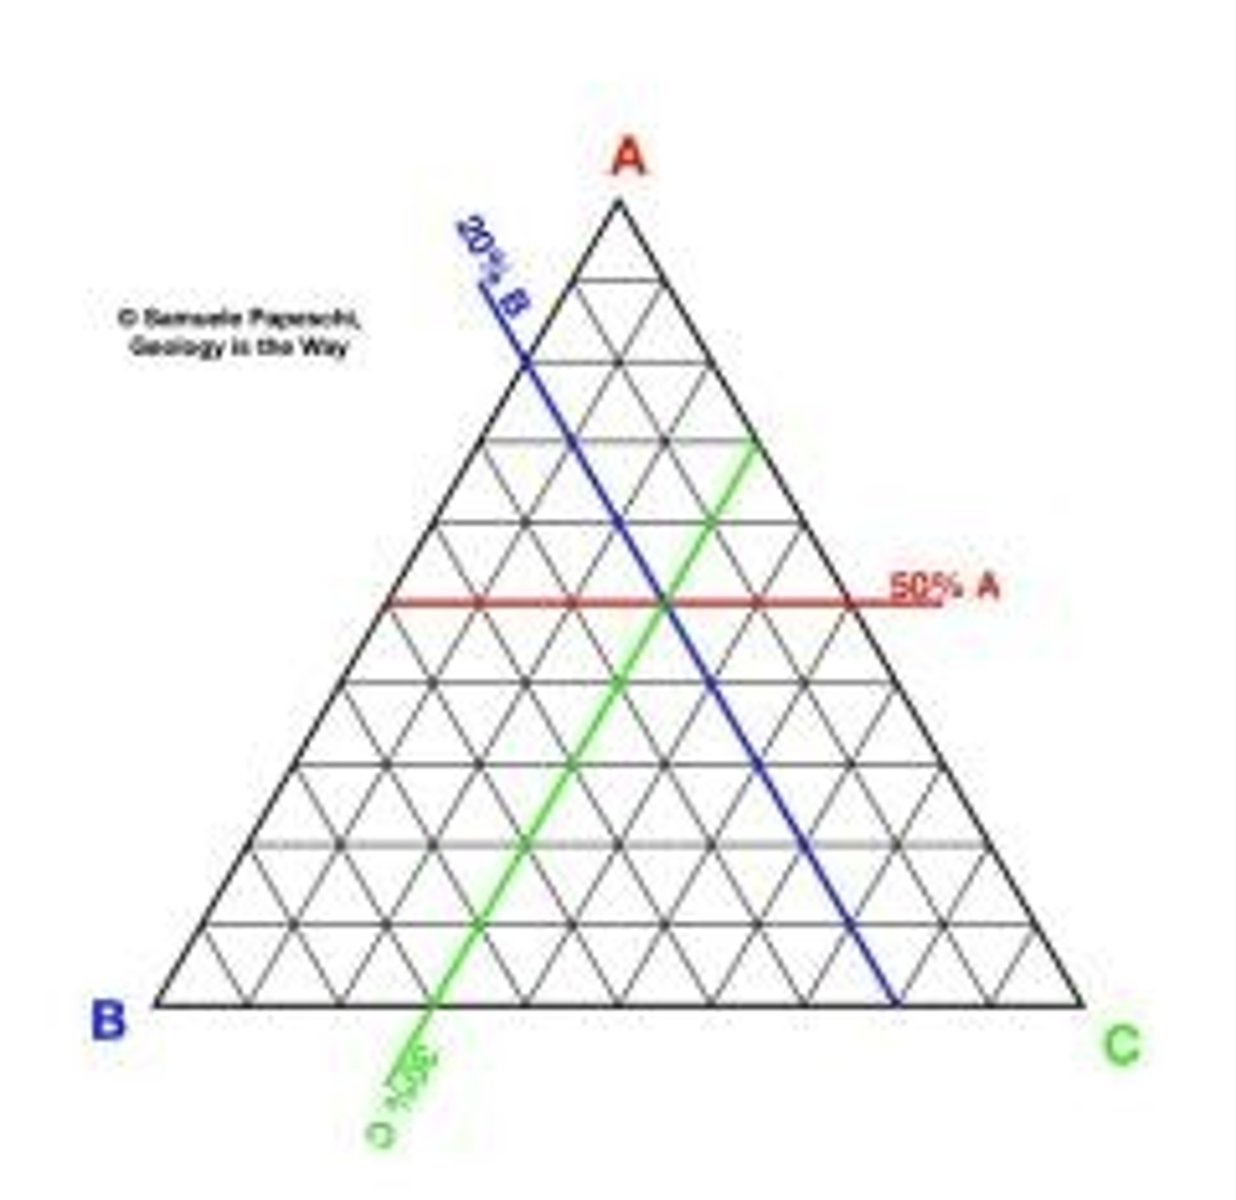
Ternary Graph
Triangle graph showing 3 variables that add up to 100%.
Visual Representations
Images, cartoons, or infographics used to show information visually.
Four Spheres
Biosphere (life), Lithosphere (land), Atmosphere (air), Hydrosphere (water).
Biophysical Interactions
Interactions between the four spheres (e.g. deforestation affects all spheres).
Human Impact on Environment
Human actions change natural systems (e.g. pollution, deforestation, climate change).
Plastic Pollution: Case Study
Lord Howe Island: Plastic causes internal injuries in flesh-footed shearwater birds.
Climate Change: Causes
Increased greenhouse gases from fossil fuels, deforestation, agriculture.
Climate Change: Consequences
Rising sea levels, extreme weather, biodiversity loss.
Scales of Change
Local, national, and global impacts and responses.
HDI (Human Development Index)
Measures health, education, and income (0-1 score).
GDP
Gross Domestic Product = total value of goods/services produced in a country.
Happy Planet Index
Measures sustainable wellbeing (life expectancy + happiness ÷ ecological footprint).
OECD Better Life Index
Measures quality of life (jobs, income, health, education, etc.).
Bhutan's Happiness Index
Focuses on spiritual, emotional, and environmental wellbeing over economic growth.
Brandt Line
Divides 'Global North' (developed) and 'Global South' (developing) based on wealth.
Claymore, Western Sydney
Case study on inequality: low income, education disadvantage, health issues.
Opportunity Line
Line below which people lack access to opportunities (e.g. housing, education, jobs).
Demographic Transition Model
Shows how population changes through 5 stages of development.
SHEEPT
Social, Historical, Environmental, Economic, Political, Technological - factors affecting wellbeing.
MDGs (Millennium Development Goals)
8 global goals set by UN to improve life (2000-2015).
SDGs (Sustainable Development Goals)
17 global goals set by UN to reduce inequality and protect the planet by 2030.
UNDP
United Nations Development Programme - works to improve global wellbeing and reduce inequality.
What is the human impact seen in Claymore, Western Sydney?
High levels of poverty, unemployment, and poor access to education and health services, creating local spatial inequality.
What is the key concept demonstrated by the Claymore case study?
Living below the "Opportunity Line," showing how location and disadvantage affect human wellbeing in Australia.
Why is the Claymore case study important in Geography?
It shows how human systems and inequality affect wellbeing, and how targeted local responses are needed to improve conditions.
What is the human cause of climate change?
Human activities like burning fossil fuels, agriculture, and deforestation produce greenhouse gases that warm the planet.
What are the impacts of climate change globally?
Sea level rise, extreme weather events, biodiversity loss, melting glaciers, and threats to low-lying nations.
Why is climate change a human impact case study?
Because human actions are directly causing large-scale environmental change, affecting both people and ecosystems worldwide.
What is the environmental issue on Lord Howe Island?
Plastic pollution in the ocean is being ingested by seabirds like the Flesh-footed Shearwater, causing injury and death.
What is the cause of plastic pollution on Lord Howe Island?
Plastic waste from human activity enters marine ecosystems, showing how careless disposal impacts remote environments.
Why is Lord Howe Island a key environmental case study?
It shows human damage to a natural ecosystem and highlights the need for better waste management and environmental protection.
What is happening to the Amazon Rainforest?
Deforestation for logging, farming, and mining is destroying biodiversity and disrupting ecosystems.
Why is deforestation in the Amazon an environmental issue?
It leads to habitat loss, climate disruption, soil erosion, and loss of Indigenous land — all caused by human land use.
How does the Amazon Rainforest case link to Geography outcomes?
It shows environmental change on a large scale and highlights the need for global management and conservation efforts.