Purdue STAT 301 Exam 1
1/74
There's no tags or description
Looks like no tags are added yet.
Name | Mastery | Learn | Test | Matching | Spaced | Call with Kai |
|---|
No analytics yet
Send a link to your students to track their progress
75 Terms
Categorical variable
a variable that is described in WORDS (ex: eye color)
Quantitative variable
a variable that is described in NUMBERS (ex: weight)
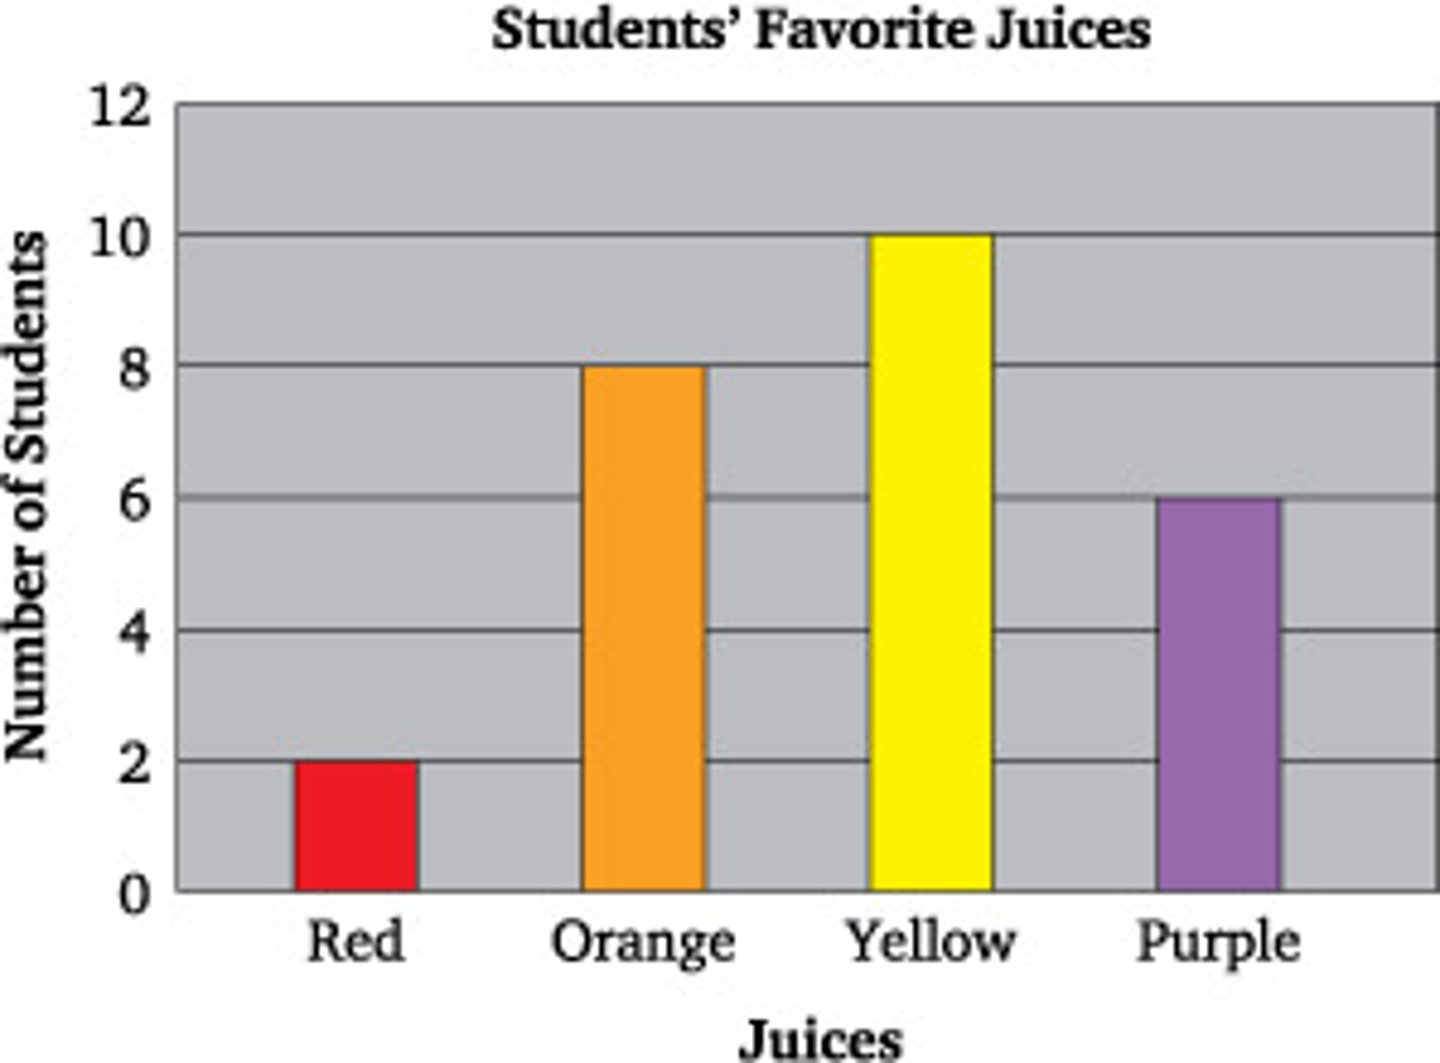
Bar graphs are used for
categorical data
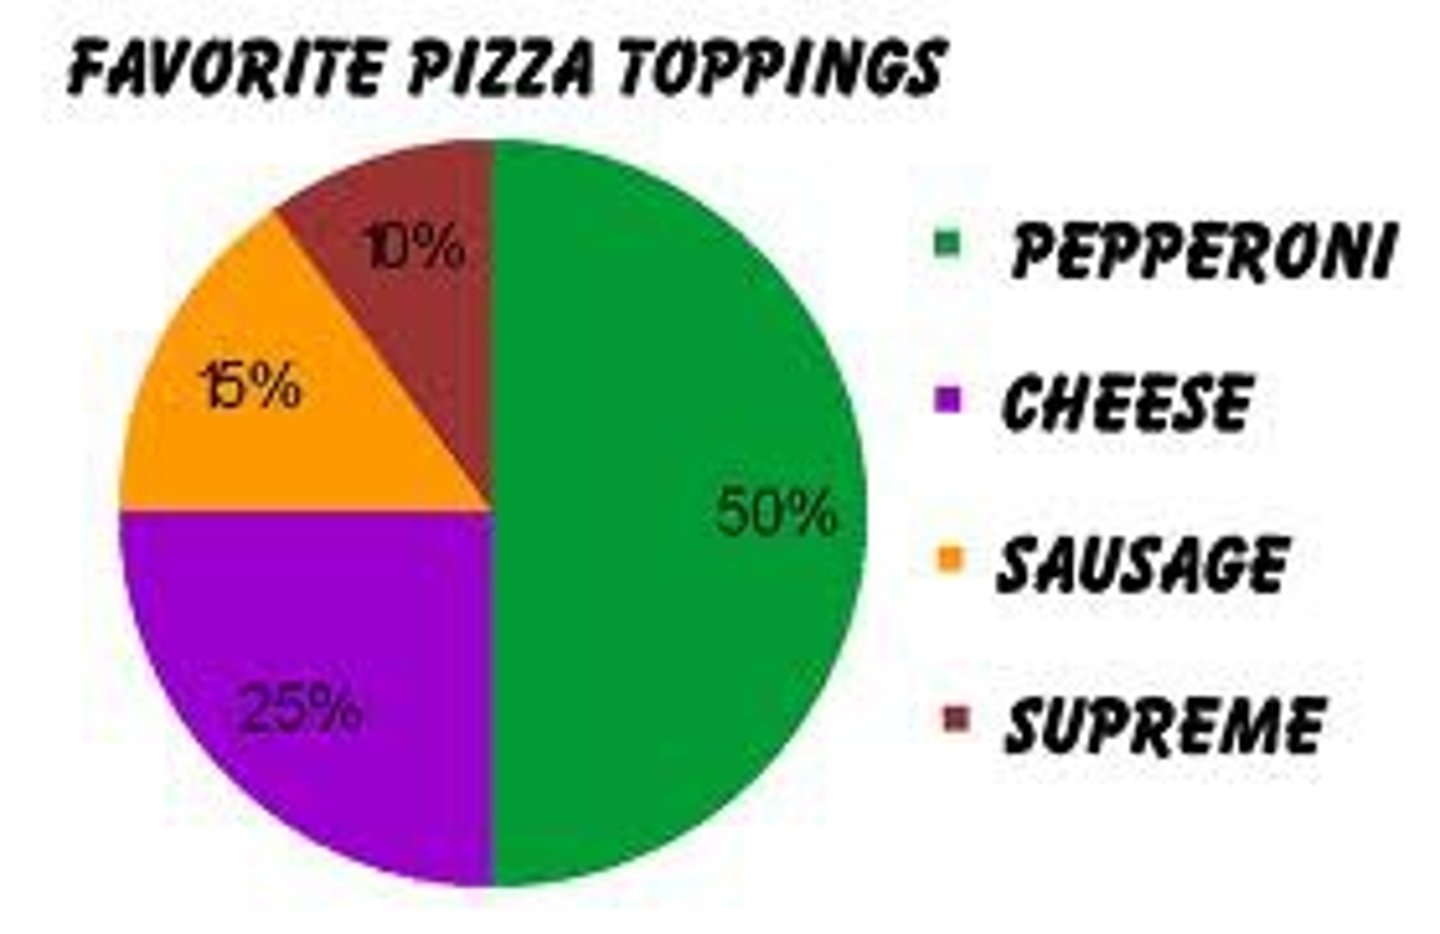
Pie charts are used for
quantitative data
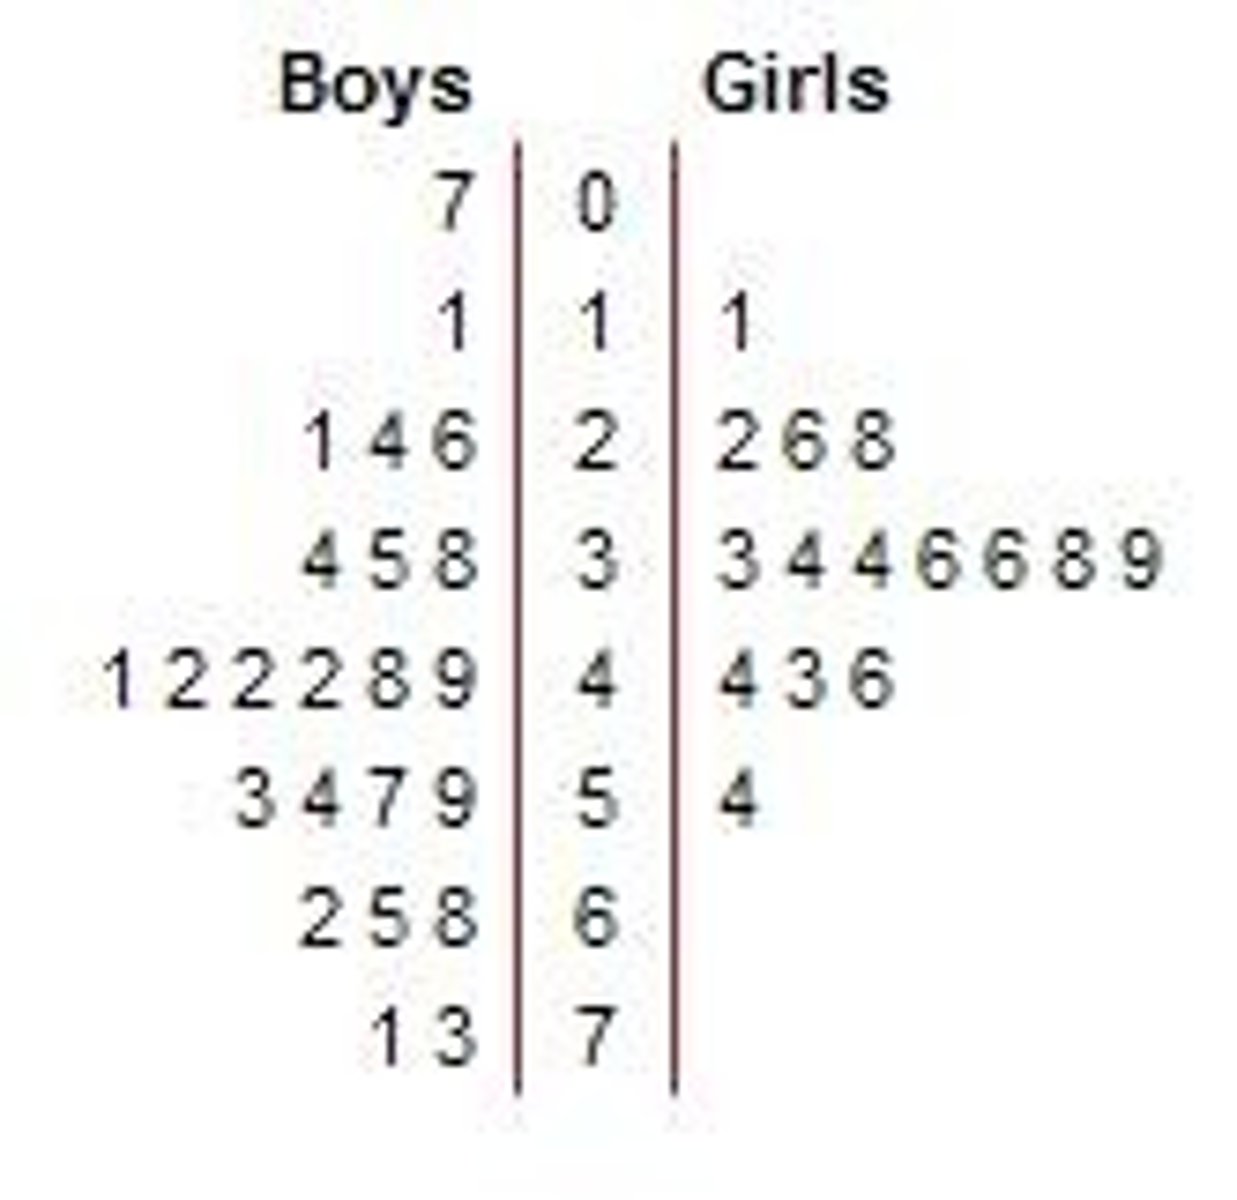
Stemplots
are tables in which NUMERICAL (quantitative) data values are divided into "stems" that can have multiple "leaves"
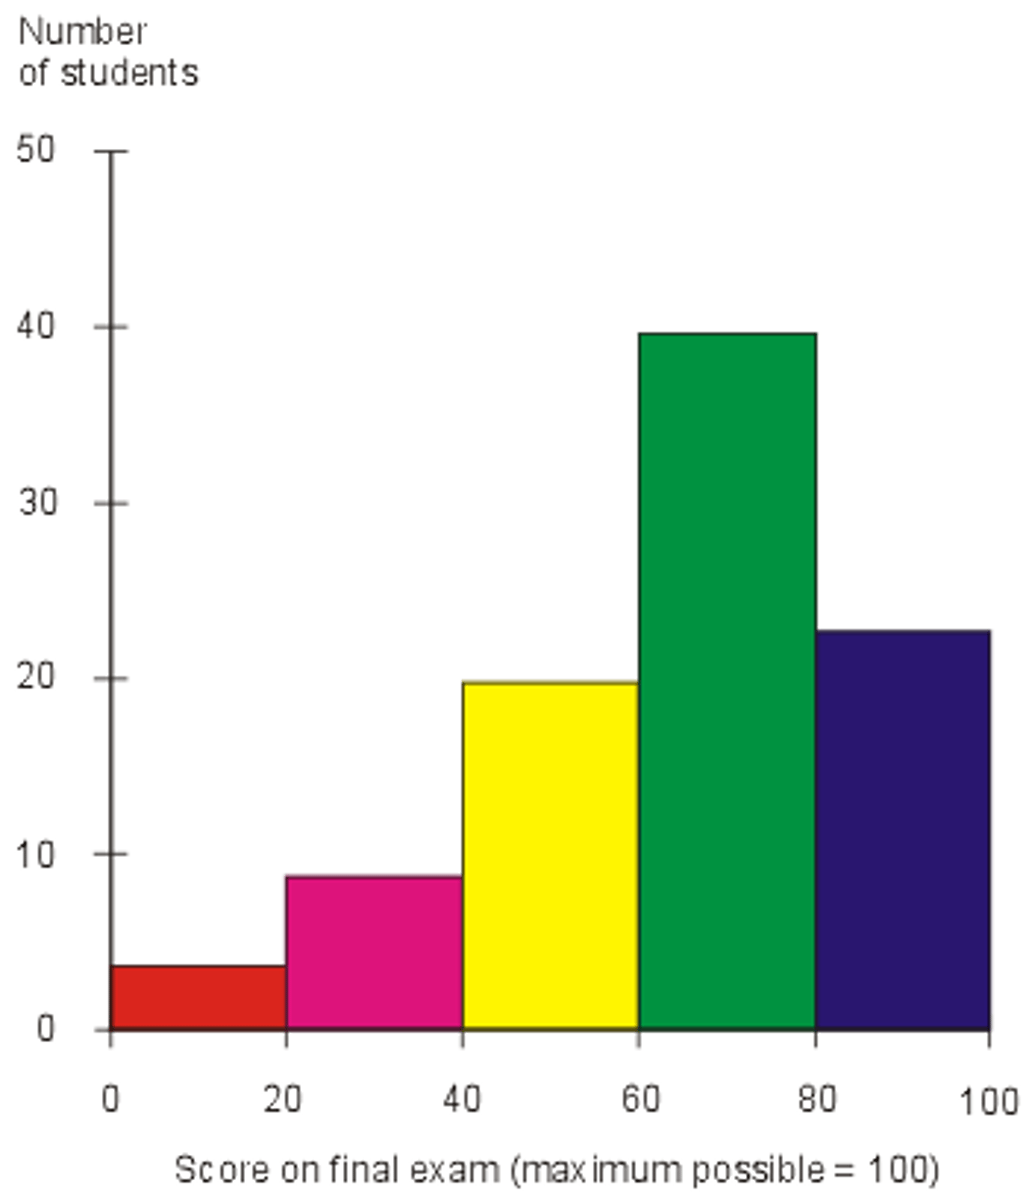
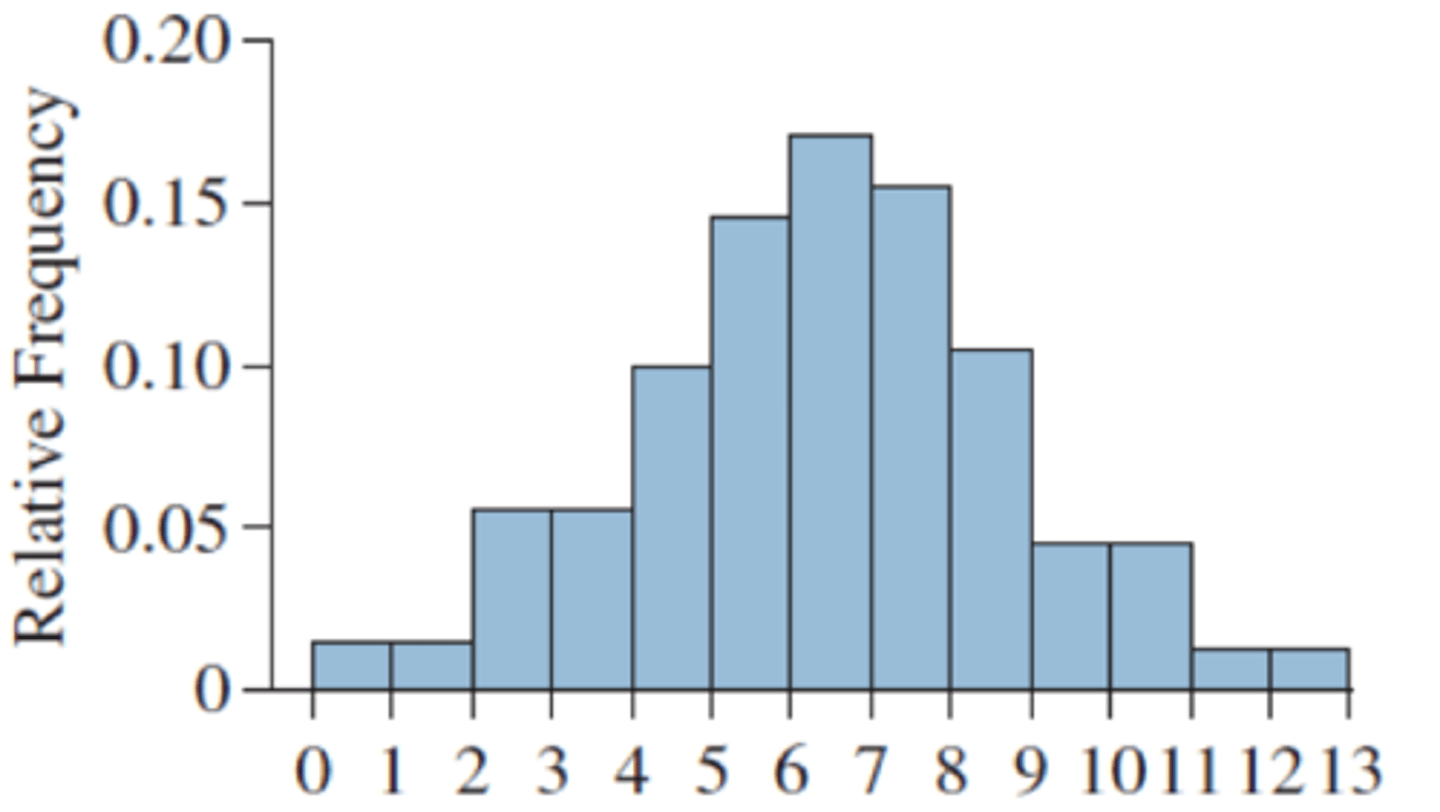
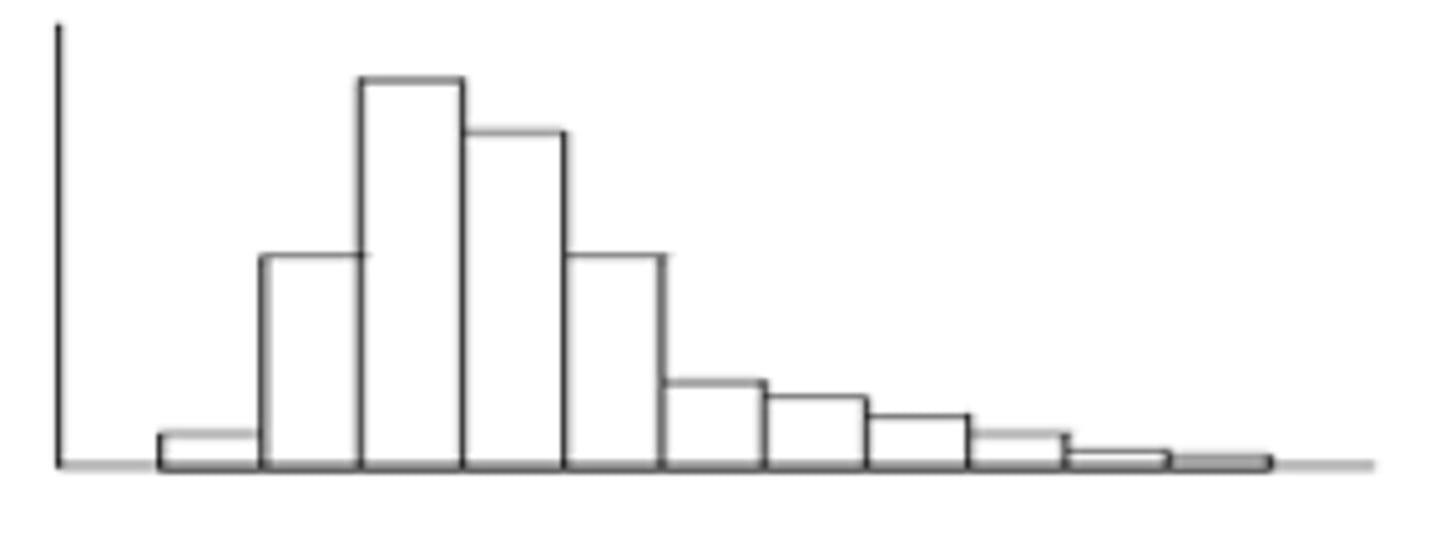
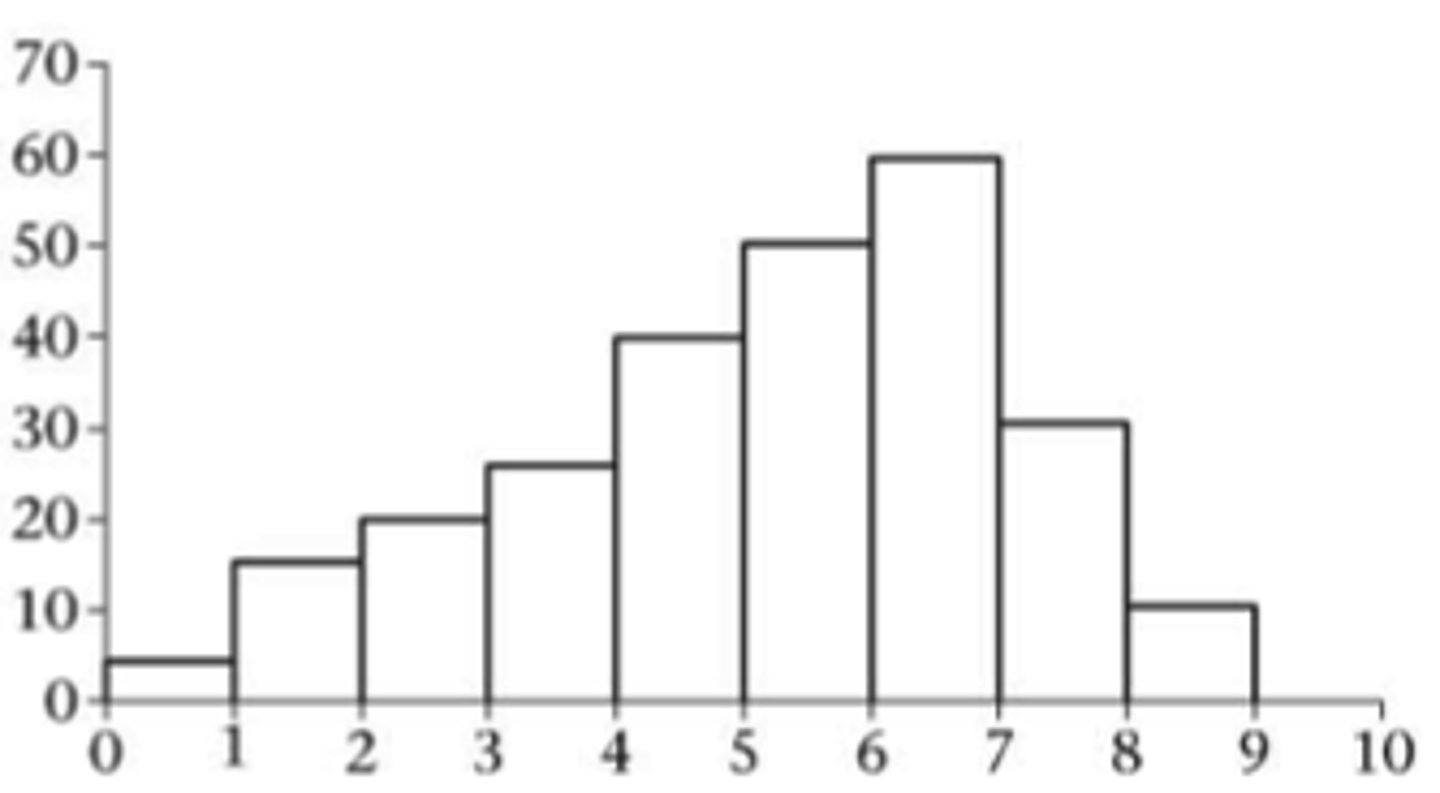
Histograms
are graphs consisting of vertical bars that touch each other and represent the frequency distribution of a set of data (quantitative)
bar graph
pie chart
Stemplot
Histogram
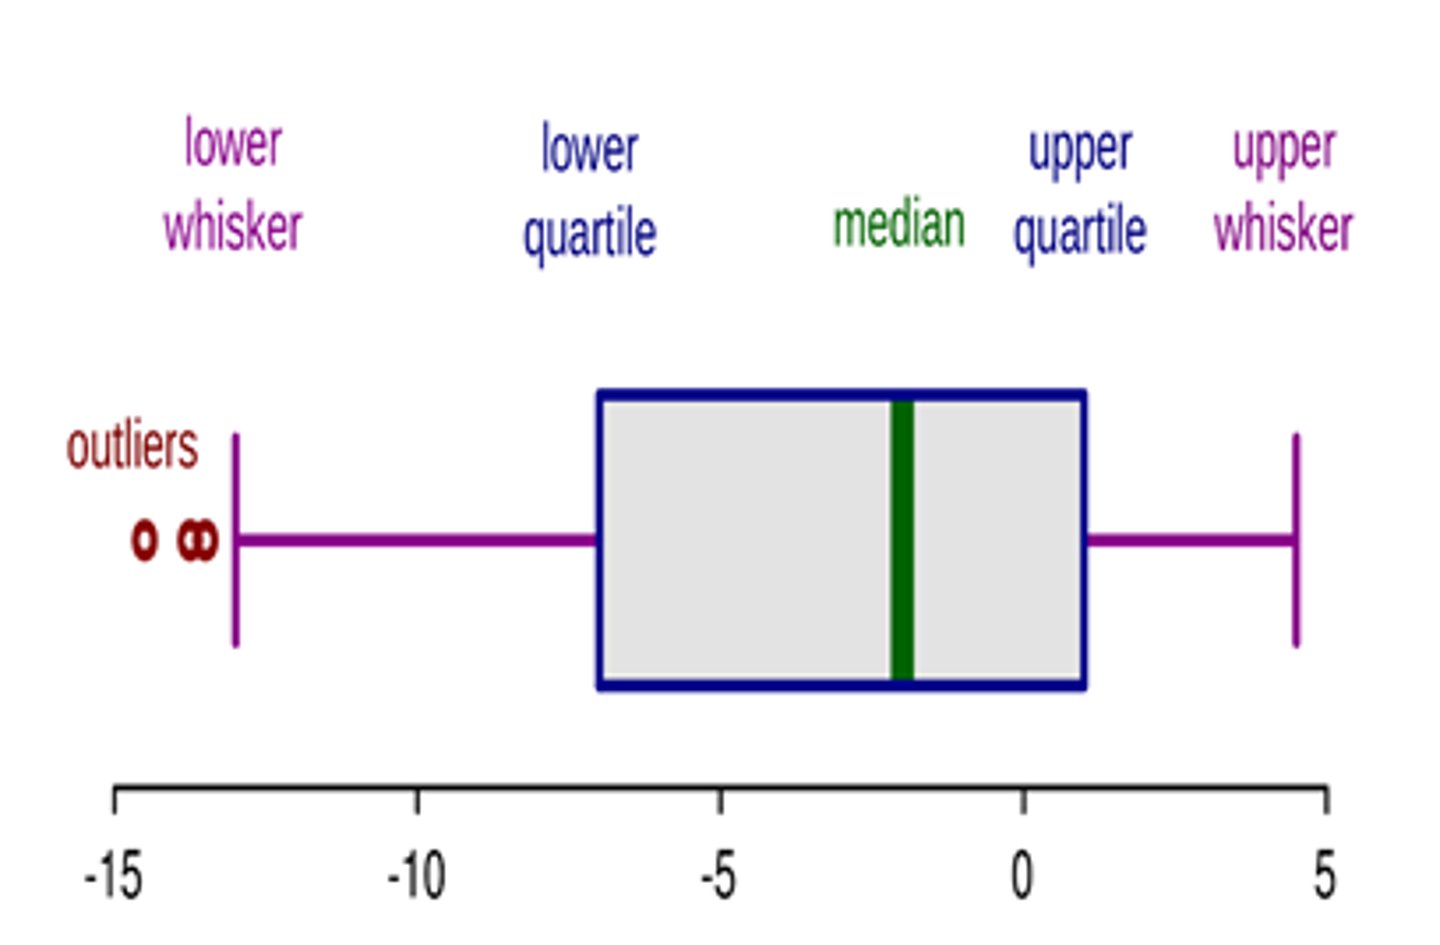
Outliers
extreme values that don't appear to belong with the rest of the data
influential observation
an observation that has a strong influence or effect on the regression results
1 peak=
unimodal
2 peaks=
bimodal
more than 2 peaks=
multimodal
symmetric
mean is equal to median
right skewed
mean is greater than median
left skewed
mean is less than median
Center of Distribution
Described by the mean, median, or mode, it is in some way the middle of the distribution.
Spread of Distribution
Described by Range, Interquartile Range, or Standard Deviation, the spread says how "wide" the distribution is.
Outliers
Any point that falls outside the pattern of the association should be considered an outlier.
Influential Points
A point is influential if it has a big effect on a calculation, such as the correlation or equation of the least-squares regression line. Points separated in the x-direction are often influential.
Mean
only used when data is NOT skewed, only used with continuous data (ratio or interval)
Median
used when data IS SKEWED, aka 50% percentile, normal distribution curve, can be used with all the data types
range
the difference between the highest and lowest scores in a distribution
IQR (interquartile range)
measure of statistical dispersion, being equal to the difference between the upper and lower quartiles (IQR = Q3 − Q1)
Variance
a difference between what is expected and what actually occurs (standard deviation squared)
standard deviation
a computed measure of how much scores vary around the mean score (square root of variance)
resistant measure
A statistic that is not affected very much by extreme observations.
5 number summary
minimum, Q1, median, Q3, maximum
1.5 IQR Rule
used for identifying outliers, any values that are more than 1.5 times the IQR lower than the first quartile or higher than the third quartile are called outliers
Boxplots (modified)
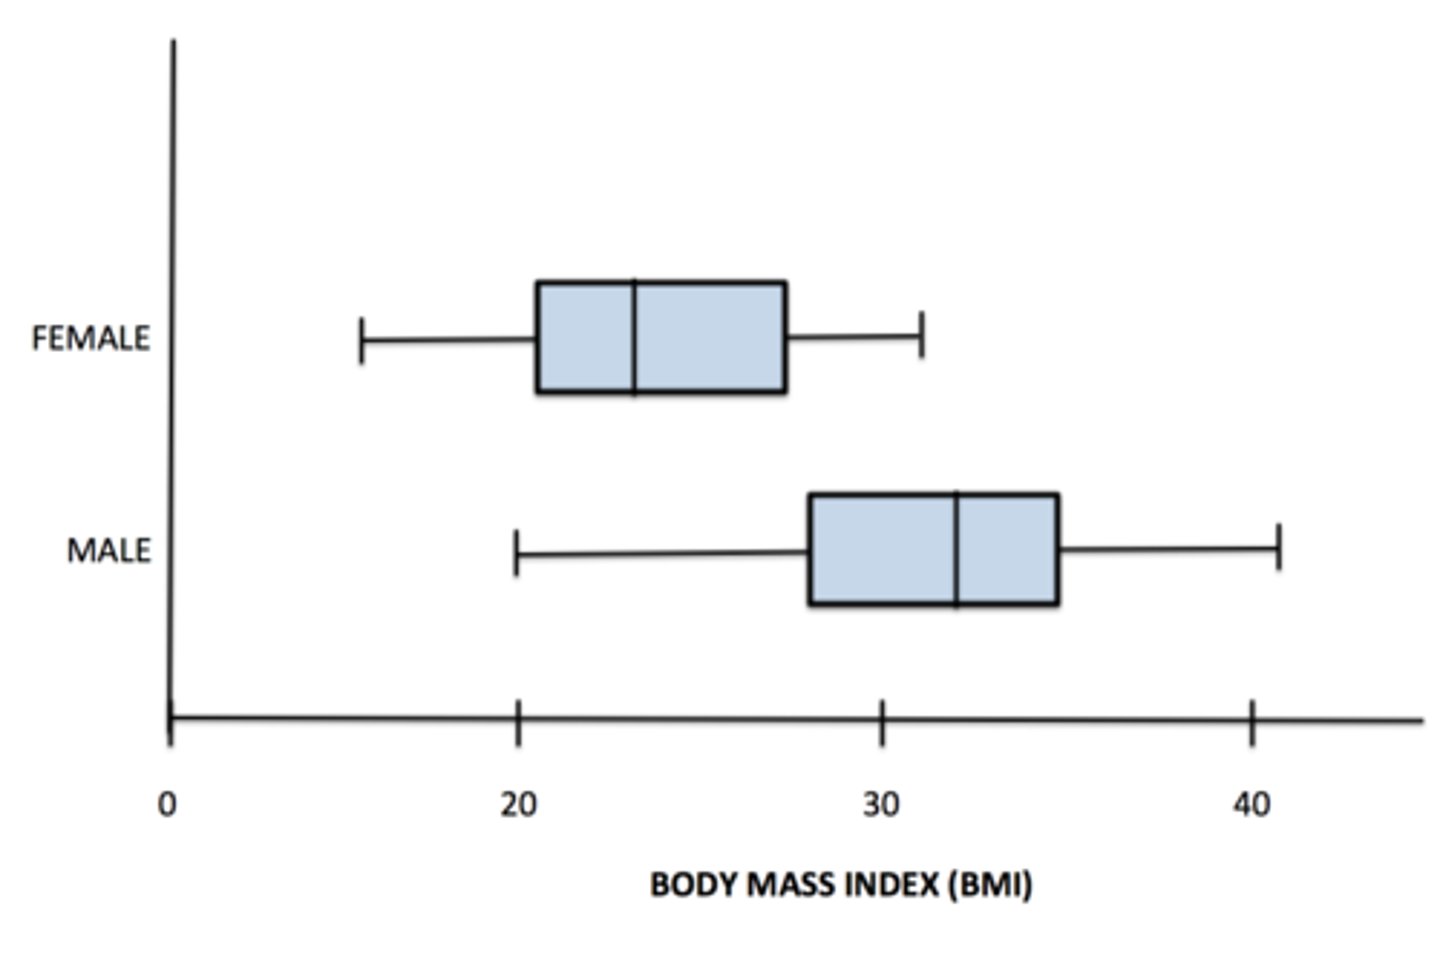
Boxplots (side-by-side)
unit/subject
one member of the entities being studied
Population vs. Sample
The population is the whole group versus a sample which are parts of the population.
Census
the official count of a population
Experiment
A study is an experiment ONLY if researchers impose a treatment upon the experimental units.
Observational Study
In an observational study, researchers make no attempt to influence the results and cannot conclude cause-and-effect.
non-random sampling
an alternative sampling method to random sampling, where the sample is not chosen at random.
voluntary response sample
A sample which involves only those who want to participate in the sampling
simple random sample (SRS)
every member of the population has a known and equal chance of selection
stratified random sampling
separation of the target population into different groups, called strata, and the selection of samples from each stratum
Multistage Random Sampling
a sample design in which the elements of the sampling frame are subdivided and the sample is chosen in more than one stage
anecdotal evidence
an informal observation that has not been systematically tested
undercoverage bias
occurs when some groups in the population are left out of the process of choosing the sample
nonresponse bias
bias introduced to a sample when a large fraction of those sampled fails to respond
response bias
people do not respond honestly
sampling variability
the natural tendency of randomly drawn samples to differ from each other
Parameter vs. Statistic
a characteristic or measure of a POPULATION vs. a characteristic or measure of SAMPLE
sampling distribution
the distribution of values taken by the statistic in all possible samples of the same size from the same population
treatments
the experimental conditions imposed by the experimenter
Factors
used during an experiment in order to determine their effect on the response variable
Factor levels
factors can only assume a limited number of possible values
explanatory variable
a variable that we think explains or causes changes in the response variable
response variable
a variable that measures an outcome or result of a study
control group
the group that does not receive the experimental treatment
Placebo
something which has a positive mental effect, but no physical effect
Bias
something that causes an inaccuracy in statistics and should be avoided
3 principals of experimental design
control, randomization, replication
completely randomized design
the treatments are assigned to all the experimental units completely by chance
block design
the random assignment of individuals to treatments is carried out separately within each block (group A and group B)
matched pairs design
A method of assigning subjects to groups in which pairs of subjects are first matched on some characteristic and then individually assigned randomly to groups.
double-blind experiment
an experiment in which neither the experimenter nor the participants know which participants received which treatment
review board
screening committees at research institutions that evaluate all research projects relative to their potential harm to participants
informed consent
an ethical principle that research participants be told enough to enable them to choose whether they wish to participate
Confidentiality
the act of holding information in confidence, not to be released to unauthorized individuals
ethics of doing experiments with animals
reduce, refine, replace
Causation
A cause and effect relationship in which one variable controls the changes in another variable.
lurking variable
a variable that is not among the explanatory or response variables in a study but that may influence the response variable
68-95-99.7 rule
in a normal model, about 68% of values fall within 1 standard deviation of the mean, about 95% fall within 2 standard deviations of the mean, and about 99.7% fall within 3 standard deviations of the mean
standard normal distribution
a normal distribution of z scores
sample mean symbol
x̅
standard deviation symbol
weird looking "o" that is actually a Greek letter that I do not know the name of (sorry)(maybe sigma?)
population mean symbol
μ
Central Limit Theorem (CLT)
the sampling distribution derived from a simple random sample will be approximately normally distributed