human geography un
1/94
There's no tags or description
Looks like no tags are added yet.
Name | Mastery | Learn | Test | Matching | Spaced | Call with Kai |
|---|
No analytics yet
Send a link to your students to track their progress
95 Terms
Population Density
Measure of the average population per square mile or kilometer of an area. Measures
how crowded a place is.
Population distribution
The pattern of human settlement—the spread of people across the earth.
social stratification
The hierarchical division of people into groups based on factors such as economic
status, power, and/or ethnicity
Arithmetic density
The total number of people divided by total land
area.
Physiological density
The number of people per unit area of arable
land.
Agricultural density
The ratio of the number of farmers to the amount of arable land
Arable land
Land suitable for growing crops
Infrastructure
The facilities and structures that allow people to carry out their typical activities (sewer
systems, electrical grids, roads and bridges, etc
Overpopulation
Having more people than a region can support
Carrying capacity
The number of people a region can support without damaging the environment
Population pyramid
Based only on age and gender data. Provides
information on birth rates, death rates, how long people live on average, and economic development
Birth deficit
A negative birth rate, where there are more deaths than live births in a population
Baby boom
a period of increased birth rates, most notably the one in the United States from 1946-1964,
following WW2
Baby bust
A significant, widespread decline in birth rates and fertility
Potential workforce
People ages 15-64, the group expected to be the society’s labor force
Dependent population
People under 15 or over 64, considered too young or too old to work full-time and
therefore are assumed to rely on the economically active workforce to keep the society
Dependency ratio
Number of people who are too young or too old to work, compared to the number of
people in productive years.
Demographic equation
Describes the future population of a region of any scale
What is the demographic balancing equation?
Future
population= Currently population + (number of births- number of deaths) + (number of immigrants -
number of emigrants).
Immigrants
People who moved into the country
Immigration
Migration to a location
Emigrants
People who moved out of the country
Emigration
Migration from a location
Crude birth rate (CBR)
Total number of live births in a year for every 1,000 people alive in the society
Total fertility rate (TFR)
Estimate of the average number children a woman will have during her
childbearing years
Life expectancy
The average number of years people live
Infant mortality rate (IMR)
Annual number of deaths of infants under one year of age, compared with
total live births
Crude death rate (CDR)
Total number of deaths in a year for every 1,000 people alive in a society
Natural increase rate (NIR)
Percentage by which a population grows in a
year. Subtract CDR from CBR after converting the number to percentages
Population doubling time
The period it takes for a population to double in size at a constant growth rate
Demographic transition model
Shows five typical stages of population change that countries experience
as they modernize
DTM stage 1
(High Stationary):
High birth rate but fluctuating as needed for farm labor changes,
High death rate but fluctuating to reflect diseases and poor sanitation,
Natural increase in a year is 0-.5%
Population change is very low growth because births and deaths both high,
Population structure is very young,
Examples today are scattered isolated groups,
Economy and society based on subsistence agriculture and hunter gathering
DTM stage 2
(Early Expanding):
High birth rate but fluctuating to reflect desires for big families,
Rapidly declining crude death as nutrition, sanitation, and medicine improve,
Natural increase in a year is .5 to 4%,
Population change is rapid growth as death rates fall faster than birth rates,
Population structure is very young,
Examples today are Mali and South Sudan,
Economy and society based on rural agricultural society and less developed society
DTM stage 3
(Late Expanding):
Declining birth rates as urbanization decreases the need for child labor,
Declining death rate but not as fast as in previous stage,
Natural rate of increase yearly is 4 to .8%,
Population change is rapid but slowing growth as birth rates decline,
Population structure is young with rising life expectancy,
Examples today are Mexico, Turkey, Indonesia,
Economy and society has a large movement of people from farms to cities, emerging/industrializing
DTM stage 4
(Low Stationary):
Low birth rate but enough to keep the population stable,
Death rate is low and stable Natural yearly rate increase is .8 to 0%,
Very low growth in population change because births and deaths are both low,
Population structure is balanced with more aging,
Examples today are United States and China,
Economy and society is an urbanized service economy, highly developed, rising gender equality
DTM stage 5
Declining):
Birth rates are so low it falls below the death rate,
Death rate is low but sometimes increasing as the population ages,
Natural increase rate yearly is 0% to (-1%)
Population change is very low decline as births fall below deaths,
Population structure is very old,
Examples today are Japan and Germany
Economy and society have a urbanized service economy and are highly developed
Epidemiological Transition Model
An extension of the DTM and explains the changing death rates and
more common causes of death within societies: Stage 1- Disease and Famine, Stage 2- Receding
Pandemics, Stage 3- Degenerative and Human-Created Diseases, Stage 4- Delayed Degenerative Diseases
Malthusian theory
Theory by Thomas Malthus that population grows exponentially while food supply
grows arithmetically, leading to potential famine, disease, and conflict unless population growth is
controlled
Boserup theory
Theory that farmers will adopt new and modern methods to keep up with demand
caused by an increasing population
Neo-malthusians
Modern supporters of Malthus’ ideas who argue that rapid population growth, combined
with resource depletion and environmental degradation, threatens sustainability and could lead to global
crises
Migration
The long-term, permanent relocation of people from one place to another
Migration transition model (MTM)
A model that links a country’s stage of demographic transition with typical
patterns of migration (e.g., rural-to-urban migration in early stages, urban-to-urban or international
migration in later stages). shows that as a country becomes more developed, it shifts from
being a source of emigrants to being a destination for immigrants
Net migration
Difference between the number of immigrants and emigrants
Internally displaced person (IDP)
A person who is forcibly uprooted within their country but has not crossed
an international border
Pull factor
Convinces people to move into a new location.
Push factor
Convinces people to move out of a present location.
Intervening obstacle
Environmental or cultural feature that hinders migration
Intervening opportunities
Factors that cause a migrant to stop and settle before reaching their original
destination (e.g., finding a job or family support in a closer location
Distance decay
The principle that interaction between two places decreases as the distance between them
increases
Gravity model of migration
A model that predicts migration flows based on the size (population) of two
places and the distance between them — larger and closer places attract more migrants
Step migration
Migration that occurs in stages, moving from a small town → medium city → large city
rather than directly to the final destination
Rural to urban
The movement of people from countryside areas to cities, often driven by
industrialization, job opportunities, and better services.
Counter migration
When people move back to their place of origin after migrating somewhere else
Return migration
The voluntary movement of migrants back to their home country or region after some
time away
Refugees
People forced to leave their country due to war, persecution, or natural disaster, with a well-
founded fear of harm if they return.
Asylum
Legal protection granted by a country to someone who has fled their home country to escape
danger or persecution
Transnational migration
Migration in which people maintain connections to two or more countries —
socially, economically, or politically
Chain migration
Migration of people to a specific location because relatives or members of nationality
previously migrated there
Voluntary migration
Migrant has chosen to move for economic improvement
Forced migration
Involuntary movement of people caused by conflict, disaster, slavery, or government
policies (e.g., deportation).
Internal migration
Permanent movement within the same country
Guest worker
Migrant laborers allowed to temporarily work in another country, often to fill labor
shortages.
Transhumance
The seasonal migration of livestock between mountains and lowland pastures
Homestead act U.S. law (1862)
that encouraged westward settlement by granting free land to those
willing to farm and improve it.
Family reunification
Immigration policies that prioritize visas for close relatives of citizens or
legal residents, allowing families to live together
Xenophobia
Fear, dislike, or hostility toward people from other countries or cultures
Remittances
Money sent by migrants back to their home country to support family or community
members
Brain drain
The emigration of highly skilled or educated people from one country, often weakening the
sending country’s economy
Ethic enclaves
Neighborhoods or areas where a high concentration of one ethnic group lives,
maintaining cultural traditions and businesses
Least developed countries (LDC)
Countries with low levels of income, education, healthcare, and
industrialization; often experiencing high population growth rates
More developed countries (MDC)
Countries with higher levels of income, education, healthcare, and
industrialization; usually with slower population growth
Ravensteins law of migration
A set of 19th-century “laws” describing migration patterns — most
migrants move short distances, long-distance migrants head to major cities, and migration occurs in
counterflow (every migration flow, there is a return or counter flow
Pro-Natalist
Government policies designed to encourage population growth (e.g., financial incentives for
having children)
Anti-natalist
Government policies designed to slow population growth (e.g., restricting family size or
promoting contraception)
The difference between DTM and ETM
The DTM describes shifts in birth and death rate, while the ETM details the changing causes of death
ETM stage 1
Death caused by famine and pestilence (ex: black plague)
ETM stage 2
Death caused by receding pandemics (ex: better hygiene)
ETM stage 3
Death caused by degenerative and human-created diseases (ex: heart attack)
DTM stage 4
Death caused by delayed degenerative diseases (ex: diabetes)
DTM stage 5
Death caused by Re-emergent infectious diseases (ex: antibiotic resistance )
Gravity model equation
S = (P1*P2)/D²
RNI equation
RNI = CBR - CDR
What’s the population growth rate equation? (PGR)
(CBR - CDR + net migration)/10
Doubling time equation
70 / growth rate
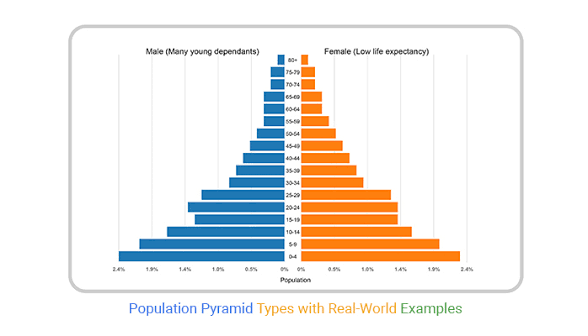
What pyramid is this?
Expansive pyramid
What does the expansive pyramid show
Indicates high birth rates and a large portion of young people (typical for developing countries with rapid population growth)
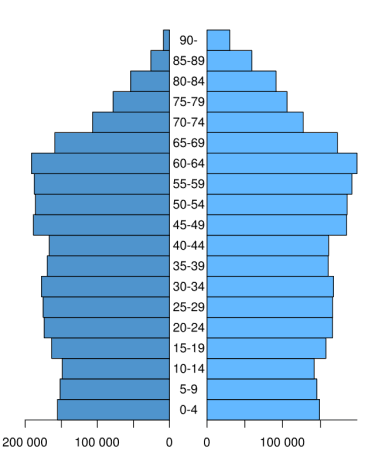
What pyramid is this?
Stationary pyramid
What does the stationary pyramid show?
Even age distribution, signifying slow or zero population growth, birth and death rates are balanced
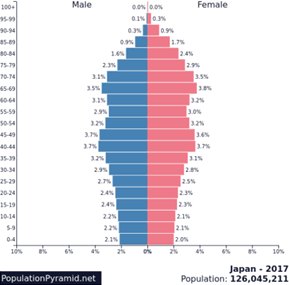
What pyramid is this?
Constructive pyramid
What does the constrictive pyramid show?
Narrow base with more people in older age groups, indicating a declining population due to low birth rates and high life expectancy
What does the y-axis show in a population pyramid
Age distribution
What does the x-axis show in a population pyramid
Sex ratio
What are the pre-reproductive ages?
0-14
What are the reproductive age?
15-44 or 15-64
What are the post reproductive ages?
45+ or 65+