Research Psychology Exam 2 (PSY:2811)
1/96
There's no tags or description
Looks like no tags are added yet.
Name | Mastery | Learn | Test | Matching | Spaced | Call with Kai |
|---|
No study sessions yet.
97 Terms
relative frequency table
shows the percents of observations in each category or class
calculate relative frequency
proportion= frequency of bin/ total of all frequencies
for relative frequency, what do you want to proportion numbers to add up to?
1 or 100
proportion can also be expressed as...
a percentage
cumulative frequency tables
count accumulated scores across bins
calculate cumulative frequency
frequency of row + cumulative frequency of above bin
absolute frequency
the number of times a score or value occurs in a data set
percent of total
bin count/ total count
what is shown on the x-axis of a histogram
possible values
what is shown on the y-axis of a histogram
frequency (proportion or percentage)
bins should be...
1. equal sized
2. exclusive without gaps
3. exhaustive of all possible scores
increment of values on the y-axis should be...
equal sized
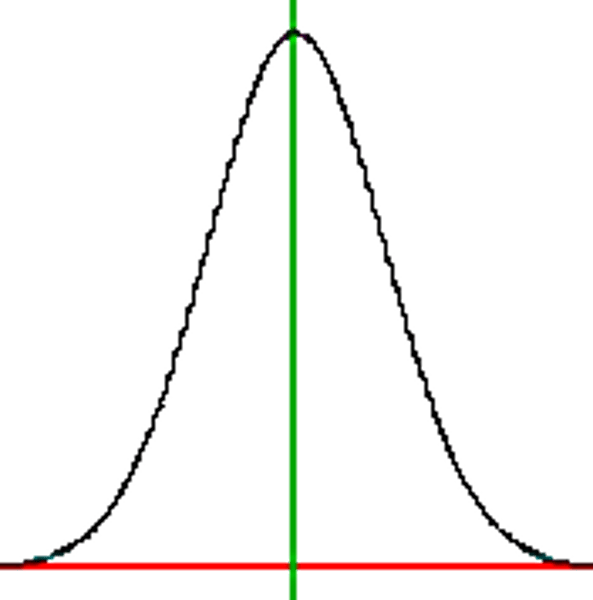
normal distribution
symmetrical distribution of data with a single peal and a bell shape
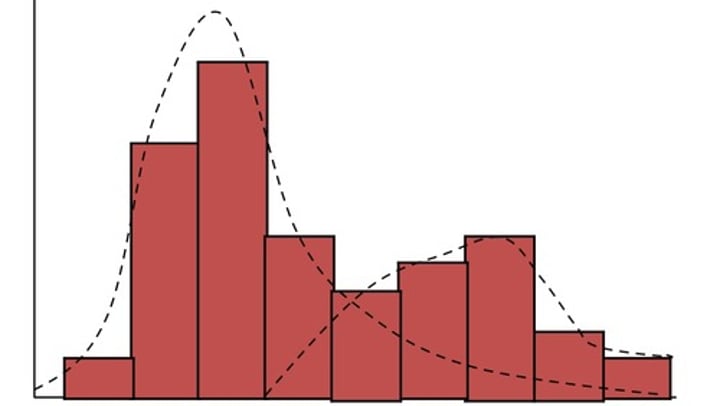
bi-modal distribution
distribution with two peaks
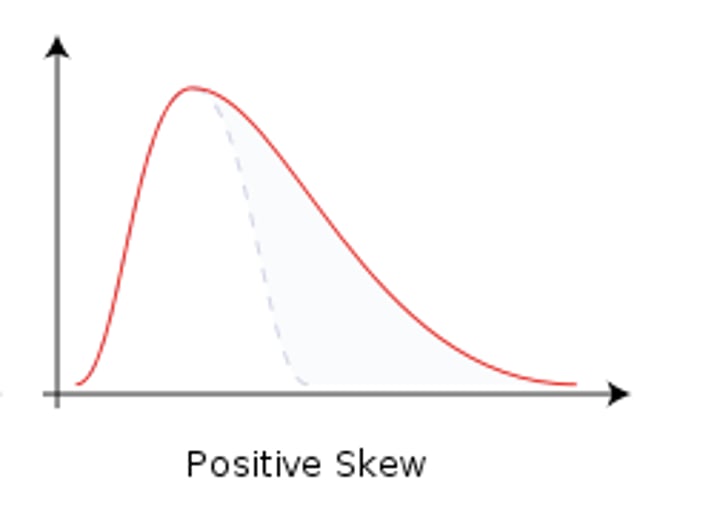
skewed distribution
distribution has off-centered peaks
negative skew (left) order
(left to right)
1. mean
2. median
3. mode
positive skew (right) ordr
(left to right)
1. mode
2. median
3. mean
measures of central tendency
mean, median, mode
mode
most frequently occurring score
the only and best measure for nominal variables
mode
nominal variable
no order, ex. eye color
ordinal variable
you can order them, but you can't put a number on it (agree/ disagree)
multiple peaks often means...
there are sub-groupings within the sample, consider separating for further analysis (think Kentucky derby example)
median
the middle value in a frequency distribution
when is median best used
when the shape of the distribution for interval/ ratio variable is skewed
mean
average
calculate mean
sum of all scores (X)/ number of scores (n)
when is mean best used
when the shape of the distribution for interval/ ratio variable is symmetrical (not skewed) and unimodal
nominal (symmetric, skewed and multi-modal)
mode
ordinal, symmetric
median
ordinal, skewed
median
ordinal, multi-modal
mode(s)
interval, symmetric
mean
interval, skewed
median
interval, multi-modal
mode(s)
ratio, symmetric
mean
ratio, skewed
median
ratio, multi-modal
mode(s)
central tendency
a measure that represents the typical response or the behavior of a group as a whole
variability between multiple people
students will score differently from each other
variability within a given participant
some score within a person may fluctuate as time goes on
random measurement error
score is higher, or lower than the "true" score, doesn't affect average, only the variability around the average
systematic measurement error
measure of a construct is consistently offset from the "true" score, does affect the average (called bias), central tendency will be shifted
range
a measure of variability that indicates how wide the distribution is
calculate range
highest value - lowest value
range is highly susceptible to...
outliers
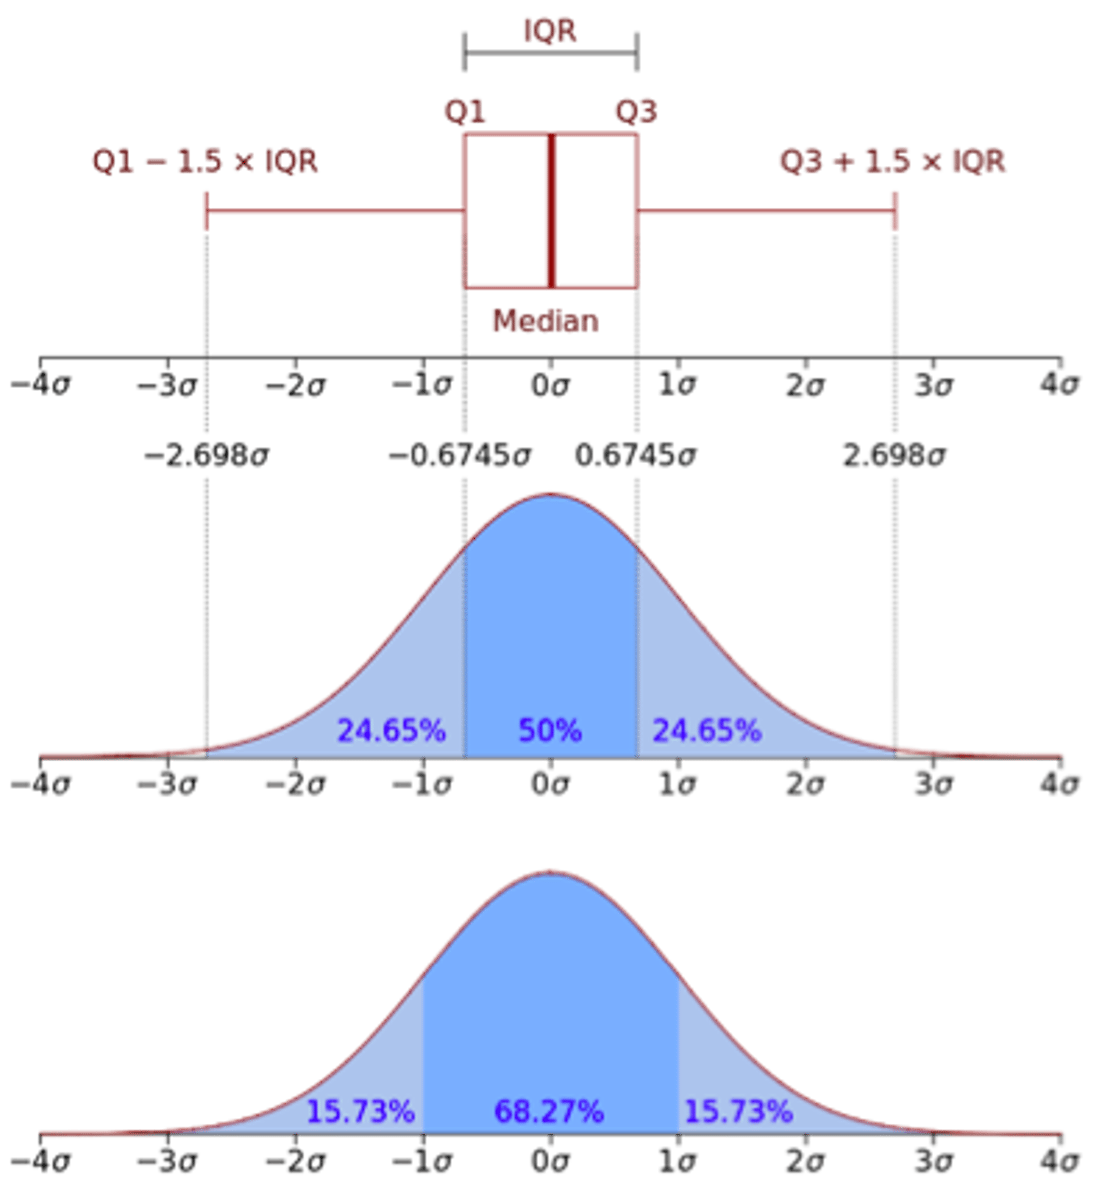
IQR
tells us how spread out the most commonly occurring values are in the distribution
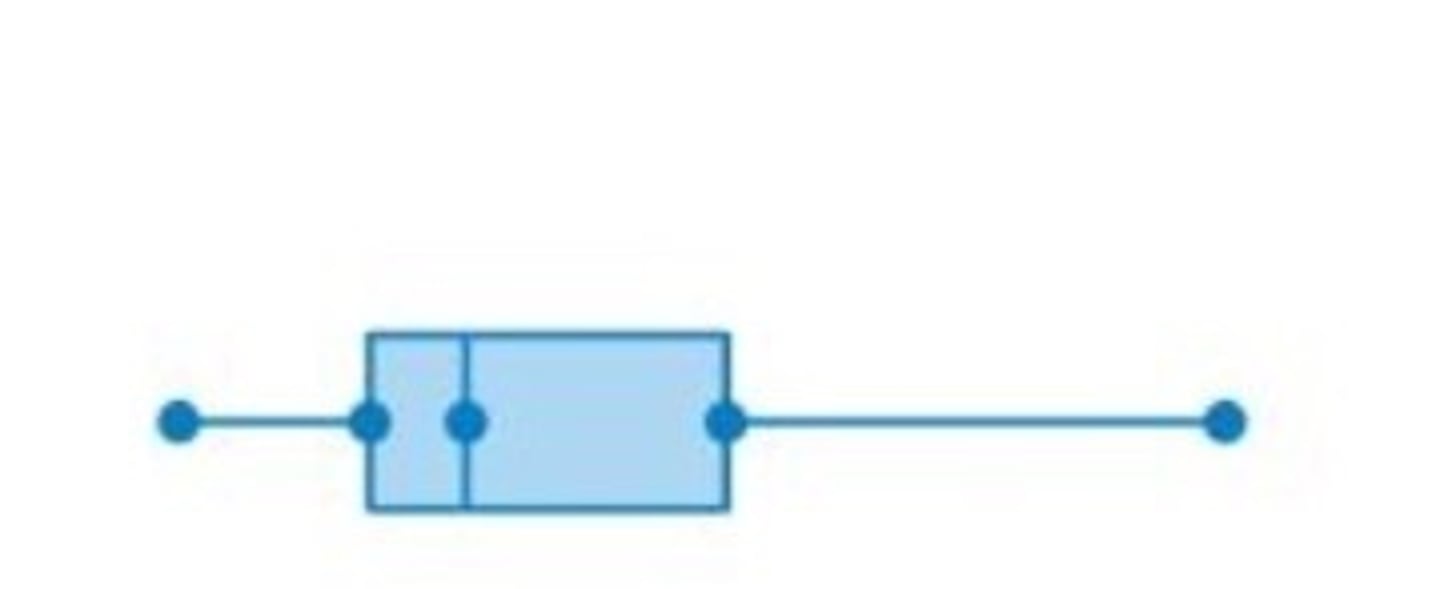
what do the whiskers represent in a box and whisker plot
range
what do the boxes represent in a box and whisker plot
IQR
normal distribution box and whisker plot
multi-modal with short tails box and whisker plot

positive skew box and whisker plot
deviations
how much each date point deviates from the mean
greater deviations mean
greater spread, greater variability
negative deviation
score is less than the mean
positive deviation
score greater than mean
calculate deviation
score - mean
xi - X
the total negative deviation will always be the same as...
the total positive deviation
absolute deviation
absolute value of all deviation scores
mean absolute deviation
mean of the absolute deviation
total/ # of scores
distributions with higher M.A.D. have...
a greater spread of scores
which kind of plots help visualize central tendency, shape of distrib., and variability
histogram, box and whisker plot
sum of squares
the sum of the squared deviation scores
calculate sum of squares
sum of individual scores - (sum of individual scores^2/ number of scores)
difference between population ad sample estimates for the sum of squares
different symbols
population sum of squares
μ and N
sample sum of squares
x̄ and n
variance
estimate of average sum of squares
calculate variance
σ^2= SS/N
calculate sample space (variance for a sample)
s^2=SS/n-1
degrees of freedom
number of scores that can vary in the calculation of a statistic
degrees of freedom has a bigger effect on...
smaller samples
calculate standard deviation
√(SS/N)
calculate sample standard deviation
√(SS/n-1)
when do you use sample standard deviation
when you measure from a sample to infer about a larger population
when do you use population standard deviation
highly unlikely
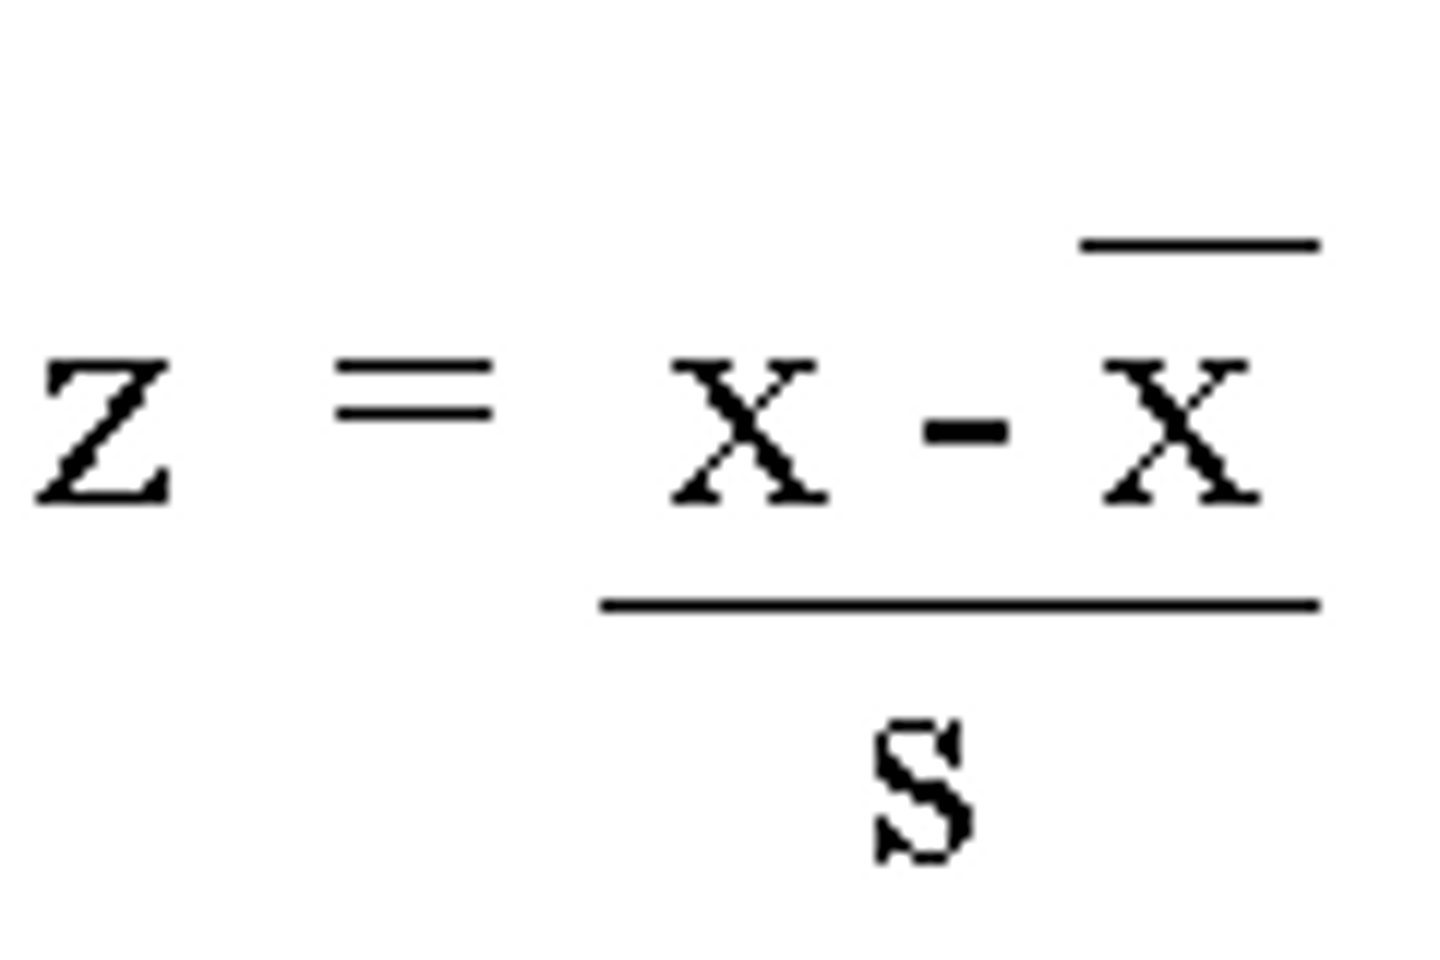
what is a z-score
number of standard deviations away from the mean
z-scores are helpful for...
comparing across measures with different units of measurement
calculate z-score
(score-mean)/ standard deviation
standard curve
easy acess to information about proportion under the curve
z-score of 0 means...
he data point's score is identical to the mean score
how can z-scores identify outliers
all scores less than or greater than 3 SDs from the mean is considered an outlier
what kind of claim do you use the Pearson r
correlational claim (association)
when to use pearson correlation
to quantify the direction and strength of the relationship between 2 quantitative variables of at least interval measurement scale
correlation statistic
describes the direction and strength of the relationship between 2 quantitative variables
quantitative variables
factors that can be counted
how can correlation strength be found
how close the points are to a trend line, the close to 1/-1 the better
how can correlation direction be found
the slope, pos./neg.
calculate r
sum of cross products/ √(SS for x)(SS for y)
calculate cross product
(score of x - mean) * (score of y - mean)
add all of them up
what indicates strength and direction in the statistic (pearsons r)
the numerator
what indicates strength and direction in the scatter plot (pearsons r)
negative correlation: x value higher than mean, y value lower than mean
positive correlation: x value lower than the mean, y value higher than the mean
if an extreme score (outlier) in the same direction is taken out, how does this affect the correlation
it gets weaker
if an extreme score (outlier) in the middle is taken out, how does this affect the correlation
it gets stronger
if an extreme score (outlier) in the opposite direction is taken out, how does this affect the correlation
it gets stronger/ stays the same
range restriction
occurs when the range of scores obtained for a variable has been artificially limited in some way
when you reduce variability (range restriction)...
the correlation will decrease