Silverstein and Hopper Chapter 35: Ventilator Waveforms
1/80
There's no tags or description
Looks like no tags are added yet.
Name | Mastery | Learn | Test | Matching | Spaced | Call with Kai |
|---|
No study sessions yet.
81 Terms
Scalars
Those wherein a single parameter is plotted over time
What are the six characteristic shapes of scalars?
Square
Ascending ramp
Descending ramp
Sine
Exponential rise
Exponential decay

Square waveform

Ascending waveform

Descending waveform

Sine waveform

Exponential rise waveform

Exponential decay waveform
Sine Waveforms
Characteristic of patient efforts such as are seen with spontaneous breaths in CPAP or synchronized intermittent mandatory ventilation (SIMV)
Square Waveforms
Indicates that the given parameter changes abruptly but then held at a near constant value for a time
Ramp and Exponential Waveforms
Indicate that a parameter is changing gradually over time with a rate of change that is either constant (ramp) or variable (exponential)
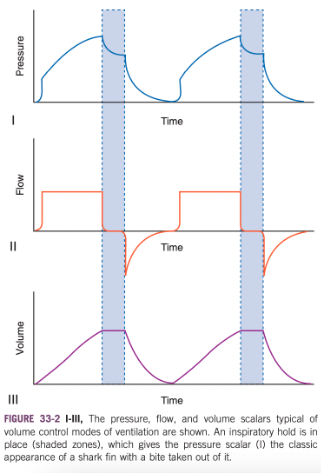
Draw the Pressure, Flow, and Volume Scalars for Volume Control Ventilation
Pressure waveforms have the characteristic exponential rise shape ("shark fin")
Highlighted area denotes a period of inspiratory hold, which allows time for intrapulmonary redistribution of gas ("pendelluft") with a resultant pressure decline from peak inspiratory pressure (PIP) to plateau pressure (Pplat)
If the inspiratory hold is removed, this concavity would not be present and expiration would begin once the preset tidal volume has been achieved
Flow profile in this setting is constant (square) throughout inspiration
Delivery of flow at a constant rate allows for meaningful assessment of airway resistance (Raw)
Some ventilators allow for delivery of flow during volume control modes with a descending ramp profile, which has several potential benefits
Inspiratory hold results in a prominent plateau in the volume waveform
Rule of Thumb about the Scalar that Represents the Dependent Variable
Rule of thumb - the scalar that represents the dependent variable will have the information that most directly reflects the patient's respiratory mechanics
Does not wholly apply to patient ventilator dyssynchrony (PVD) because patient effort in this setting often leads to subtle alterations in the plot of the independent variable
Loops
Two parameters are plotted simultaneously
Inspiratory Hold
Highlighted area denotes a period of inspiratory hold, which allows time for intrapulmonary redistribution of gas ("pendelluft") with a resultant pressure decline from peak inspiratory pressure (PIP) to plateau pressure (Pplat)
Draw the Pressure, Flow, and Volume Scalars for Pressure Control Modes
Shows the characteristic shape of the waveforms seen with pressure control modes (P-ACV, SIMV-PC) and support modes
In pressure control modes the pressure waveform is now the one with the characteristic shape, whereas the flow waveform typically assumes the shape of an exponential decay
The volume waveforms may be indistinguishable from those observed with volume control modes
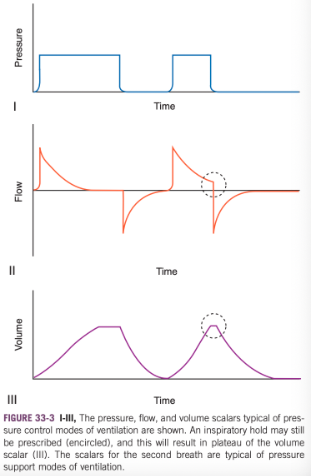
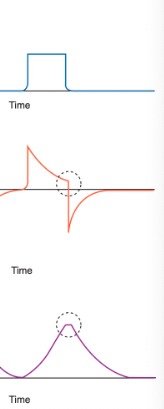
Scalars for Pressure Support Modes (SIMV with PSV)
In this setting, inspiratory flow is not expected to reach zero before expiration begins
In these instances, the inspiratory flow is set to cycle off once a preset percentage of peak flow is achieved (e.g. 30% of peak)
Reached within the upper dashed circle
Because the termination of inspiratory flow occurs when flow is low but not zero, the volume waveform shows a minimal plateau (lower dashed circle)
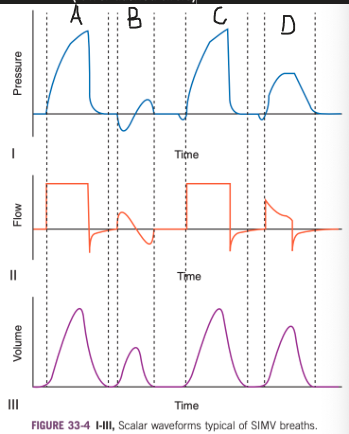
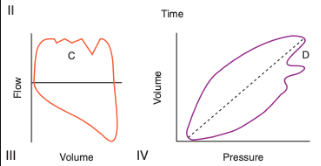
Draw the Pressure, Flow, and Volume Scalars for SIMV
A - typical waveforms associated with a mandatory breath in SIMV-VC
The shark fin pressure tracing and square wave flow tracing evident
No inspiratory hold has been prescribed so expiration begins once the target tidal volume is achieved
Before the initiation of inspiratory flow there is no evidence of patient effort (triggering)
B - spontaneous breath
Characteristic sine wave appearance
The negative portion of the pressure tracing is associated with inward flow because this is a spontaneous breath and not a positive pressure machine-delivered/assisted/supported breath
Tidal volume the patient achieves is lower than with a mandatory breath, which is what is typically observed (but not obligatory because it depends on patient effort and capacity)
C - represents a synchronized, patient-triggered but machine-delivered breath
The patient's inspiratory effort fell near to the time when the next mandatory breath was due
The ventilator delivered a breath equivalent to the mandatory breath (A) but did so at a time synchronous with the patient's respiratory efforts
The tidal volume is identical to that achieved in A
The patient's efforts only altered the timing of the breath, not its character
The nature of SIMV is such that there are preset periods immediately after a mandatory breath wherein the patient may breathe spontaneously and small time intervals before a mandatory breath during which patient efforts will trigger early delivery of the next ventilator delivered breath
D - represents the waveforms typical of SIMV with pressure support
The patient's inspiratory efforts for a spontaneous breath result in the ventilator delivering additional flow to supplement that achieved by the patient's own efforts
Pressure support is set to cease once a predetermined level of inspiratory flow is reached (e.g. 30% of peak flow)
Reflected in the flow waveform by the fact that the inspiratory flow abruptly ceases at a level above zero
Tidal volume achieved is larger than the patient achieved with a spontaneous breath (B) but smaller than the mandatory breaths (A and C)
Equivalent tidal volumes could be achieved by increasing the level of pressure support
What shape does the pressure waveform usually take in volume control modes with constant flow?
Exponential rising

What form does the pressure waveform usually take in pressure control modes?
Square waveform

Pressure Waveform with an Inspiratory Pause
When an inspiratory pause is in place the pressure waveform takes on the shape seen in B (shark fin with bite out of it)

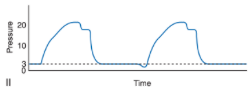
Pressure Waveform when PEEP is Applied
II shows that when PEEP is being applied it is expected that pressure never returns to baseline, but rather remains at this preset level above atmospheric pressure between breaths (dashed line)
Pressure decreases below this preset level indicate either patient effort, artifact, or circuit leaks
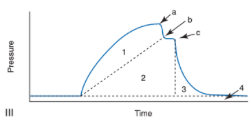
What are the labeled points?
a - PIP
c - Pplat
Dynamic compliance (Cdyn) is lower than static compliance (Cs) because of the increased pressure required overcoming circuit and airway resistance (Raw)
This pressure would be reflected by the size of the region labeled 1
True static compliance can only be determined once bulk flow (gas delivery) and intrapulmonary flow (pendelluft) have ceased (point c)
Need an inspiratory hold of about 1.5 seconds to truly measure static compliance
If too short of an inspiratory hold, the pressure drops to point b
Compliance measurements derived using these values are termed quasistatic (i.e. Cqs)
Major influences on mean airway pressure (MAP) are the relative height and width of four distinct pressures
1 - pressure used to overcome circuit and airway resistances
2 - pressure used to deform the lung and expand the alveoli
3 - pressure throughout the expiratory flow phase
4 - PEEP
An increase in the surface area of any of these regions without an equivalent decrease in another will result in a higher MAP
Dynamic Compliance Equation
Dynamic compliance = tidal volume/(PIP-PEEP)
Static Compliance Equation
Tidal volume/(Pplat/PEEP)
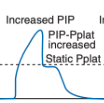
What does this waveform indicate?
Increased raw
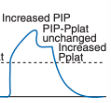
What does this waveform indicate?
Decreased compliance
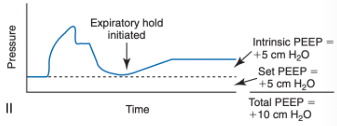
What is the purpose of an expiratory hold?
Performing an expiratory hold allows one to quantify intrinsic PEEP caused by gas trapping (auto-PEEP) as long as auto-PEEP is of a value greater than set PEEP (33-6II)
Auto-PEEP can have adverse effects including making patient triggering of the ventilator more challenging
What form will the flow waveform take in volume control modes?
Square or descending ramp
Many ventilators allow the operator to choose the flow profile in this setting
What form will the flow profile take in spontaneous breathing?
Sine wave
What appearance does the flow waveform take in pressure control modes?
Exponential decay
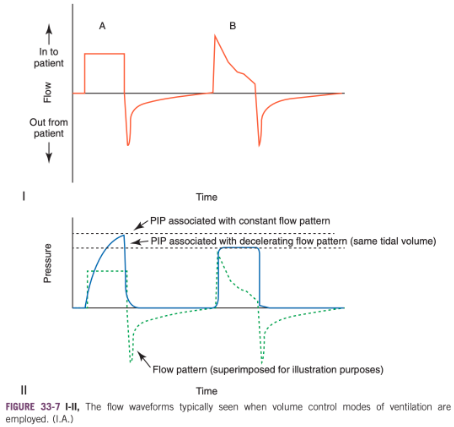
Drawbacks to Constant Flow Approach
For a given tidal volume delivered, using a constant flow delivery results in modestly higher peak inspiratory pressures than if a decelerating ramp approach is taken
Use of a decelerating ramp pattern allows for fine-tuning of inspiratory time (I-time)

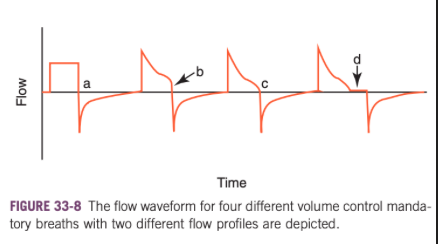
What do these flow waveforms for volume control mode indicate?
For a, a constant (square) flow delivery was selected
For b, c, and d a decelerating ramp flow pattern was selected
C shows the appearance of the waveform when I-time is optimal
Flow returns all the way to zero before exhalation begins
In b, the I-time is too short which may lead to flow asynchrony
In d, the I-time is too prolonged and there is a noticeable period of "zero-flow state" before exhalation
This zero-flow state puts the patient at risk for double triggering and other forms of PVD
In a, the constant flow rate option does not lend itself to the adjustment of I-time because the transition from inspiration to expiration is always abrupt when this flow pattern is selected unless an inspiratory hold is put in place
If volume control mode of ventilation is selected, selection of a decelerating ramp flow pattern may both allow for a lower PIP as well as allow the I-time to be optimized using waveform inspection methods
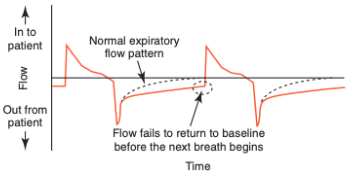
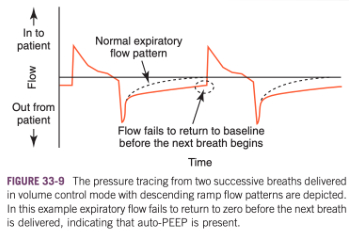
How does the flow scalar help detect auto-PEEP without having to apply an expiratory hold?
The flow scalar is a key too in the detection of auto-PEEP without having to apply an expiratory hold
When auto-PEEP is present, the expiratory flow does not return to zero before the next breath is delivered (the patient is not done exhaling the last breath when the next one is applied)
Which waveform typically contains the least information that would lead to alteration of ventilator settings?
Of the three standard scalar waveforms, the volume tracing typically contains the least information that would lead to alteration of ventilator settings because most ventilators that can display graphic outputs also provide numeric outputs
Usually rely on the numeric output of tidal volume and spend more time inspecting the other two scalars
What can the volume scalar provide information about?
Volume scalar can provide a rapid qualitative picture of the relative size of spontaneous and mandatory breaths during SIMV or of patient effort during CPAP breathing
Volume and Flow Waveforms
Volume waveform is inextricably linked to the flow waveform, one parameter is generally derived from the other
In many modern ventilators, the circuit flow is determined (often via a flow disruptor and differential pressure transducer) and it is the flow signal over time that is used to calculate the delivered or exhaled volume
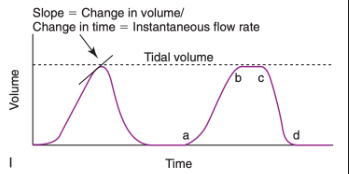
Instantaneous Flow Rate Equation
Instantaneous Flow Rate = delta V/delta t
Determining the Instantaneous Flow Rate from the Volume Tracing
When you look at the volume tracing, you can see that the slope of the curve at any point reflects the instantaneous flow rate (delta V/delta t) (shown in 33-10I)
Between a and b, the slope is large and positive so the flow scalar should have a large positive deflection at this same point
Between b and c, the slope of the volume waveform is zero, so volume is unchanging and a corresponding zero flow period is expected on the flow scalar
Between c and d, you would expect to see a large negative deflection on the flow scalar to reflect the rapidly decreasing volume in the circuit
Tidal volume can also be determined from inspection of the volume scalar
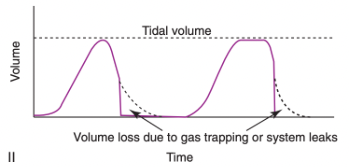
What does a volume wave form that takes a vertical plunge straight to baseline in the mid-to late expiratory phase indicate?
Volume loss due to gas trapping or system leaks
In 33-10II, a volume waveform that takes a vertical plunge straight to baseline in the mid-to late-expiratory phase indicates that more volume came in across the flow sensor that ultimately came back
This can mean that there is a leak in the circuit or that a given volume of gas has unexpectedly remained within the patient (e.g. gas trapping or unidirectional flow into the pleural cavity)
Pressure-Volume Loops (PV loops)
Pressure-volume loops (PV loops) are graphic representations of the dynamic interconnection between changes in circuit pressure and circuit volume
Used for assessment of lung mechanics in ventilator patients and designing protective lung strategies for the support of ARDS patients
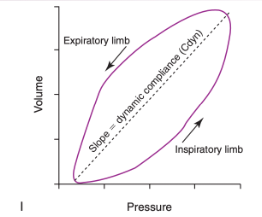
What does the slope of the pressure volume curve represent?
Dynamic compliance (Cdyn)
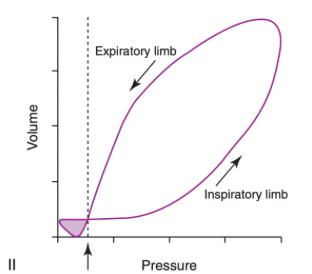
Typical Pressure Volume Loop for a Mandatory, Machine-Delivered Breath
Because the patient is receiving IPPV, inflation of the lungs corresponds with a rise in circuit pressure (inspiratory limb)
In a spontaneously breathing patient (or one in a negative pressure ventilator/iron lung), the addition of volume to the circuit would be associated with a decrease in circuit pressure and so the tracing of the loop would be in a counterclockwise direction
Important features of I
The loop does not begin at a pressure value of zero - indicates the patient is on PEEP
The pressure and volume values recorded at the highest value of the loop (upper right hand area of the plot) would correspond to PIP and tidal volume, respectively

Dynamic Compliance on the Pressure Volume Curve
A dashed line connecting the two points at which volume is not changing is added
This line connects the starting and end-inspiratory points
No significant circuit flow is occurring at these points so the pressure value largely reflects that required to distend the lung to that volume and not the additional pressure required to overcome airway and circuit resistance
The bowing of the inspiratory limb away from this line reflects the additional pressure required to overcome these resistances
The slope of this line is a measure of pulmonary compliance
Because intrapulmonary flows have not been given enough time to cease, this form of compliance would be termed dynamic compliance (Cdyn) rather than static compliance
Patient-Triggered PV Loop
"Figure eight" type of loop is typical of patient effort
In this case the patient effort is triggering/initiating activity so the small loop lies in the lower left aspect of the tracing (shaded area)
Patient-ventilator dyssynchrony may result in small patient-generated loops at other points in the tracing (e.g. the expiratory limb)
The dashed vertical line and arrow indicate the PEEP value
Note that the patient efforts bring airway pressure below this resting value
Once the triggering threshold is reached, a machine-delivered breath proceeds
The size of the shaded area of the patient effort loop indicates the work done by the patient to trigger the breath
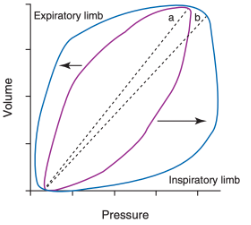
What does loop B indicate in reference to loop A?
Purple loop is the initial tracing
Blue loop shows the changes expected to occur with an increase in airway or circuit resistances
Loop bows out farther from the dynamic compliance line, indicating that relatively greater applied pressure is required to overcome resistance and reach a given volume
The Cdyn (indicated by the slope of the line) has decreased
Unlike static compliance, the value of Cdyn is altered by changes in resistance because flow is not allowed to cease entirely
What should increased bowing of the PV loop prompt?
Increased bowing of the PV loop should prompt the clinician to investigate whether the endotracheal tube is kinked or obstructed, heat-moisture exchanger occlusion has occurred, or airway suctioning or bronchodilator administration is needed
Compliance changes also alter the shape and position of PV loops
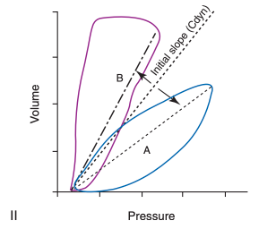
What do these loops indicate?
A reduction in compliance (e.g. pulmonary edema develops) causes the PV loop to rotate (labeled "a") as if its starting point was anchored and the loop rotated toward the x axis
If compliance increases (e.g. edema resolves) the loop moves as if its starting point was anchored and the loop rotated toward the y-axis (labeled "B")
Change in compliance can be appreciated by the significant alteration in the slopes of the Cdyn lines
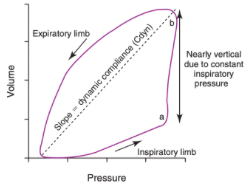
What causes this loop?
Providing the same tidal volume with more rapid flow rates will result in increased bowing of the loop away from the compliance line
In pressure control modes, the latter portion of the inspiratory limb can appear nearly vertical as constant inspiratory pressure is maintained
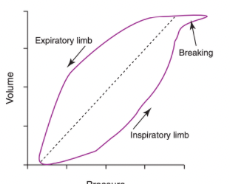
What does beaking indicate?
Excessively large tidal volumes can lead to alveolar overdistension and "beaking" of the terminal portion of the inspiratory limb
Beaking reflects further increases in circuit pressure with minimal additional volume increase
This shape is assumed once the alveoli have been expanded excessively and can only accept additional volume with large pressure increases
Lower Inflection Point
Lower inflection point (LIP) reflects a point at which pulmonary compliance significantly increases
Thought to be the point at which a number of collapsed conducting and/or gas exchange units open
The cyclic opening and closing of these areas can lead to significant pulmonary damage (atelectrauma)
Atelectrauma can be minimized by increasing PEEP to a value greater or equal to the value at which the LIP is observed
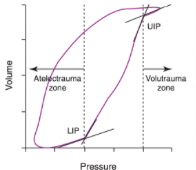
Upper Inflection Point
The upper inflection point (UIP) reflects the point at which pulmonary compliance significantly decreases because of alveolar overdistension and risk of alveolar injury (volutrauma) is increased
It is generally advised to keep PIP below the pressure at which the UIP is noted

Artifactual Beaking
In small patients (<2 kg) the flow signal (and thus volume changes) may be difficult to acquire for all but the most sensitive equipment
When the monitoring equipment can't acquire a signal, many models will continue to plot the last recorded value
The plot of a rising pressure with an absolutely constant volume will result in a sharp, narrow horizontal beak at end inspiration where flow is lowest
This signal acquisition artifact can mimic true beaking in these small patients
Remember that biologic processes rarely result in biophysical relationships that are absolutely linear in nature
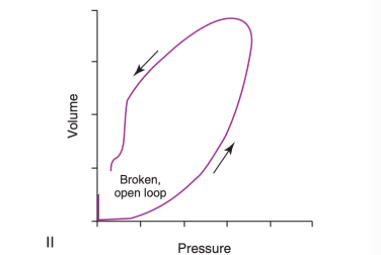
What does this loop indicate?
Shows an open, broken, incomplete loop that is typical of a circuit leak
Monitoring for leaks is important for ensuring proper cuff inflation, ensuring delivery of targeted tidal volume, and alerting to the possibility of air leakage from the respiratory tract to the pleural space
How are flow-volume loops related to the flow scalar?
The inspiratory and expiratory limbs should roughly match the shape of the flow scalar portions above and below the x-axis respectively
The morphology of the wave-forms will not match precisely because one is plotting flow against time and the other time against volume, but the waveforms should be qualitatively similar
What can be assessed via flow-volume loops?
Flow-volume loops are particularly important in the assessment of excessive airway resistance and in alerting the clinician to the presence of copious airway secretions or circuit leaks
Flow asynchrony can also be detected via flow-volume loops
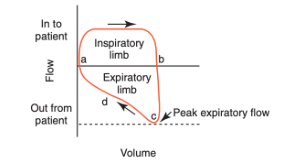
What do the labels stand for?
A - start of inspiration
A-b - inspiration
B - end of inspiration
Overall shape of the inspiratory limb is square, suggesting a constant flow volume control mode is being employed in this instance
B-c begins expiratory limb
Peak expiratory flow is achieved early in exhalation and is patient effort dependent (usually not relevant in anesthetized patients on full assist-control ventilation)
After peak flow is achieved, the expiratory limb tracing progresses to the effort-independent portion of the curve (d)
D - most relevant to the assessment of airway resistance (Raw) changes, although peak flow is often altered as well


What does scooping indicate?
In the case of a significant increase in Raw, a "scooped out" appearance of the mid-to-late portion of the expiratory limb is noted with an accompanying reduction in peak expiratory flow
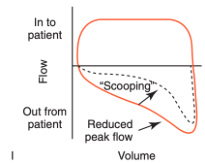
What should scooping prompt?
Should prompt the clinician to investigate whether airway suctioning or bronchodilator administration is needed
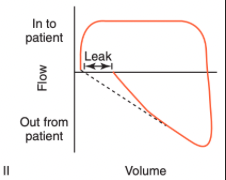
What does a broken flow-volume loop indicate?
The key feature is that the inspiratory and expiratory volumes are not equivalent
The effect of a circuit leak on a flow-volume loop is to create a broken, incomplete appearance
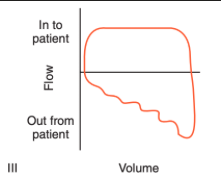
What does this indicate?
Excessive airway secretions
Saw-tooth appearance to the effort-independent portion of the expiratory limb
This finding (along with auscultation of the trachea) is considered one of the most reliable indicators of the need for tracheal suction, whereas auscultation of crackles over the thorax is less predictive of suctioning need
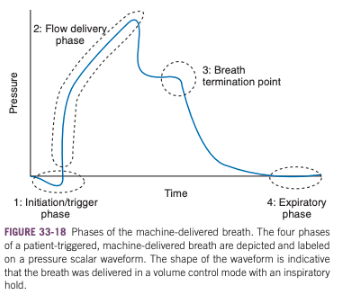
What are the four phases of the ventilator patient’s respiratory cycle?
Initiation/trigger phase
Flow delivery phase
Breath termination point
Expiratory pahse
What is patient ventilator dyssyncrony during phase 1 called?
Trigger asynchrony
What is the most common form of patient ventilator dyssynchrony in people?
Trigger asynchrony
What are the predominant types of trigger asynchrony?
Ineffective triggering
Auto-triggering
Double triggering
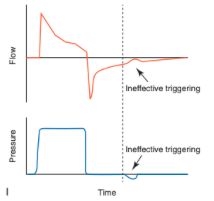
Ineffective Triggering
Involves a patient-generated decrease in airway pressure with a simultaneous increase in airflow without triggering a machine-delivered breath
Often the result of an inappropriately set sensitivity setting on the ventilator
Increasing levels of pressure support suppress respiratory drive and lead to increased frequency of ineffective triggering
Triggering delay and ineffective triggering are often easier to identify on the flow scalar than on the pressure scalar because of the larger relative change in that parameter (i.e. bigger relative change in flow than pressure with ineffective efforts to trigger inspiration)
When ineffective triggering is detected, look for evidence of an improper triggering threshold, auto-PEEP (PEEPi), significant muscle weakness/fatigue, reduced respiratory drive, or an excessively deep level of anesthesia
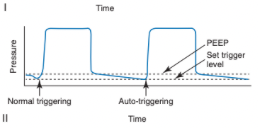
Auto-Triggering
Occurs when a breath is delivered by the ventilator because of a change in airway pressure or flow not caused by patient effort
Most often due to an inappropriately small threshold/sensitivity setting
Alternatively, flow or pressure distortions may be due to other factors, including circuit leaks, fluid/secretions within the circuit, or cardiac oscillations
Auto-triggering is more common when there are prolonged periods of no expiratory flow between breaths
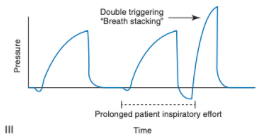
Double-Triggering
Two delivered breaths separated by an expiratory time less than half the mean expiratory time
Occurs when a patient's inspiratory effort continues throughout the ventilator's preset I-time and thus remains present after the I-time has been completed
This prolonged effort triggers another breath
End result is the patient receiving a tidal volume twice the desired or preset size
Carries the risk of overdistension and alveolar trauma
May be due to exceptionally high ventilatory demand on the part of the patient, low tidal volumes, an I-time that is too short, or a flow-cycle threshold set too high
Flow Asynchrony
Result of ventilator supply of fresh gas to the inspiratory circuit that is either too fast or too slow for the individual patient
May be recognized using ventilator waveforms during either volume control or pressure control but manifests somewhat differently in each circumstance
What does this indicate?
Flow asynchrony
What does this indicate?
Flow asynchrony
What should identification of flow asynchrony prompt?
Should prompt the clinician to increase inspiratory flow until the two types of breaths have similar appearing waveforms
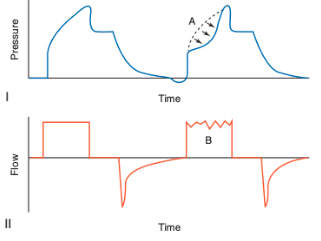
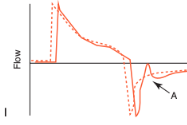
What does flow asynchrony look like in volume controlled modes?
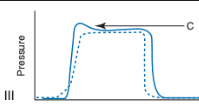
In volume-controlled modes with constant inspiratory flow rates, it is easiest to detect flow asynchrony by comparing passive and patient-triggered breaths on both the pressure and flow scalars
In patients with flow asynchrony the triggered breaths will often have a "scooped out" concave appearance on the upswing of the pressure tracing (A) and a saw-tooth appearance to the plateau phase of the flow tracing (B) relative to the convex mandatory breaths
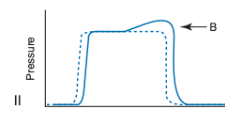
What does flow asynchrony look like in pressure controlled modes?
In pressure control (with variable inspiratory flow), look at the pressure-time scalar
When inspiratory flow is inadequate, the pressure-time scalar will assume a "scooped out" appearance during the inspiratory plateau
When inspiratory flow is excessive, may see an early overshoot in the airway pressure waveform
Adjust rise time in this setting until the pressure waveforms appear nearly square, have no plateau concavity, and show no evidence of overshoot
What causes this?
Flow asynchrony
What are the two main types of termination asynchrony?
Inspiration being terminated too early, premature cycling
Inspiration being terminated too late, delayed cycling
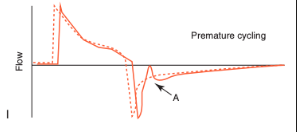
Premature Cycling
Patient is continuing to make inspiratory efforts at the time the ventilator cycles off
May be associated with double-triggering if the inspiratory efforts are sufficient to trigger a second breath after the first has been terminated
May be detected by visualizing an abrupt initial reversal in the expiratory flow waveform (often with a concurrent concavity in the pressure waveform)
Increasing I-time or tidal volume should address premature termination
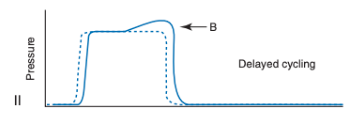
Delayed Cycling
The patient initiates active expiratory efforts while the ventilator is continuing to deliver inspiratory flow
Manifests as a pressure spike on the pressure scalar during mid to late inspiration
On the flow scalar, shows as an abrupt, rapid decline in inspiratory flow near end-inspiration
Managed by reducing I-time or tidal volumes
Important not to confuse the early plateau change seen with flow asynchrony and the late plateau change seen with delayed cycling because the adjustments needed to address these are very different
What does this indicate?
Premature cycling
What does this indicate?
Delayed cycling
Expiratory Asynchrony
Typically manifests as auto-PEEP (gas trapping)
If auto-PEEP is detected, a number of parameters may be adjusted, nearly all of which serve to prolong expiratory time (e.g. trigger sensitivity, peak flow, flow pattern, rise time, I-time, cycle threshold, I/E ratio, and respiratory rate)
Auto-PEEP increases the difficulty the patient faces in reaching the triggering threshold
Increasing PEEP to account for auto-PEEP may improve triggering sensitivity and efficacy