Stat 240 Midterm 2
1/42
There's no tags or description
Looks like no tags are added yet.
Name | Mastery | Learn | Test | Matching | Spaced | Call with Kai |
|---|
No analytics yet
Send a link to your students to track their progress
43 Terms
N(0,1)
Binomial Distribution
Discrete: Variance Formula
sum(probaility in decimals(values - mean)²)
The length, in seconds, of the lecture recording for a specific lecture. Pretend you only know the length to the nearest round second.
We would almost certainly treat this as a continuous variable. While it is technically discrete, there are so many possibilities that it doesn’t make sense to care about each individual count. Furthermore, we know that despite measurement only going to the nearest second, it actually could be measured to further precision, meaning continuous makes the most sense here.
Then, create a dataframe with one row for each different value of base_minutes, and a column n for how many times that value of base_minutes occurs.
Finally, create a percent variable by dividing n by the total number of lectures.
lectures %>%
count(base_minutes) %>%
mutate(percent = n/sum(n))
Continuous Graph
All X’s are plotted, even if there are missing values
Discrete Graph
If missing values, it will be skipped
Interpret confidence intervals
“We are _% confident that the true proportion/mean/value of (real-life meaningful description of parameter) is between A and B.”
B in BINS (ON EXAM WRITE OUT EVERY BINS!!!) for x
Binary Outcome-Each trial is either a success or failure
I in BINS for x
Independent-an event doesn’t affect the likelyhhood of another event. Ex: replacing or putting back tambola numbers (I-India-tambola)
N- BINS for x
N-fixed number of trials
S-Same probs, and give an example on how it will violate the binomial distribution? for x
Every chance must be -. Ex: Coin is 50/50, bbal players NOT binomial
CLT Q: X binom(10,0.3) find distib of average of 50 sample of X
X Bar(mu=n*p, st.dev/sqrt(n)) mu=
Four buckets each contain a total of five tokens each, some red and some blue. The number of red tokens in the buckets are 1, 2, 3, and 4 with blue tokens making up the remainder. One token is drawn at random from each bucket.
Violates S in BINS, bc red isn’t the same probability for all 4 buckets.
X∼Binomial(15,0.2) Find mean, variance, standard deviation,
Mu= n*p
Variance=np(1-p)= 15×0.2(0.8)
St. Dev=sqrt(np(1-p))=sqrt of above
The Empirical rule says 99.7% within three standard deviations from the mean. Calculate these probabilities for Normal(0,1)Normal(0,1) and print a data set containing all those values.
pnorm(3,0,1)-pnorm(-3,0,1)
This distribution is always symmetric. T/F for Binomial
F-depends on p, if it’s closer to 0=left skewed.
If μ is the mean of the distribution, then it is possible for the probability of getting exactly μ
on a random draw to be 0. T/F for normal and binomial
For binomial this is true if mean is non-integer (decimal) not possible bc you can’t have decimals in discrete. For normal, can’t predict porbs at a point so it’s always 0.
CS: P(|X| > 0.75)
pnorm(-0.75) + pnorm(0.75, lower.tail = F)We wish to test whether the average person is shorter than the average NBA player. We have data for the whole population of NBA players and know their average height to be 6’6” (78 inches). Let the average height of a non-player be μ𝜇.
(a) What are the null and alternative hypotheses for this test?
You would start by stating both the null and alternative hypotheses.
First sentence: Null hypo since p-value is calculated based on it.
Then: Ha and state if we either have evidence for the alternative.

(a) We sample 5 non-players and get the heights (70, 61, 63, 65, 72). What is the sample mean? What is the probability of getting a sample mean smaller than this on the distribution from problem 2?
pnorm(66.2, 78, 4/sqrt(5))(b) What do we conclude about the average height of non-players compared to the average height of an NBA player? Are we completely 100% certain of that conclusion?
If the average person is as tall as the average NBA player, then observing a sample mean of 66.2 is incredibly unlikely. Thus, we have strong evidence that the average person is shorter than the average NBA player. We cannot be 100% certain of this conclusion, but a smaller p-value gives us more certainty.
State: Null, wether we accept it or reject it. State Ha and mention it’s not 100% certain bc of the small p-value.
Critical Value Formula Ex:
c+(1-c)/2
P-value<significance value (1-confidence level)
Strong evidence against null hypothesis and accepting alternative.
Ex; There is strong evidence that…
How to find z-score in R: Male bears weight is approximated by a normal distribution with mean 510 pounds and standard deviation 45 pounds. Female bears in the continental by a normal distribution with mean 315 pounds and standard deviation 37 pounds.
Suppose a male grizzly bear that is 441 pounds is observed. What would be the approximate weight of a female bear with the same weight percentile as this male bear?
pnorm(441, 510, 45) %>%
qnorm(mean = 315, sd = 37)When to do 1-?
Only for p-binom greater than
Coin flip p is?
0.5
Binomial to normal: Mean and st. dev formula:
Mean= n* p
St. dev=sqrt(np(1-p))
P-value>0.05 or alpha, what do we do with Ho?
We fail to reject the null hypothesis that due to not enough evidence.
What does alpha represent in confidence intevral?
The amount we aren’t sure about. Ex: 95% confidence = 5% unsure about
How to find critical value with alpha
qnorm(1-alpha/2) for 2-sided confidence intevral - upper AND lower bounds
1-alpha for just one bound
(a) A small child reaches in and pulls out three Reese’s candy bars. What is the probability that all three of their three candies were Reese’s by random chance? (Assume candy bar draws are independent and all have equal probability of being a Reese’s.)
Find P(X=3)
pbinom(2, 3, 0.25, lower.tail = F)
Part c If we took a random sample of 250 men, how likely is it that the sample mean of their heights would be within 0.5 inches of the population mean of 70 inches (between 69.5 and 70.5 inches)?
pnorm(70.5, 70, 3/sqrt(250)) - pnorm(69.5, 70, 3/sqrt(250))(d) Let (0.346, 0.354) be the 95%95% confidence interval for the actual probability of getting a head with this coin. Does this confidence interval support your findings from part (c)? prob<0.5 in Ha
bc 0.5 isnt in interval, it confirms actual p val is less than 0.5
How can we find point estimate using predict:
HINT: lm() and predict() and newdata
lions_model = lm(x~y, dataset)
predict(lions_model, NEWDATA = tibble (age = 5))
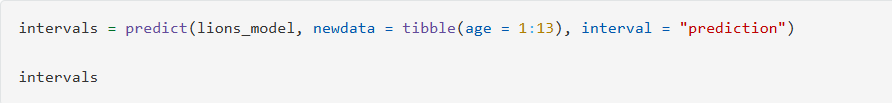
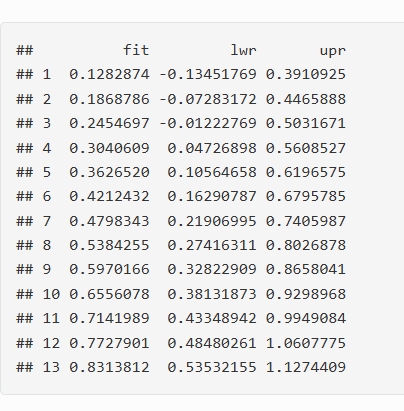
Ex on how to use predict to find interval:
Interpret it!!!
We are 95% confident that the percentage of nose which is black for a lion that is 5 years old will be between 10.5% and 61.9%.