Descriptive Statistics
1/25
There's no tags or description
Looks like no tags are added yet.
Name | Mastery | Learn | Test | Matching | Spaced | Call with Kai |
|---|
No analytics yet
Send a link to your students to track their progress
26 Terms
Descriptive Statistics
Lexicon: Have the purpose of reducing the complexity of a set or distribution og numbers by summarizing the information it contains
backstory of descriptive statistics
for analysis and comparison we assign numeric values which enables us to compare conditions directly and objectively on the DV scores - without we cannot discuss the results of an investigation IN WORDS.
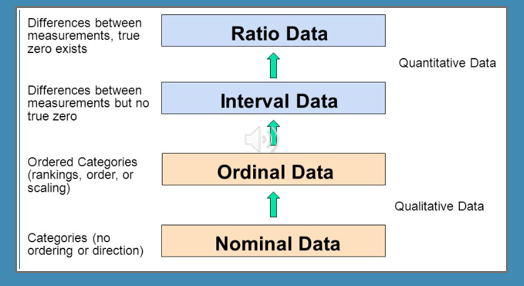
Scales of measurement
nominal
ordinal
cardinal (interval and ratio)
Nominal scales
positions are marked by names not numbers
ex. personality type, choice of major
note** numbers may be assigned for the purposes of aiding analysis (coding male and female as 1 & 2) but they are not associated with direction or size
Ordinal scales
provides info about order
specifically direction - however the size is unspecified
ex. Likert scales
Cardinal scales
provides both SIZE AND DIRECTION differences
3a. Interval
equally spaced, no true xero (temperature)
3b. Ratio scale
equally spaced AND they have a true zero (negative scores not possible)
Statistics order of importance
1. Know what is the logical basis of statistics in research.
2. Know why we use statistics in psychological research.
3. Know which statistical techniques are used for different purposes.
4. Know how to apply a few simple statistical procedures.
Hierarchy of information
Frequency Distributions
display frequencies of every score, or value received by subjects
allows immediate recognition if there are any strange or unusual values in your data and allows you to quickly spot most commonly occurring scores
can be formatted in tables, graphs, histograms, charts, etc.
2 kinds of statistics
descriptive
inferential
Descriptive Statistics
calculated first
LEXICON: D.S. have the purpose or reducing the complexity of a set or distribution of numbers by summarizing the information it contains
allows us to readily and quickly see average patterns
nothing to say about population, restricted to the sample
Choice of which descriptive statistic to use depends on:
the scale of measurement of your variables
which aspect of your results you wish to describe
Three characteristics of a distributions of scores or observations that researchers wish to describe
central tendency
variability
correlation
Central tendency
refers to the TYPICAL or CENTRAL score of distribution of scores. There are a number of ways to represent central tendency:
mean, median, mode
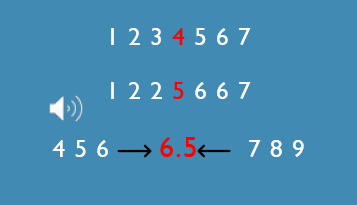
Mode
most frequently occurring score - the high point of distribution scores
insensitive measure of central tendency
nominal or ordinal data is a good choice
Median
the MID-POINT of a distribution, the value at which ½ the scores fall above and the other ½ fall below.
we first need to rank order the scores and then find the middle score if odd, or the middle 2 values and the halfway between that if even
median is more sensitive to changed values
merely shifts in the direction of the new addition but still changes by the same amount
good choice for ordinal data
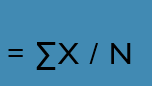
Mean
Described as the balance point of distribution
calculated by taking the sum of all values and dividing it by the total number of values
Most sensitive - good choice for cardinal data
Variability
dispersion reflects the degree to which the values of a distribution are concentrated near the center or scattered along the dimension of measurement
there are different ways to measure variability: range, standard deviation and variance
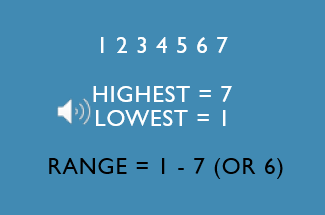
Range
the difference between the highest and lowest scores (max-min)
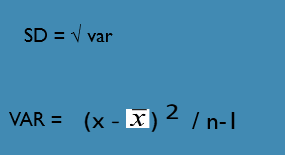
Standard Deviation and Variance
S.D. is the square root of the variance
S.D. is the average deviation of scores from the mean in units of the variable
variance is the standard deviation value squared and no longer in the units of the variable.
The larger the S.D. and the variance the “fatter” the distribution
Correlation
LEXICON: an index of the strength and direction of association between variables
The algebraic sign (+/-) indicates direction -- whether larger values on one variable tend to go with larger or smaller values on the other variable.
The numerical size indicates strength -- whether differences on one variable account for a little or a lot of the differences on the other variable.
Size of the correlation coefficient ranges from zero (absence of association) to +/-1.00 (perfect association).
Negative 1.00 = perfect negative association. As one variable increases, the other variable decreases.
Positive 1.00 = perfect positive association. As one variable increases, the other variable increases also and vice-versa (as one variable decreases, the other variable decreases also).
There are several DIFFERENT TYPES of correlation coefficients, depending upon the characteristics of the data. The most common one is PEARSON’S ‘r’ coefficient which is used to represent the strength and direction of a LINEAR ASSOCIATION between two variables.
When the association between the variables in question is NON LINEAR correlation coefficients OTHER THAN Pearson’s r are often used. We will not be considering these coefficients for our purposes, rather we are making the assumption that the variables we are assessing are in fact, linearly related.
The way to determine what kind of shape your relationship has (and therefore which correlation coefficient to use to represent it) is to plot the scores on a SCATTERPLOT. A SCATTERPLOT is a plot of the 2 variables of interest. Values on one variable are plotted on the X axis and values on the second variable are plotted on the Y axis, creating a plot that represents each PAIR OF VALUES. This will show you whether the relationship between the variables is in fact linear or non-linear.
*Note: The terms “correlation coefficient” and “correlational study” are related in that they both refer to a situation in which predictive relationships, not causal relationships between variables are assessed. However, one is a mathematical construct (coefficient) and the other is a descriptive construct.
Individual position
something about individual position
scoring a 70 on an exam is good but it is important to know the range, the mean and other things to determine whether you should be happy or sad for your friend
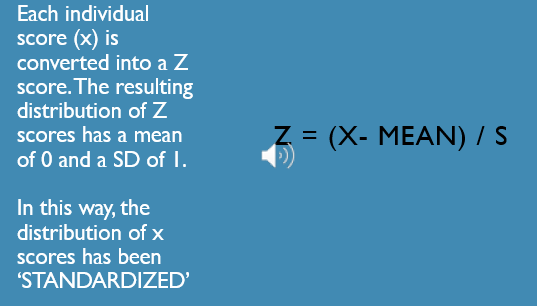
Z score
So how can these three bits of information (individual score, mean score, dispersion of scores) be wrapped into a single descriptive statistic? That’s where the Z-score or ‘standard score’ comes in. Each individual score can be transformed into a Z score:
Z = (x- mean) / S
where s is the standard deviation of scores and ’mean’ is the mean of the distribution of scores from which x came, and x is the individual score of interest.
(x - mean) means to subtract the mean from each value in the distribution. This is equivalent to sliding the frequency distribution along the X axis SUCH THAT ITS MEAN IS ZERO - regardless of where the distribution was initially located.
Notice that the shape of the distribution is unchanged by this transformation.
Dividing by s means to squeeze or stretch the distribution such that the resulting distribution has a STANDARD DEVIATION OF 1, regardless of what the standard deviation was originally.
Once these transformations have been made, the resulting distribution has a mean of 0 and a standard deviation of 1.
Instead of the value of the original variable along the x-axis, we now have something called a z-score along the x-axis.
We have in effect, STANDARDIZED the original distribution such that, regardless of its original mean and standard deviation, it will have a mean of 0, a standard deviation of 1, and its scores will be in z-units. Now this distribution can be compared directly to any other distribution that has been treated in the same way.
A Z-score is an index of how far an individual score is away from the mean score (in standard deviation units). A Z-score takes into account the average score and the relative variability of the other scores in the distribution. Standardizing scores in this way allows us to COMPARE scores from different distributions.
You can think of this as loosely ANALOGOUS to allowing us to compare apples oranges by converting both to bananas. Once the values of both commodities (apples and oranges) have been converted into the same currency (bananas) so to speak, they can be directly compared. In this way for example we can compare the individual exam scores taken from two different Psychology 202 classes.
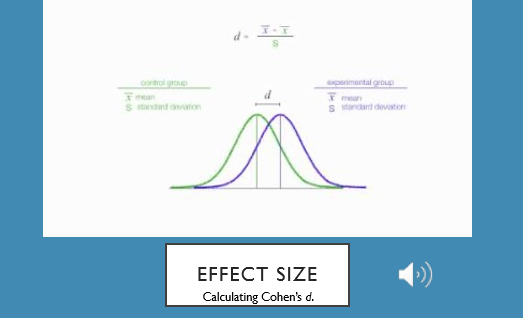
Effect size
Just knowing that the treatment or intervention we implemented in our experimental group had an effect---that is, knowing that the average DV score in group 1 was bigger than the average DV score in group 2---but we really want to know something about HOW MUCH BIGGER the average DV score of group 1 was than the average score of group 2. In other words, we want to know what the EFFECT SIZE of our intervention or treatment was. When the DV is a continuous variable, we can measure EFFECT SIZE using a statistic called a Cohen’s d.
Cohen’s d is the mean difference between the 2 groups on the DV expressed in standard deviation units.