AP Stats Unit 1B
 Call Kai
 Learn
Learn Practice Test
 Spaced Repetition
 Match
Match Flashcards
 Knowt Play
1/28

Earn XP
Description and Tags
summarizing data
Name | Mastery | Learn | Test | Matching | Spaced | Call with Kai | Chat |
|---|
No analytics yet
Send a link to your students to track their progress
29 Terms
parameter
fixed value about a population, typically unknown
ex. the mean length of all the fish in all of Lake Lewisville
statistic
value calculated from a sample
ex. the mean length of the sample collected of fish from Lake Lewisville
mean
arithmetic average
use μ to represent a population mean
use bar x to represent a sample mean
derivations from mean in a data set should all…
add up to zero
resistant meaning
statistical values that are not affected by extreme values
median is resistant
mean is not resistant
in a symmetrical distribution, mean and median are; which one to use
equal; you should use the mean in sym dist.
in a skewed distribution, mean and median are; which one to use
the mean is pulled in the direction of the skewness; you should use the median in skew dist.
trimmed mean; how to calculate
purpose is to remove outliers from a data set
to calc a trimmed mean:
multiply the percent to trim by n
truncate that many observations from BOTH ends of the distribution (when listed in order)
calculate the mean with the shortened with the shortened data set
value used to describe categorical data
p-hat (p̂) = x / n
used to represent the sample proportion; It measures the fraction or percentage of items in a specific sample that share a particular trait (called a "success")
the study of variability is important bc…
there is variability in virtually everything, allows us to distinguish between usual & unusual values, reporting only a measure of center doesn’t provide a complete picture of the distribution
simplest numeric measurement of variability
range
another measure of variability (using mean)
deviations from mean (x-x̄)
variance
estimated average of the deviations squared
s² for sample variance (remember to n-1 in denominator)
σ² for population variance
square root of variance = standard deviation
ex. s² = 6.28 in² ; s = 2.608 in
fish in sample can deviate from mean of 6 by an average of 2.608 inches
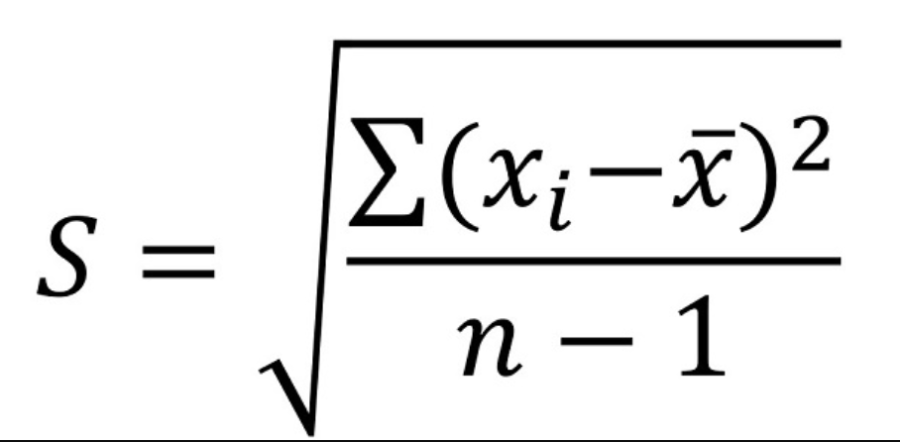
most common used measures of center and variability
mean and standard deviation, respectively
degrees of freedom (df)
the number of independent observations that are free to vary
ex. we consider the sample of 6 fish where the mean is 6 inches, five of these values are freed to be any possible length of fish; but once these five values occur, the sixth value is no longer free to vary (it must be a specific value in order for the derivations from the mean [of 6] to have a sum of zero)
sample of n; how to find DOF
n-1; n-1 observations are free to vary
IQR
the range of the middle half of the data: Q3 - Q1
IQR is akin to median as SD is to the mean
advantage of IQR to SD: IQR is resistant to extreme values
boxplot advantages
ease of construction, convenient handling of outliers, construction is not subjective (like histograms)
used with medium or large size data sets (n ≥ 10)
useful for comparative displays
boxplots overview
when to use: univariate numerical data; moderate to large data sets (no under 10s)
how to construct (skeleton boxplot)
calculate the five number summary
draw a horizontal (or vertical scale)
construct a rectangular box from the lower quartile (Q1) to the upper quartile (Q3)
divide the box with a line representing the median
draw lines from the lower quartile to the smallest observation and from the upper quartile to the largest observation
to describe
comment on the center, spread, and shape of the distribution and if there are any unusual features
identifying and displaying outliers (modified boxplots)
1.5(IQR) method: outlier exists if it is more than 1.5(IQR) away from the nearest quartile
Q1 - 1.5(IQR) and Q3 + 1.5(IQR)
resulting values are the “fences” and any value above the upper fence or below the lower fence are outlies
whiskers extend to largest (or smallest) data observation that is not an outlier
mark outlier as asterisk
symmetrical boxplots vs approx symmetrical boxplot vs skewed
sym: you can’t tell how many modes there are
aprox sym: if the lower half of the range and the upper half of the range in the distribution is approx equal, it is approx symmetrical
skewed: range of the two halves definitely different sizes, so it would be skewed in the direction of the longest side
example CUSS and BS for comparing distributions
The Laker’s salaries have a higher median ($5M) than the Nuggts ($3M), and a larger range than the Nuggets (~$20M is greater than $15M). Both salary distributinos are skewed right, the Lakers have an outlier at ~23 while Nuggets have no outliers
remember comparative language and values
example FRQ talking about outliers
Yes, 47% of residents having a college degree is an outlier since it is larger than the upper fence therefore is an outlier, there are no values below the lower fence
Normal Curve
bell shaped, symmetrical, unimodal curve
transition points happen cupping upward and downward occur at μ ± σ
as the standard deviation increases, the curve flattens and spreads
as the standard deviation decreases, the curve gets taller and thinner
empirical rule (only for normal distributions [bell])
approx 68% of the observations are within 1 SD of the mean
approx 95% of the observations are within 2 SD of the mean
approx 99.7% of the observations are within 3 SD of the mean
z score
z-score = (value-mean)/SD
z score tells us how many standard deviations the value is from the mean
ex. -2.3 is 2.3 standard deviations below the mean
1.8 is 1.8 SD above mean
percentiles - measures of relative standing
a percentile is a value in the data set where r percent of the observations fall AT or BELOW that value
linear transformation rule
when adding a constant to a random variable, the mean changes but not the standard deviation
when multiplying a constant to a random variable, the mean and the SD changes
rules for combining two variables
to find the mean for the sum (or difference), add (or subtract) the two means
to find the standard deviation of the sum (or differences), always add the variances (squared version), then take the square root