Correlation
1/52
There's no tags or description
Looks like no tags are added yet.
Name | Mastery | Learn | Test | Matching | Spaced |
|---|
No study sessions yet.
53 Terms
Is correlational research an experimental or non-experimental method?
Non-experimental
Correlational research describes:
The relationship between two or more variables
What is the first step toward predicting behavior?
Describing it
Naturalistic observations and surveys often show us that:
One trait or behavior tends to coincide with another
When one trait or behavior coincides with another, we say that the two:
Correlate
A measure of the extent to which two factors vary together, and thus of how well either factor predicts the other
Correlation
What can reveal how strongly two variables are related?
Scatterplots
Each dot in a scatterplot represents:
The values of two variables
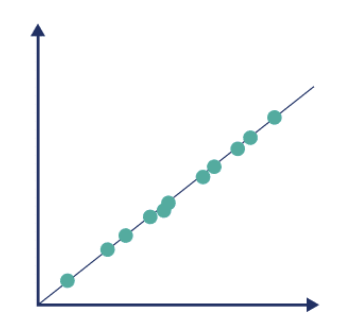
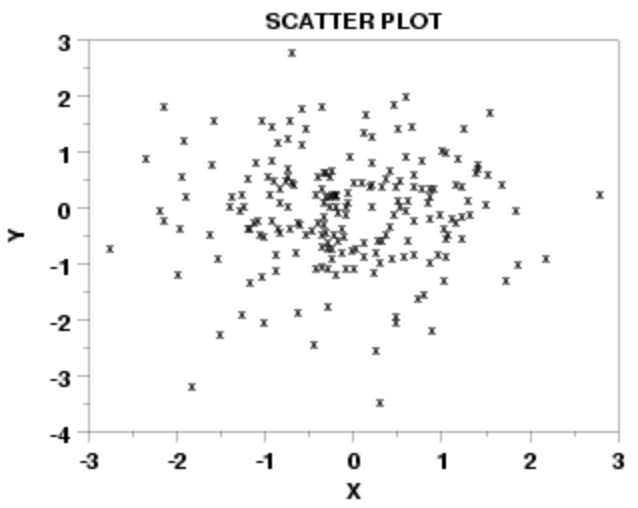
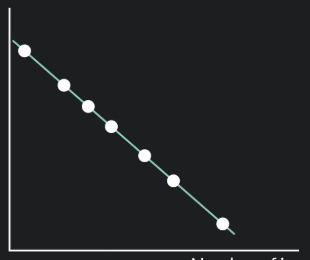
Types of correlations on scatterplots:
Perfect positive, no relationship, perfect negative
Graph of perfect positive correlation:
Graph of no relationship:
Graph of perfect negative correlation:
r value of perfect positive correlation:
+1.00
r value of no relationship:
0.00
r value of perfect negative correlation:
-1.00
r values can range from:
+1.00 to -1.00
r value is +1.00 when:
Scores for one variable increase in direct proportion to scores for another variable
r value is -1.00 when:
Scores for one variable decrease precisely as scores for the other variable rise
Are perfect correlations rare in the real world?
Yes
Does a negative correlation mean that it is not strong?
No
Is a negative correlation bad?
No
Example of a perfect negative correlation:
People’s height vs distance from their head to the ceiling
Statistics can reveal:
What we might miss with casual observation
Example of how statistics reveal what we might miss with casual observation:
We can easily see evidence of gender discrimination when given statistically summarized information about job level, seniority, performance, gender, and salary, but not when the information dribbles in case by case
What do single events or individuals do to us?
Catch our attention
When especially do single events or individuals catch our attention?
When we want to see (or deny) bias
How do statistics calculate patterns?
By counting every case equally
Two problems with correlational research:
Directionality and third variable problem
What does directionality problem mean?
Correlational research cannot tell us which variable is the cause and which one is the effect
Example of directionality and third variable problem:
If mental illness correlates with smoking, it could be smoking that leads to mental illness or mental illness to leads to smoking, or a third variable, like a stressful home life, that causes both smoking and mental illness
Benefits of correlations:
Make clear relationships we might miss, and keep us from falsely assuming a relationship exists when there is none
A statistical index of the relationship between two variables:
Correlation coefficient
Anything that can vary and is feasible and ethical to measure:
Variable
A graphed luster of dots, each of which represents the values of two variables:
Scatterplot
The slope of the points on a scatterplot suggests the:
Direction of the relationship between the two variables
The amount of scatter on a scatterplot suggests:
The strength of the correlation
Little scatter indicates high or low correlation?
High
Illusory correlations happen when:
We believe that there is a relationship between two things
What happens when we believe that there is a relationship between two things?
We may notice and recall confirming instances more than disconfiming instances
Perceiving a relationship where none exists, or perceiving a stronger-than-actual relationship
Illusory correlation
Example of illusory correlation:
If we believe that dreams forecast actual events, we may notice and recall confirming stances more than disconfirming instances
Illusory correlations cause us to feel that:
We can personally influence chance events
Example of how illusory correlations cause us to feel that we can personally influence chance events:
If gamblers remember only past lucky rolls, they may believe that they influenced the roll of the dice by throwing gently for low numbers and hard for high numbers
The illusion that uncontrollable events correlate with our actions is caused by:
Illusory correlations and regression towards the mean
The tendency for extreme or unusual scores or events to fall back towards the average
Regression toward the mean
What causes extreme results?
Unfortunate combinations
Example of regression towards the mean:
Lower than expected test score could be caused by an unfortunate combination of test topic, question difficulty, sleep, and weather, and this combination may not happen again so the next score will regress back to the average
Extraordinary happenings tend to be followed by:
More ordinary ones
Failure to recognize regression towards the mean can cause:
Superstitious thinking
Example of superstitious thinking caused by failure to recognize regression towards the mean:
If a coach berates a team for a poorer-than-normal performance and the next time performance regresses back to normal, the coach would think that the scolding worked
Regression toward the mean can mislead us into feeling what after criticizing others?
Rewarded
Regression toward the mean can mislead us into feeling what after praising others?
Punished
Can you use fancy explanations to explain why a fluctuating behavior returns to normal?
Usually not