Unit 1-3 AP Hug
1/110
There's no tags or description
Looks like no tags are added yet.
Name | Mastery | Learn | Test | Matching | Spaced |
|---|
No study sessions yet.
111 Terms
Factors for where people live/migrate to
Geographic (physical), economic, political, and cultural/historical
Population density
the number of people occupying a unit of land
Arithmetic Density
The total population divided by the total land area.
Physiogical Density
The number of people per unit of arable land
Agricultural Density
The total number of farmers per unit of arable land.
dependency ratio (DR)
The number of people in dependent age group (>12 and <65) divided by working age people multiplied by 100
Sex Ratio
the proportion of males to females in a population
Crude Birth Rate (CBR)
The number of births per year per every 1000 people
Total Fertility Rate (TFR)
The average number of children a woman will have during her childbearing years (15-49 years old)
Crude Death Rate (CDR)
The number of deaths per year per 1,000 people.
Infant Mortality Rate (IMR)
The number of deaths of children under 1 per 1000 live births
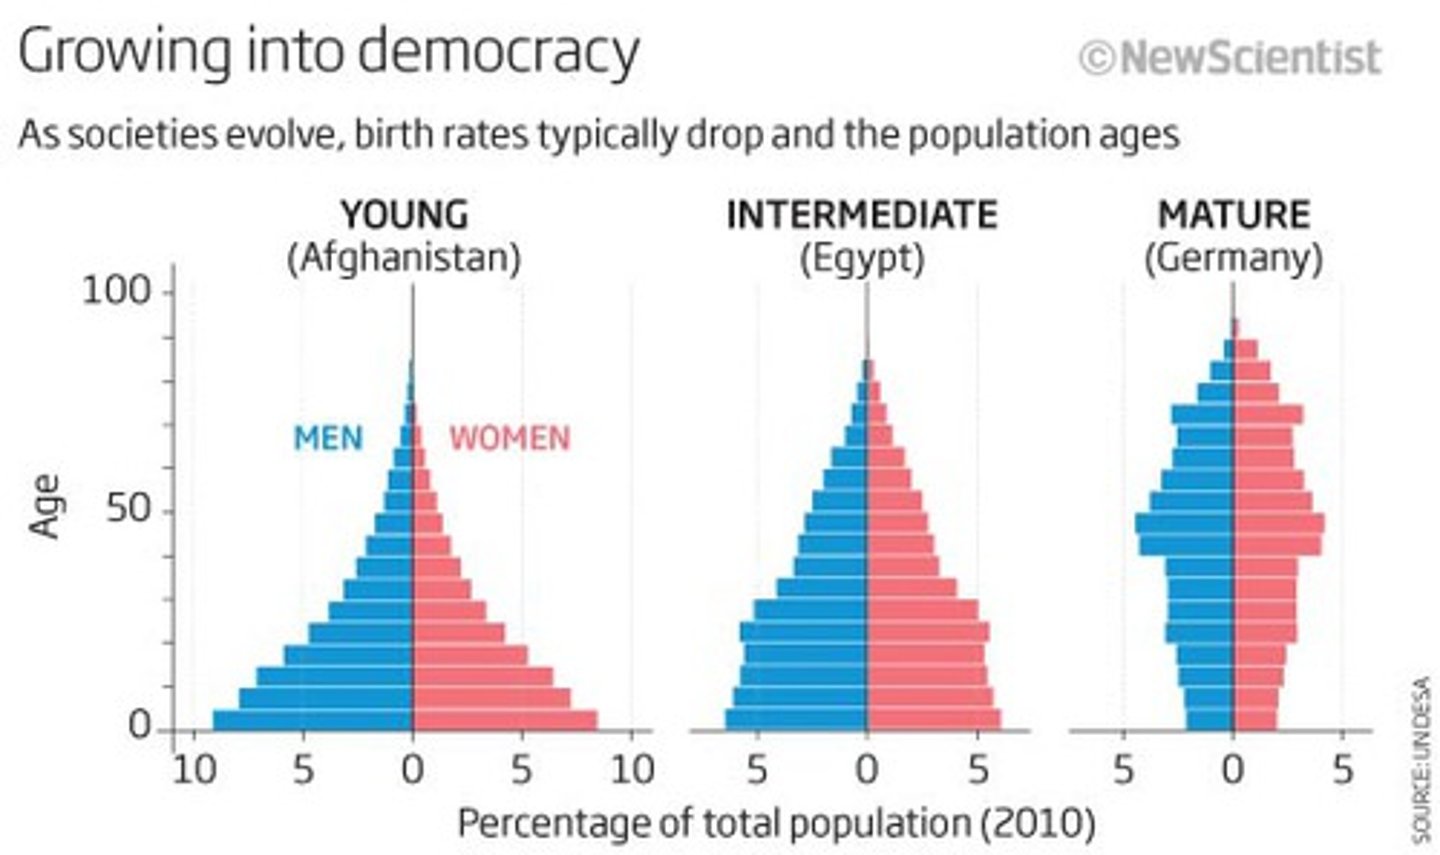
Population Pyramid
A graph that shows age-sex distribution of given populations
Rate of Natural Increase (RNI)
Difference between CBR and CDR of a group of people (CBR - CDR)
Doubling Time (DT)
The number of years a population at a certain rate doubles
DT formula
70/RNI
Factors of Population
Economic
Political
Environmental
Cultural
After industrialization, workers moved from _____ to ______
Rural to Urban or Farms to Cities
Malthus' Policy Recommendations
Called for moral restraint to lower birthrate due to fear of overpopulation and famine, was antinatalist
antinatalist policies
discourages people from having children
Pronatalist policies
policies that encourage people to have children
What does the Demographic Transition Model (DTM) display?
Shifts in growth in the world's population over time and trends and birth and death rates and their relationship
How many stages of DTM
5 stages
what does each ETM stage mean
1. high death rate (DR) and Life expectancy (LE)
2. Declining DR, increasing LE
3. DR stable, LE increases
4. DR lowest level, LE peak
5. LE decreases
What does each DTM stage mean
1st: Before Health care improvements
2nd: High Birth Rate (BR) low DR due to industrialization
(3rd/4th) Economic and Social issues slow birth rates
Possible 5th: Population declines
What is Epidemical Transition Model (ETM)
Incorporates cause of death patterns to explain population growth and decline
Mobility
All types of movement from one location to another.
Circulation
temporary and repetitive movements
Human Migration
permanent movement impacting origin and destination
Emigration
Move away
Immigration
Move towards
Net Migration
difference between number of emigrants and immigrants
Gravity Model
as population of a city increases, migration/interaction increases
Push factors
Negative cause for emigration
Pull factor
Positive aspect attracting immigration
Voluntary Migration
Permanent movement undertaken by "choice".
Transitional migration
Immigrating to a new country but keep strong ties with origin (ex: Chinatown)
Internal Migration
movement within a country's borders
Friction of distance
the longer a journey the more time, effort, and cost
Chain Migration
Immigrants move to a new country because of existing connections with family or friends who have already settled there
Step Migration
Immigrants make smaller moves heading to an ultimate goal
Forced Migration
Refugees are forced to leave for fear of persecution or death
Internally Displaced Person (IDP)
Migrants who are fleeing homes but remain in their country
Xenophobia
Fear or hatred of foreigners
What drives policy
1. Main goal is to meet[ing] labor market needs
2. Secondary goal is to maintain or change current immigration levels
Refugee Status
Facing persecution and escaping conflict/disaster (Status must be granted by country of origin or international agency)
Physical Geography
Natural Processes and distribution of features in the environment
Human Geography
Events and processes of humans understanding, using and altering the Earth
Location
The position of something that occupies Earth's surface
absolute location
Exact location of a place on the earth described by global coordinates (longitude, latitude)
relative location
The position of a place in relation to another place
place
A location distinguished by physical and human characteristics
Physical Characteristics
Features of the earth's surface, such as landforms, water systems, climate patterns, and plant and animal life
Human Characteristics
Includes a variety of factors such as history, government, social groups, economic systems, language, religion, clothing, housing, food, or art forms
Spatial
Where things are located and why there
Ecological
Studying interactive and interdependent relationships
Spatial and Ecological
Humans interacting with the environment
Site
Usually relating to things that don't change in a place like absolute location, climate, resources, and landforms
Situation
a place's location in relation to other places
Space
The area between two or more things
Density
Number of things in a specific area (how much is packed in one area)
Pattern
how things are arranged in a particular space
Environmental Determinism
The theory that human behavior is controlled by the physical environments
Topography
Climate and soil dictate development of society
What do scientists believe about environmental determinism and topography
That it’s not true
Social scientists currently discredit this theory
What is Possibilism in geography?
The theory that humans can produce results and are not solely determined by their environment.
How does the environment affect societies according to Possibilism?
The environment can limit people, but societies decide how to live.
What does Geographic Information System (GIS) capture?
Data to create simple and complex maps.
How does GIS collect data?
Without making contact, using Satellites, aircraft sensors, and drones.
Scale
area of the world being studied
Region
area with distinct characteristics
Formal Region
area with one or more shared traits
Functional Region
Area organized by function around a node
Perceptual/Vernacular Region
Area that reflects people's impressions, feelings, or attitudes about a place (ex: American South)
Wallerstein's World System theory
describes the spatial and functional relationships between countries in the world's economy.
How does World System Theory categorize countries?
Immanuel Wallerstein
Core, Semi-Periphery, and Periphery
Core Country
Dominates and controls global economy, higher education levels, more advanced tech, etc.
"top" countries
Semi-periphery
Less wealth, lower education, weaker tech. Overall less stable than core, but has potential to become core
Periphery
Less advanced, less stable gov, less skilled labor force, etc. "bottom" countries
Sustainability
Use of land and resources in a way to avoid depletion
Quantitative data
info measured by numbers
(ex: population/temperature)
qualitative data
Non-numerical data describing characteristics or patterns
Global Positioning System (GPS)
31 satellites orbiting the earth transmitting location data
Absolute Distance
Uses standard units such as miles or kilometers
Relative Distance
Distance measured in terms such as cost or time which are more meaningful for the space relationship in question
absolute direction
cardinal directions (NSEW)
relative direction
Directions such as left, right, forward, backward, up, and down based on people's perception of places
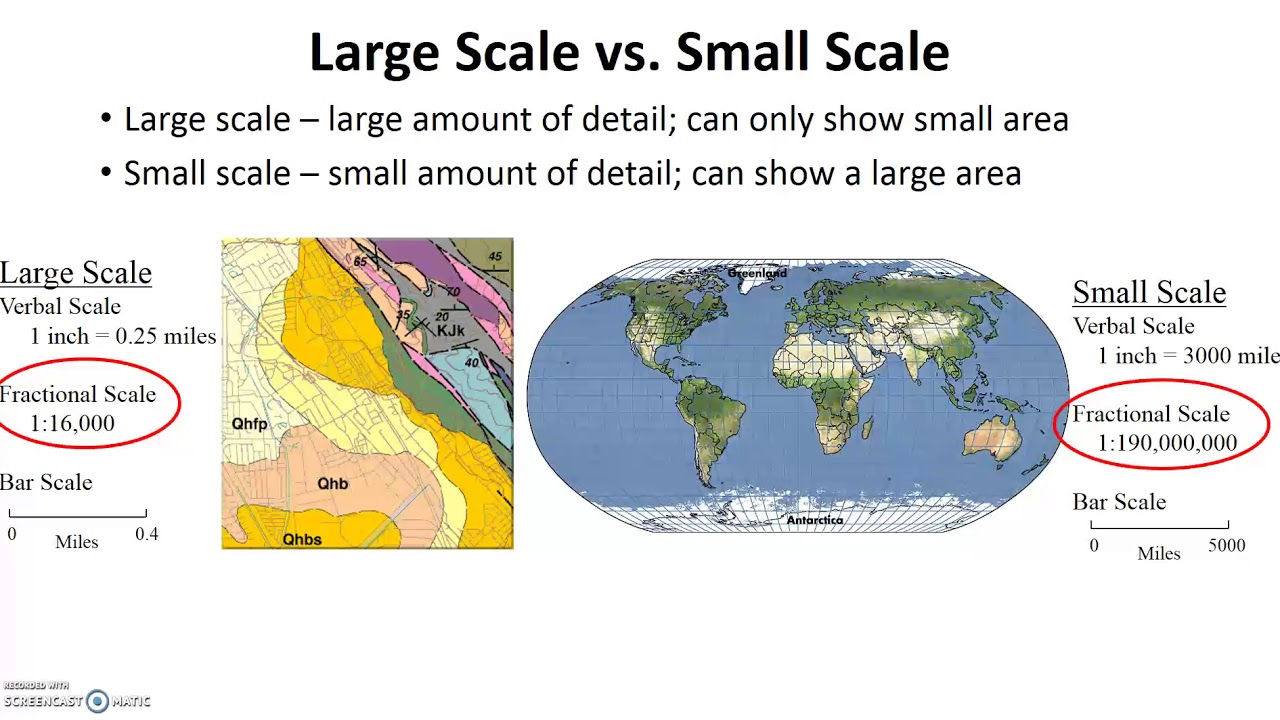
Large map scale
A map that shows a large amount of details in a small area (left side of picture)

Medium map scale
A map that shows a medium amount of details in a medium sized area
Small map scale
A map that shows a small amount of details in a large area (right side of picture)
demographic transition model (DTM)
model that demonstrates the changes in birth rates, death rates, and population growth over time as a country develops
Koppen Climate Classification System
Categorizes climates into zones with different lettered codes
Culture
Beliefs, values, practices, behaviors, and technologies that societies share
Visible Culture
Language, art, and behavior
Unseen Culture
Beliefs, values, and rules (strongly influence visible)
Cultural Traits
Both Seen & Unseen Traits
Artifacts
housing, buildings, clothing, etc.
Sociofacts
Family structure, gov, ed systems, religion (Defines how people act and est. rules)
Mentifacts
Central enduring elements (Religion + Language)
Ethnocentrism
Belief one's culture is superior
cultural relativism
putting your views aside to understand others