Demand Schedules & Demand Curves
1/20
There's no tags or description
Looks like no tags are added yet.
Name | Mastery | Learn | Test | Matching | Spaced | Call with Kai |
|---|
No analytics yet
Send a link to your students to track their progress
21 Terms
Demand Schedule
The relationship between price of product and quantity of the product demanded

Quantity Demanded
Amount of a good/service consumers are willing to purchase at a particular price
Demand curve
Shows relationship between price and demand
Law of Demand
Inverse relationship of price of product and quantity demanded; as price increases, quantity demanded decreases.
Ceteris Paribus Condition
when analysing the relationship between two variables, other variables must be held constant, such as income. This condition ensures that any observed effects on demand or supply are solely due to changes in price, allowing for a clearer understanding of the relationship.

What explains the Law of Demand
The substitution and income effect
What is the substitution effect
The change in quantity demanded of a good due to a change in its price relative to substitute goods, leading consumers to replace more expensive items with cheaper alternatives.
What is the income effect?
The change in quantity demanded of a good resulting from a change in consumers' purchasing power due to a change in the good's price, affecting their ability to buy more or less of the good.
How can the Market Demand shift?
If consumers decide to buy less of a product, it will shift to the left. If they decide to buy more of a product, it will shift to the right.
Variables (other than price) that influence market demand
Income
Prices of related goods
Tastes
Population + Demographics
Expected Future Prices
Income
income that customers have available to spend affects their willingness to buy goods/service
(If household income increases, the demand for quantity increases - shifting curve to the right)
Normal good
A good or service that people buy more of when they have more money (demand increases), and less of when they have less money (demand decreases).
Inferior good
A good or service that people buy more of when their income is lower (demand increase), and buy less of when their income is higher (demand decrease).
Price of related goods
The cost of goods that can affect the demand for another good. When the price of a substitute rises, demand for the original good increases, while a decrease in the price of a complement can increase demand for the related good.
Complements
Goods that are consumed together, where an increase in the price of one leads to a decrease in demand for the other. For example, peanut butter and jelly.
Tastes
Preferences or likes of consumers that can influence demand for a good or service. Changes in consumer tastes can lead to an increase or decrease in demand.
Population and demographics
The characteristics of a group of people, including factors like age, race, gender, income, and education. As population increases, number of consumers increase (increasing demand)
Expected Future prices
The prices that consumers anticipate will prevail in the future, influencing their current demand for goods and services. If consumers expect prices to rise, they may increase current demand.
What is a change in demand
shift on the demand curve due to other factors than price such as changes to consumer preferences.
What is change in quantity demand
Movement along the demand curve as a result of price changes
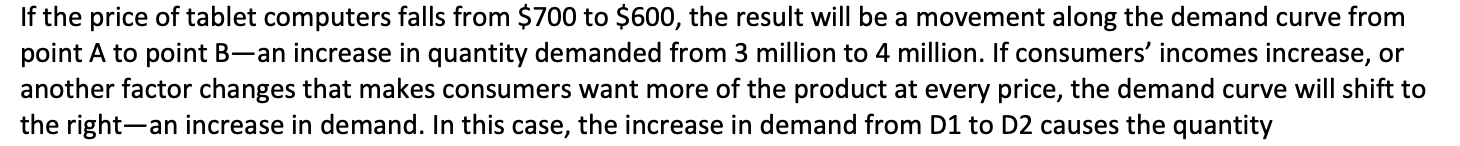
Show the change in demand and change in quantity demand:
If the price of tablet computers falls from $700 to $600, the result will be a movement along the demand curve from point A to point B—an increase in quantity demanded from 3 million to 4 million. If consumers’ incomes increase, or another factor changes that makes consumers want more of the product at every price, the demand curve will shift to the right—an increase in demand. In this case, the increase in demand from D1 to D2 causes the quantity