4. T-tests Pt2
1/38
There's no tags or description
Looks like no tags are added yet.
Name | Mastery | Learn | Test | Matching | Spaced | Call with Kai |
|---|
No analytics yet
Send a link to your students to track their progress
39 Terms
What defines an independent-samples design, and how is it used in psychology?
Subjects in each group are not matched.
Groups are independent (e.g., control vs experimental).
Typical research process:
Randomly sample subjects.
Randomly assign to control/experimental group.
Compare group means on the dependent variable.
Used widely in between-subjects experiments.
How else can independent samples be formed besides random assignment?
Randomly sample from pre-existing groups.
Example: only-children vs first-borns (with younger siblings).
Steps:
Select participants from each group.
Administer test of interest.
Compare means between groups.
Rationale: compare natural categories when manipulation isn’t possible.
Think-pair-share question: Why only “oldest child” vs “only child”? → To isolate sibling-effect without mixing birth-order confounds.
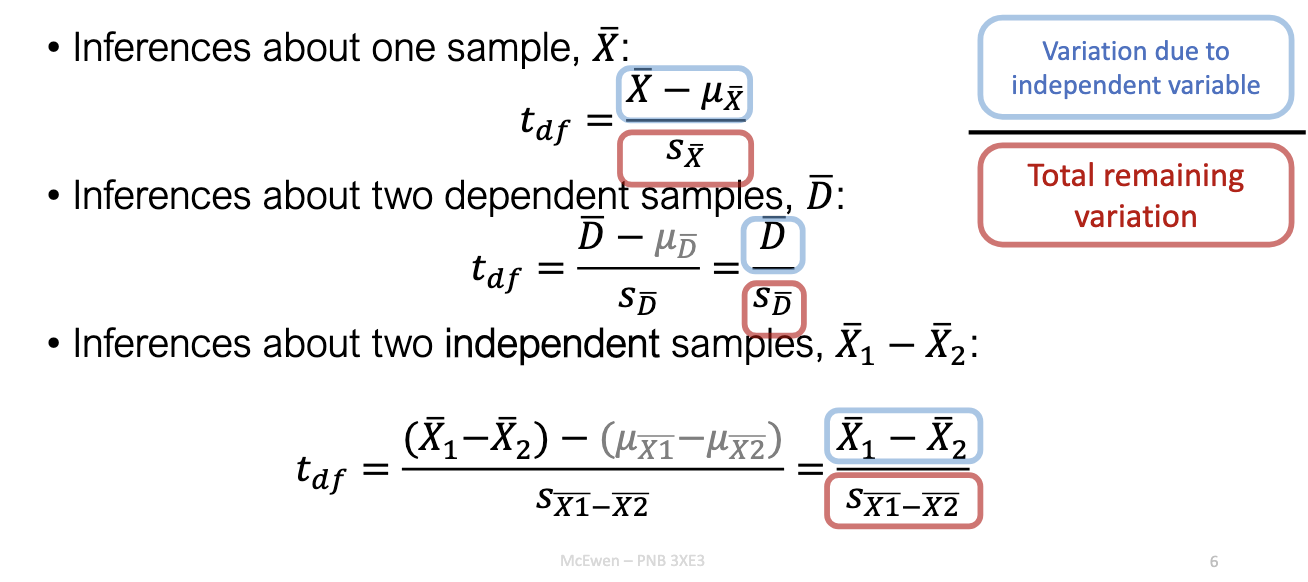
What are the three main types of t-tests and when are they used?
One-sample t-test: Compare sample mean X-bar to known population mean μ
Dependent (paired) t-test: Compare mean of differences D-bar between matched or repeated measures.
Independent t-test: Compare means of two independent groups X1 - X2
All use:
Numerator = observed difference.
Denominator = standard error of that difference.
Logic: signal (effect) ÷ noise (variation).
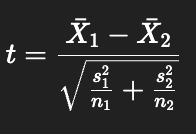
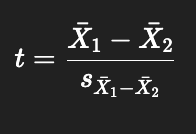
What does the denominator represent in an independent-sample t-test?
It’s the variance of the difference in sample means.
Equivalent to: Standard Error of the Difference (SED).
This is the SD of the sampling distribution of differences between two independent group means.
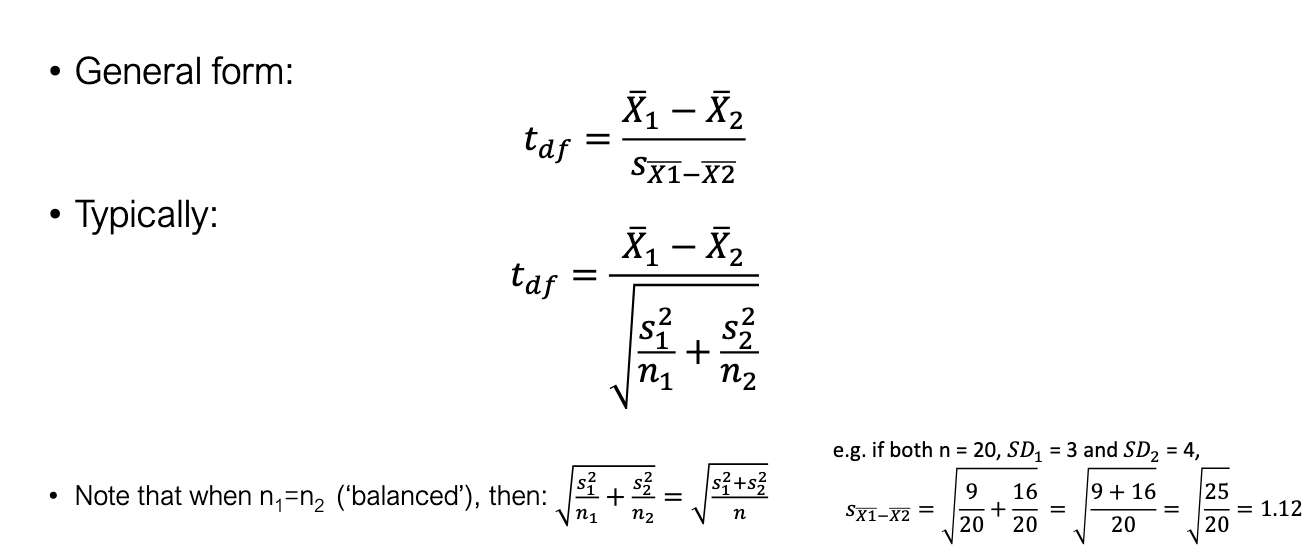
Formula (general):
What is the denominator in the independent t-test called, and why is it important?
Standard error of the difference between means (SED).
Captures how much difference we expect by chance.
Smaller SE → easier to detect real group differences.
Denominator is the key to making inference valid.
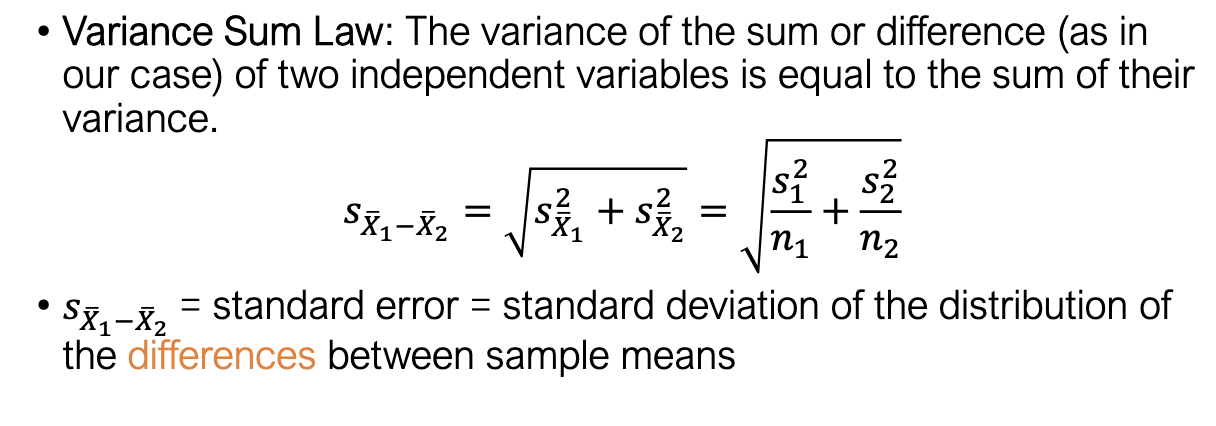
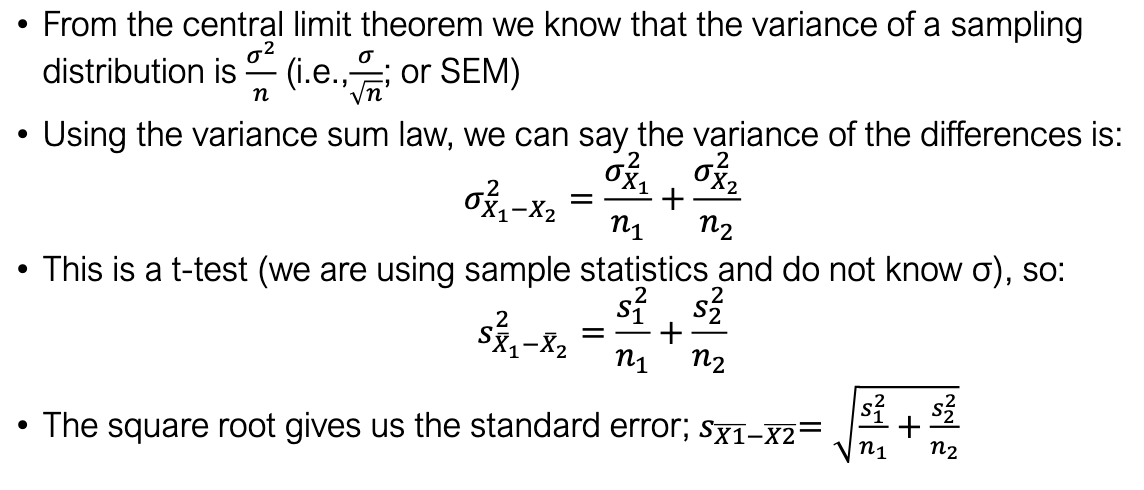
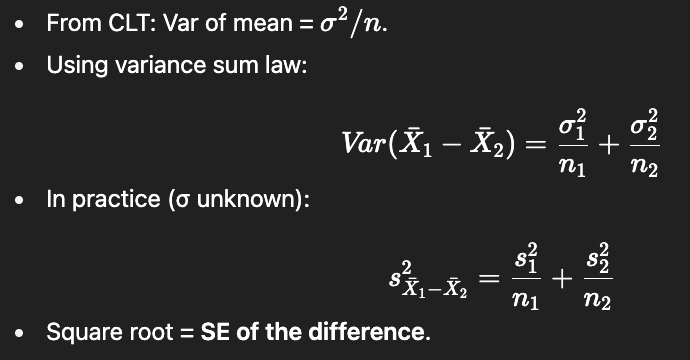
How does the variance sum law apply to the independent-samples t-test?
Law: Var(X ± Y) = Var(X) + Var(Y), if X & Y are independent.
Applied to means:
Taking square root gives standard error of difference.
Explains why both group variances contribute to denominator.
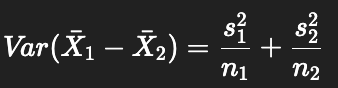
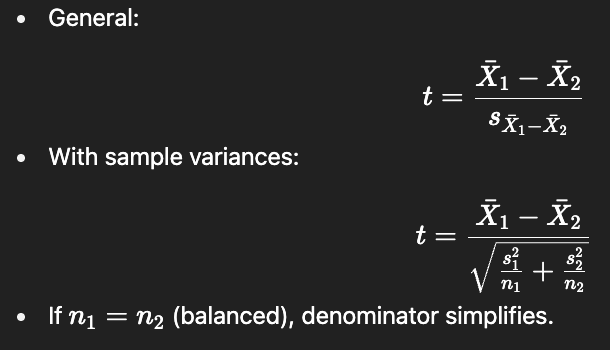
How do we compute the variance of the difference in sample means?
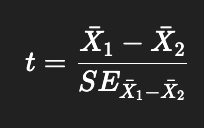
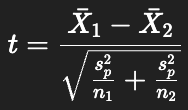
What is the formula for the independent t-statistic using group variances?
Numerator = mean difference.
Denominator = standard error of difference.
Shows difference in relation to variability.
How do we set up an independent t-test with two groups (School A vs School B)?
School A: X-bar=45, s=6, n=25
School B: X-bar=41, s=5, n=25
Steps:
State hypotheses: H0:μ1=μ and H1:μ1≠μ2
Compute mean difference = 4.
Compute SE using formula.
Calculate t.
Compare with critical value or p-value.
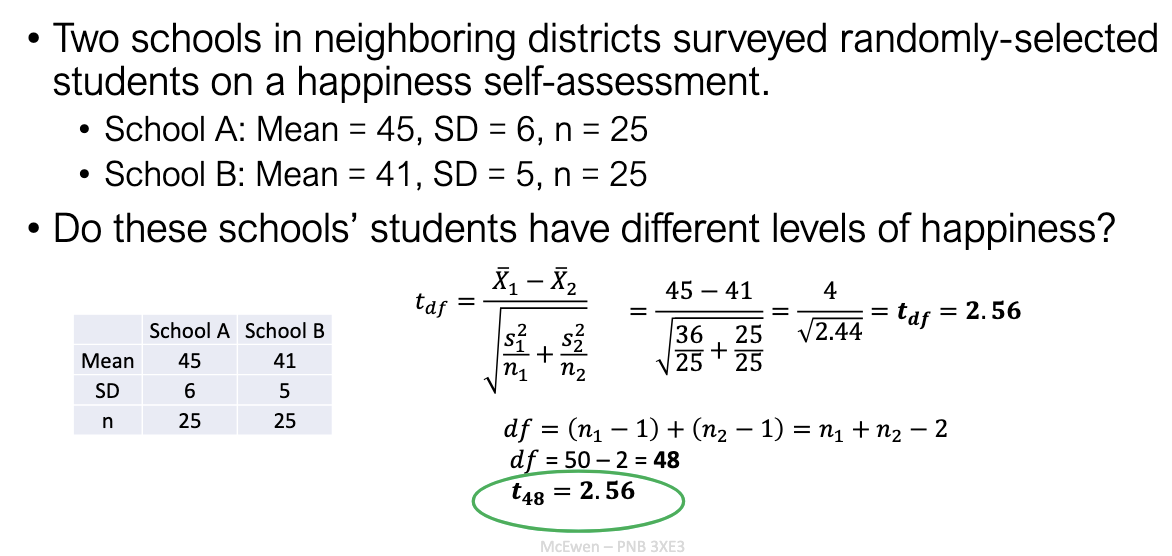
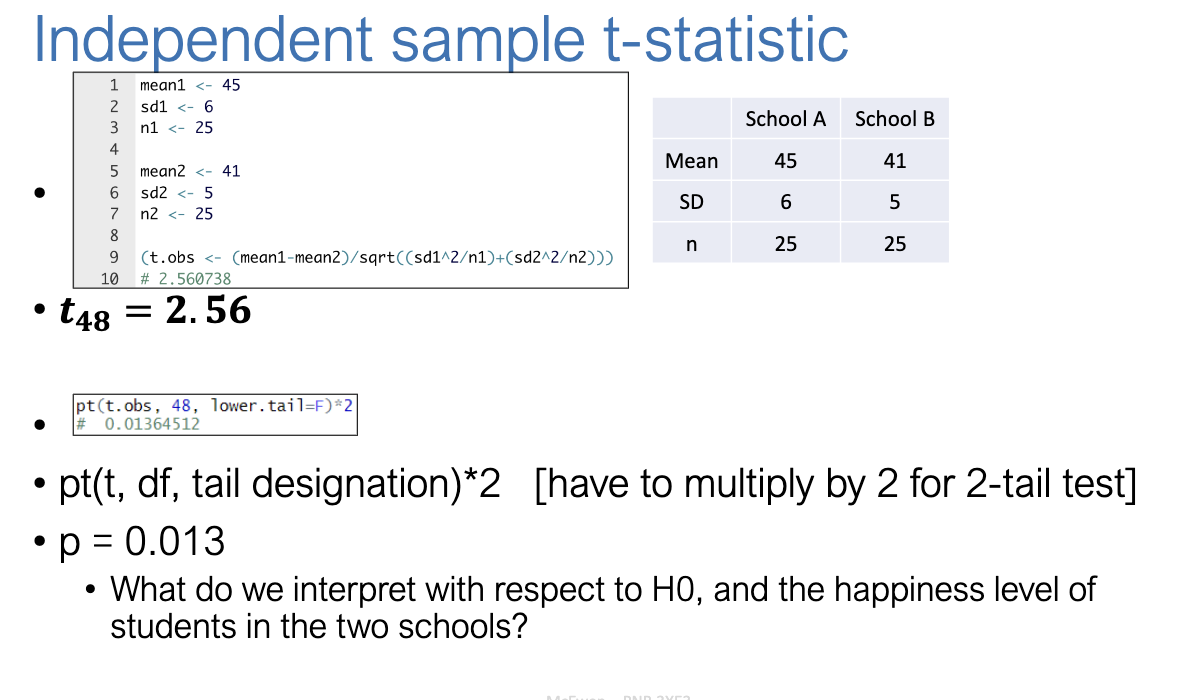
What does the result of the happiness study tell us?
Obtained statistic: t(48)=2.56
p = 0.013 (two-tailed).
Interpretation: Reject H0
Students’ happiness differs significantly between schools.
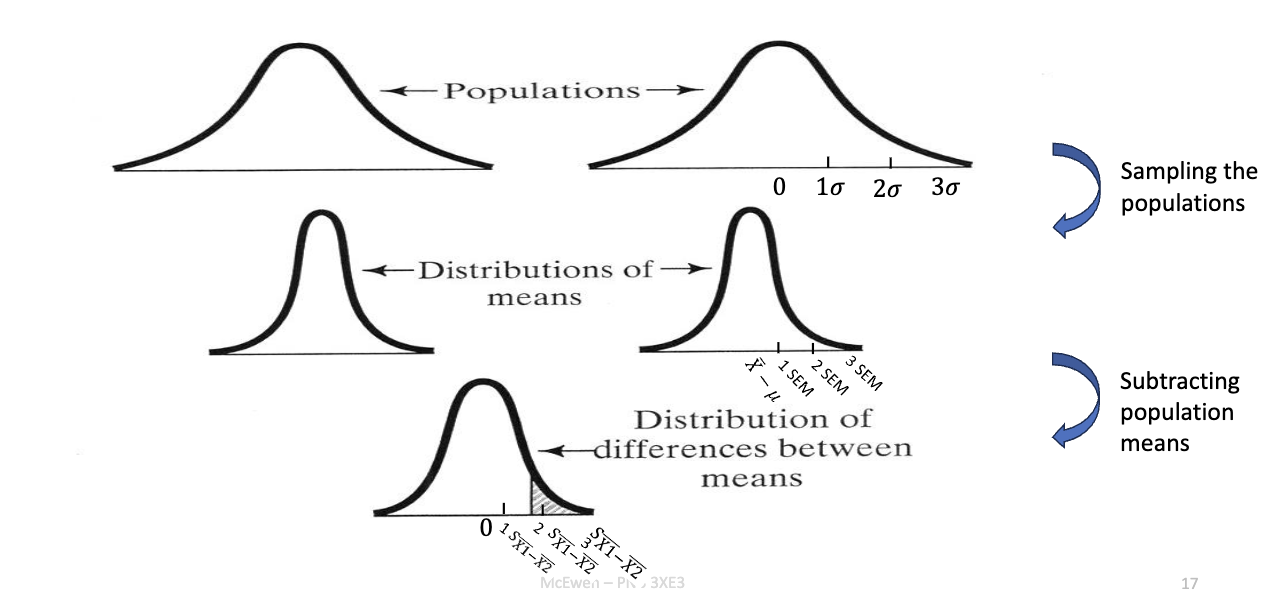
What is the distribution of differences between means?
It’s the sampling distribution of X1-X2
Center = μ1−μ2
Shape ≈ normal (by CLT).
Spread = SE of difference.
Important: this is the theoretical distribution against which our observed difference is tested.
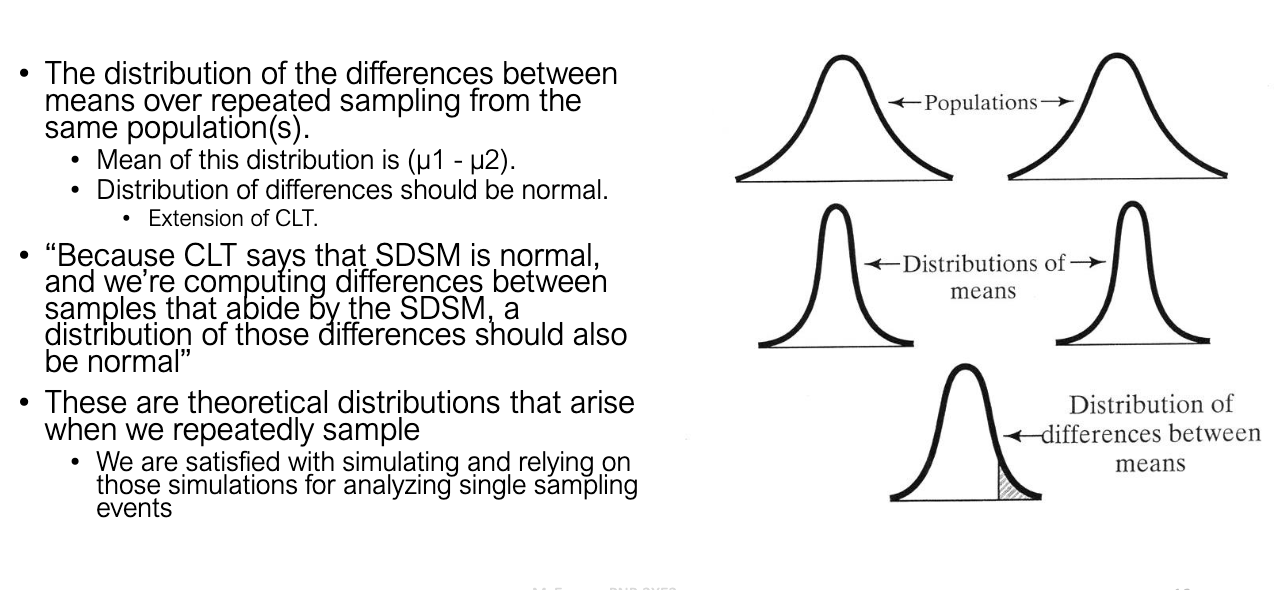
How do we get from populations to the distribution of mean differences?
Process:
Sample repeatedly from population 1 → distribution of means.
Sample repeatedly from population 2 → distribution of means.
Subtract group means for each pair of samples.
Result = distribution of differences between sample means.
That’s the reference distribution for the independent t-test.
What defines the distribution of differences between means in t-tests (independent samples t-test)?
Center: observed mean difference X1-X2
Width: standard error sX1-X2
Test statistic:
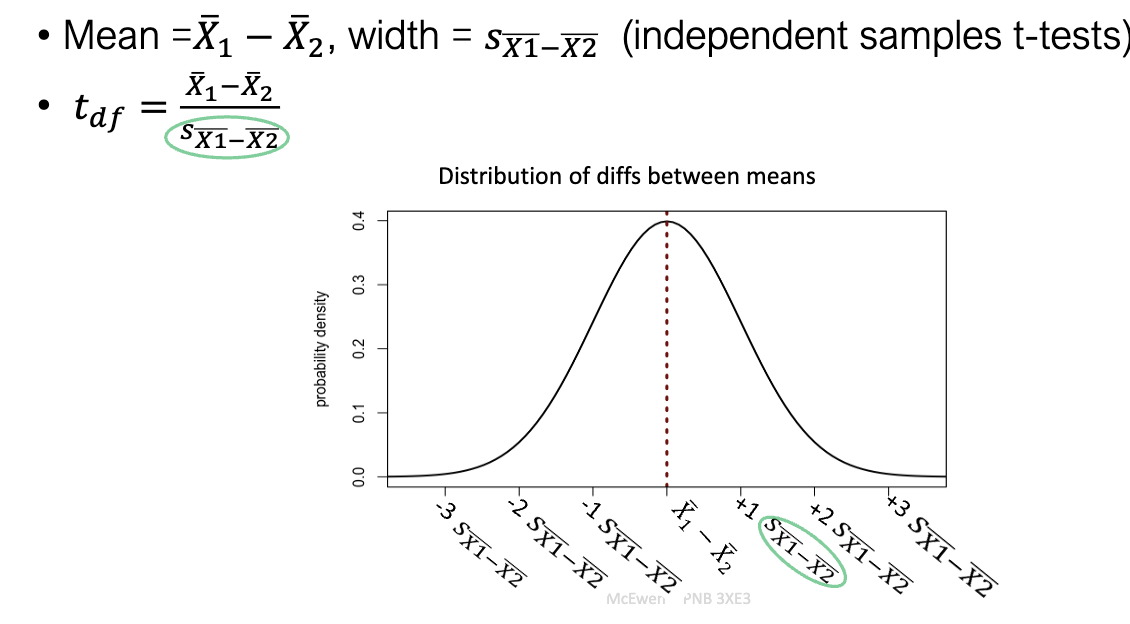
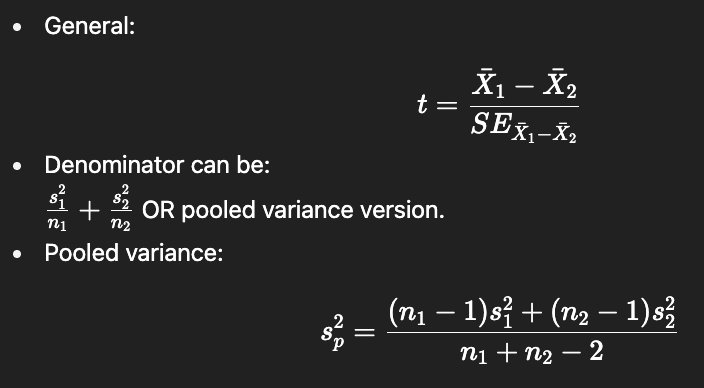
What is the general form of the independent t-test?
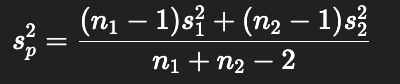
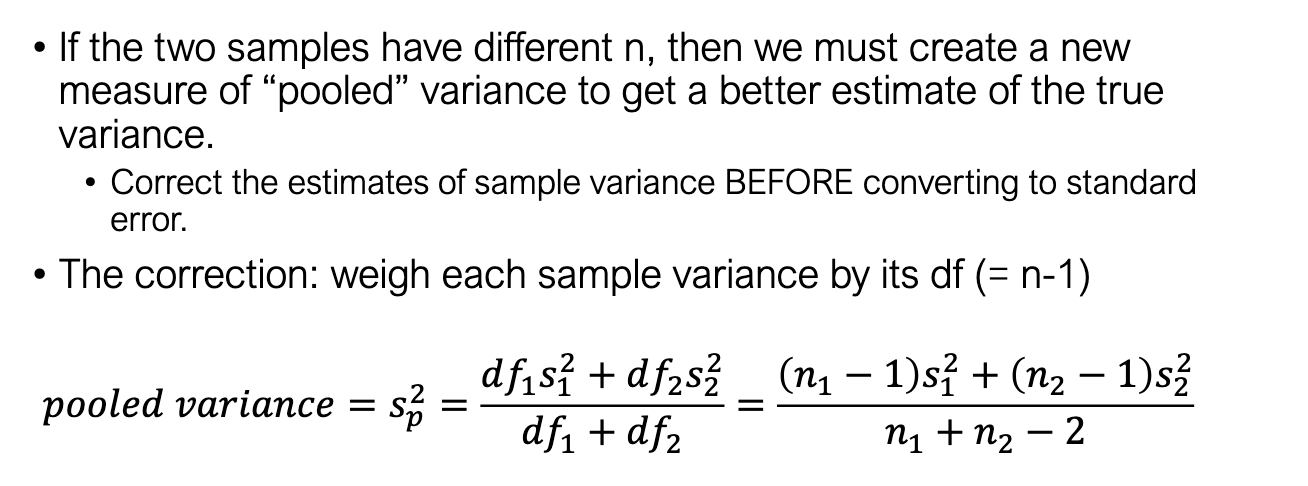
Why do we use pooled variance when sample sizes are unequal?
Unequal n → SE formula can overweight one group’s variance.
Solution: use pooled variance (weighted average of group variances).
Weights each variance by its df, giving fairer estimate of true variance.
Formula:
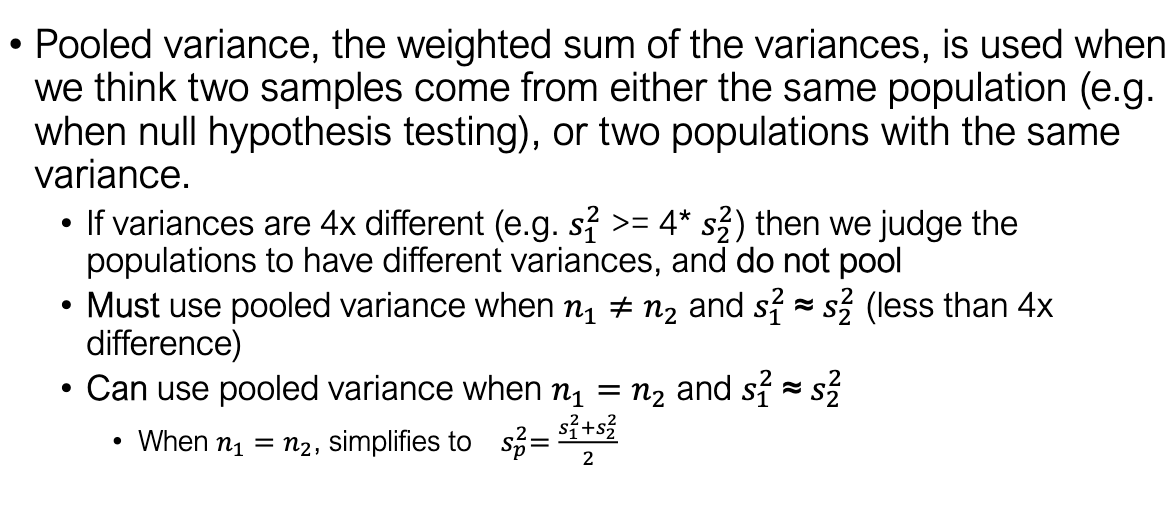
When should we use pooled variance?
Use if:
S21 ≈ S22 (similar variances, less than 4× different).
Especially when n1≠n2
Don’t pool if:
Variances differ a lot (≥4×).
If n1=n2, pooled variance = simple average of group variances.
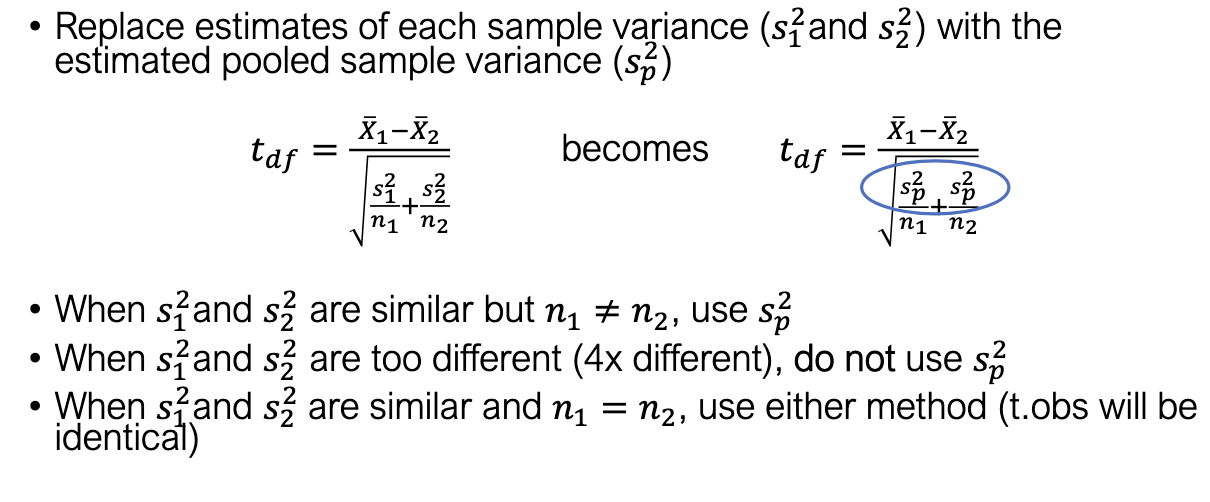
How does the independent t-test formula change with pooled variance?
Replace each variance with pooled variance:
If variances are similar and n1≠n2 → use pooled.
If variances are too different → don’t pool.
If variances similar & n1=n2 → either method works (same result).
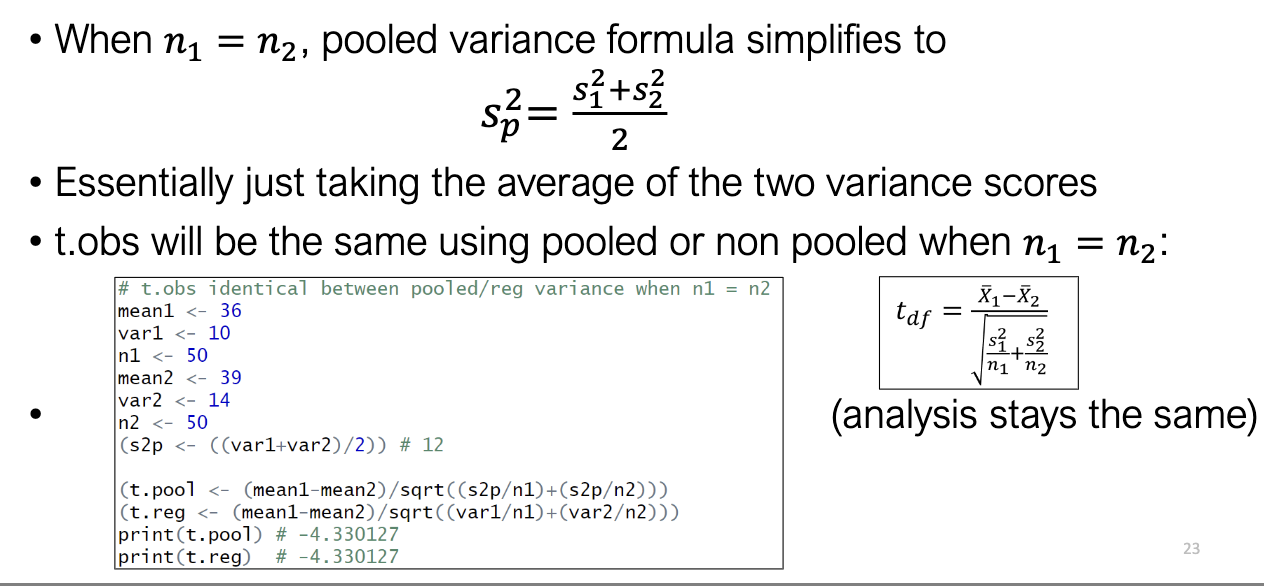
What happens when sample sizes are equal?
Pooled variance simplifies to:
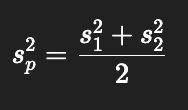
Just the average variance.
With equal n, pooled and non-pooled give identical t.
How is the DrugX experiment set up for an independent t-test?
IV: Drug condition (DrugX vs Placebo).
DV: Number of maze errors (lower = better).
Group 1 (DrugX): X-bar = 14, n=9
Group 2 (Placebo): X-bar=16, n=10
H0:μ1=μ2
H1:μ1≠μ2
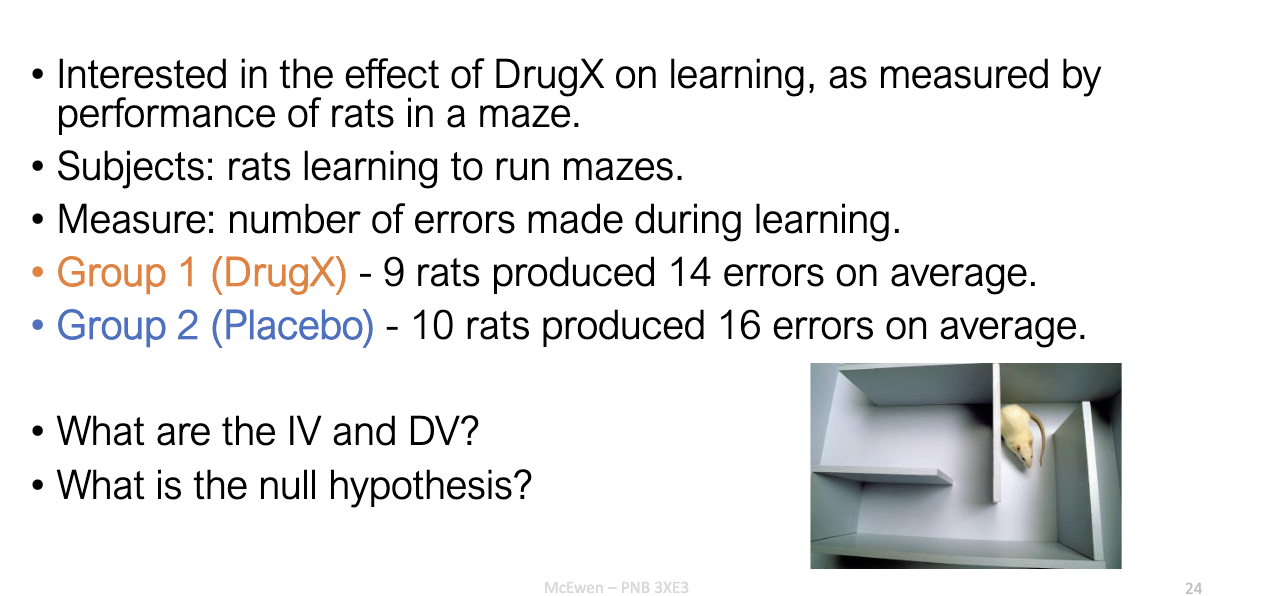
What are the null and alternative hypotheses for DrugX?
H0: μ1=μ2 → Drug has no effect.
H1: μ1≠μ2 → Drug does affect learning.
Inference: Reject or fail to reject based on t-test outcome.
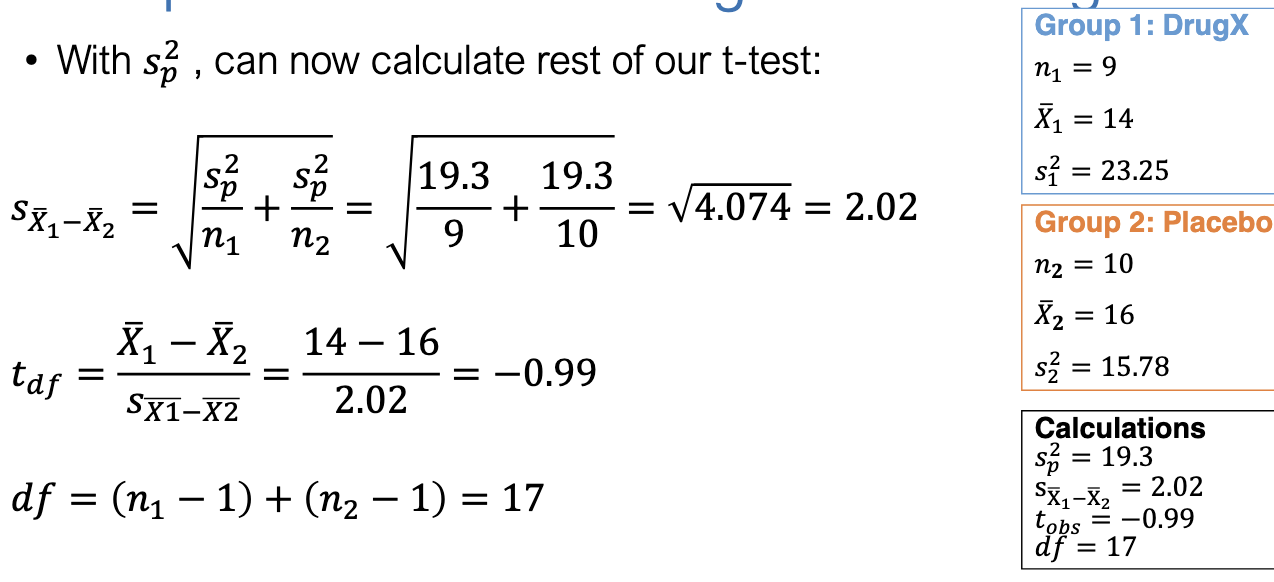
What formula is used for the DrugX study’s t-test?
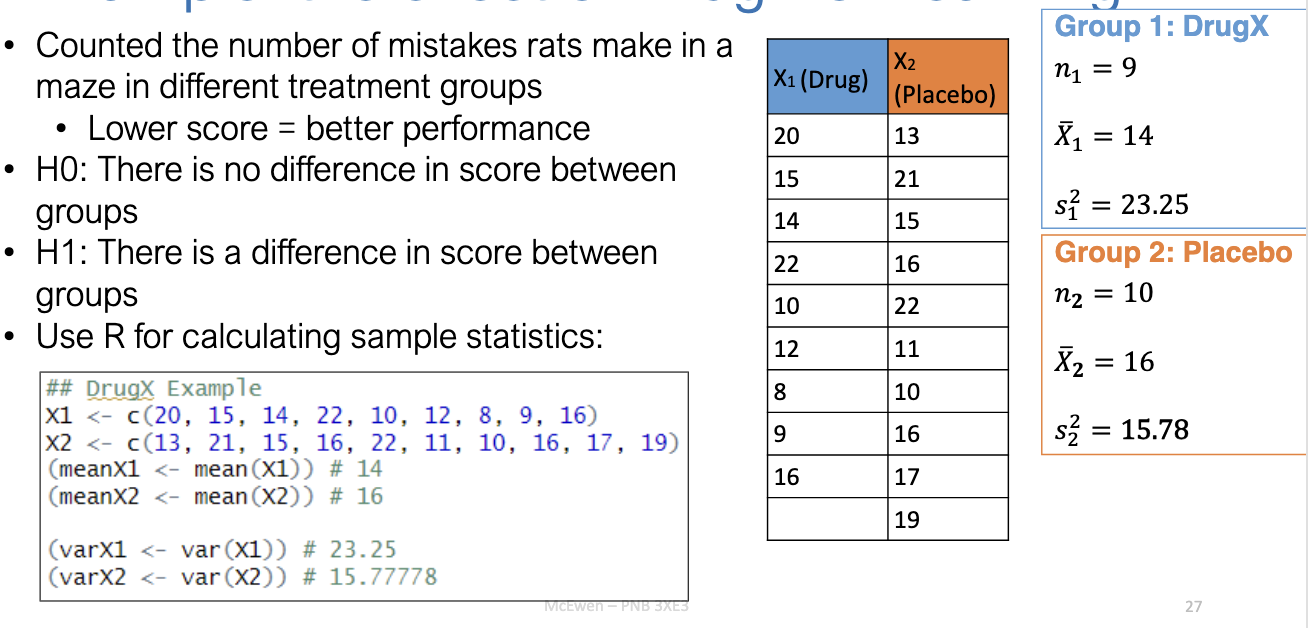
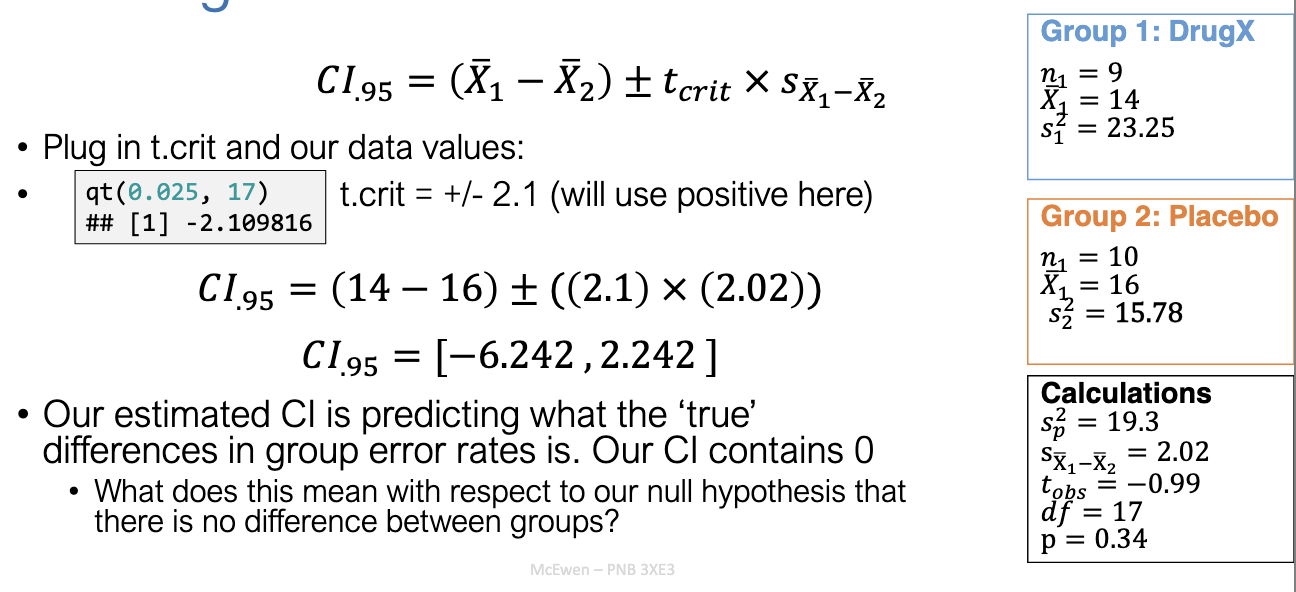
What are the key descriptive stats for the DrugX groups?
Group 1 (DrugX): n=9, X-bar=14, s2=23.25
Group 2 (Placebo): n=10, X-bar=16, s2=15.78
Hypotheses:
H0: No difference in errors.
H1: Difference exists.
Data collected: number of maze errors (lower = better).
Why must pooled variance be used in the DrugX example?
Sample sizes unequal (n=9 vs n=10).
Variances similar (ratio < 4).
Rule: with unequal n and similar variances → must pool.
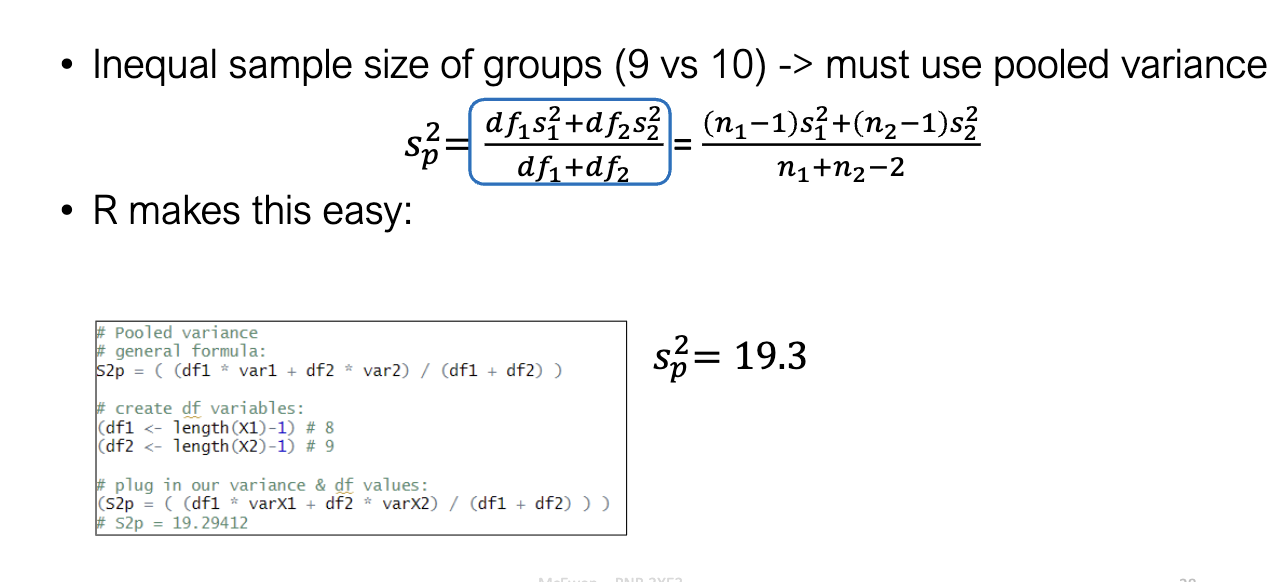
What are the calculated statistics for the DrugX example?
Pooled variance: sp2=19.3
Standard error: SE=2.02
Observed t: t=−0.99
df = 17.
Group 1: X-bar=14.
Group 2: X-bar=16
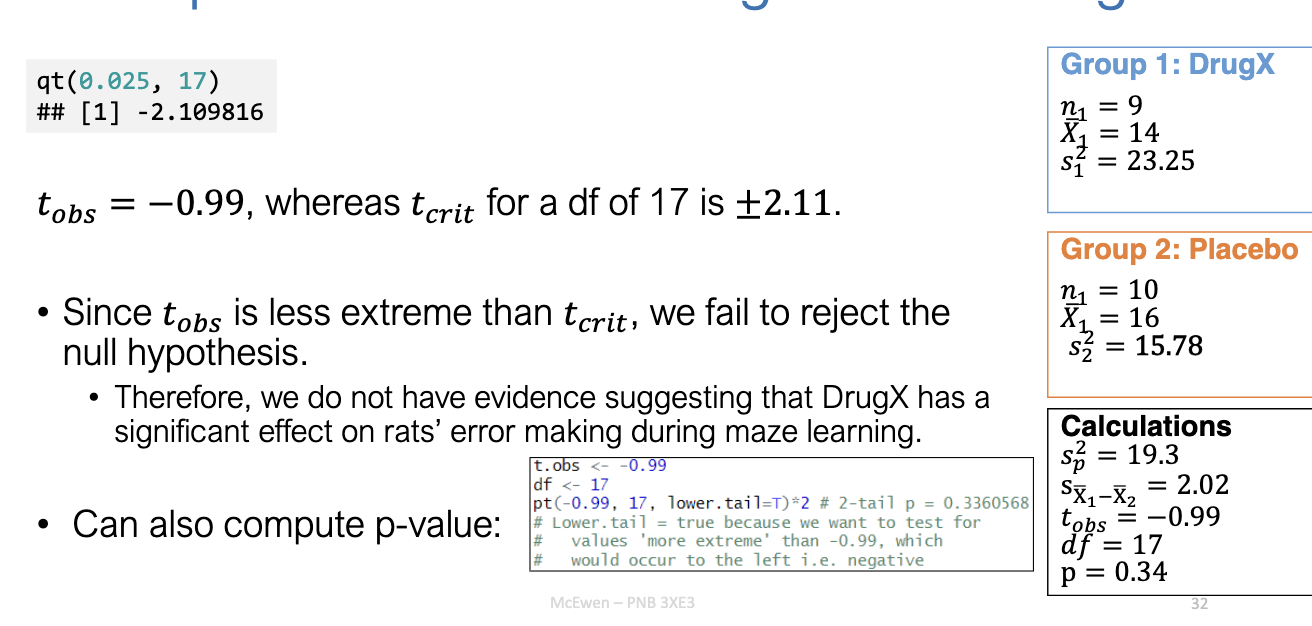
What does the t-test reveal about DrugX’s effect on learning?
tobs=−0.99
Critical t (df=17, α=0.05, 2-tailed) = ±2.11.
∣tobs∣<tcrit→ fail to reject H0.
Conclusion: No significant evidence DrugX affects maze learning errors.
p-value confirms (p > .05).
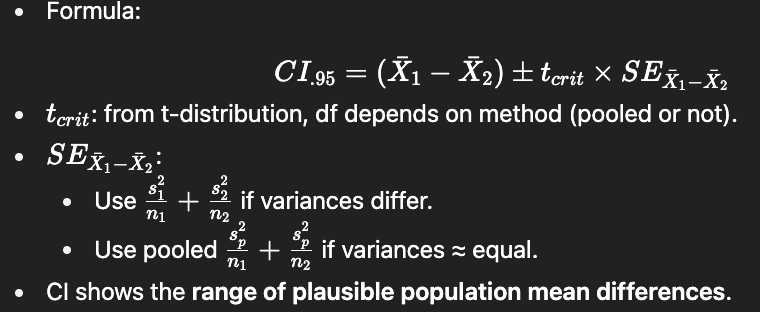
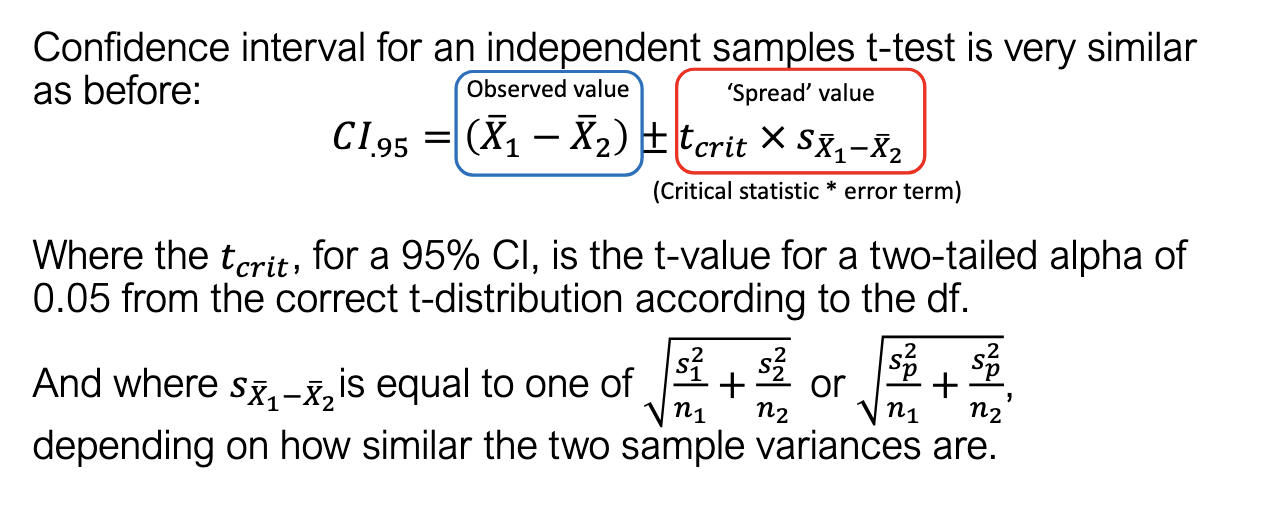
How do we compute a 95% confidence interval for an independent t-test?
What did the 95% CI for the DrugX study show, and what does it mean?
Calculation:

CI includes 0 → difference could plausibly be 0.
Interpretation: Fail to reject H0H_0H0.
Conclusion: No evidence DrugX significantly changed maze errors.
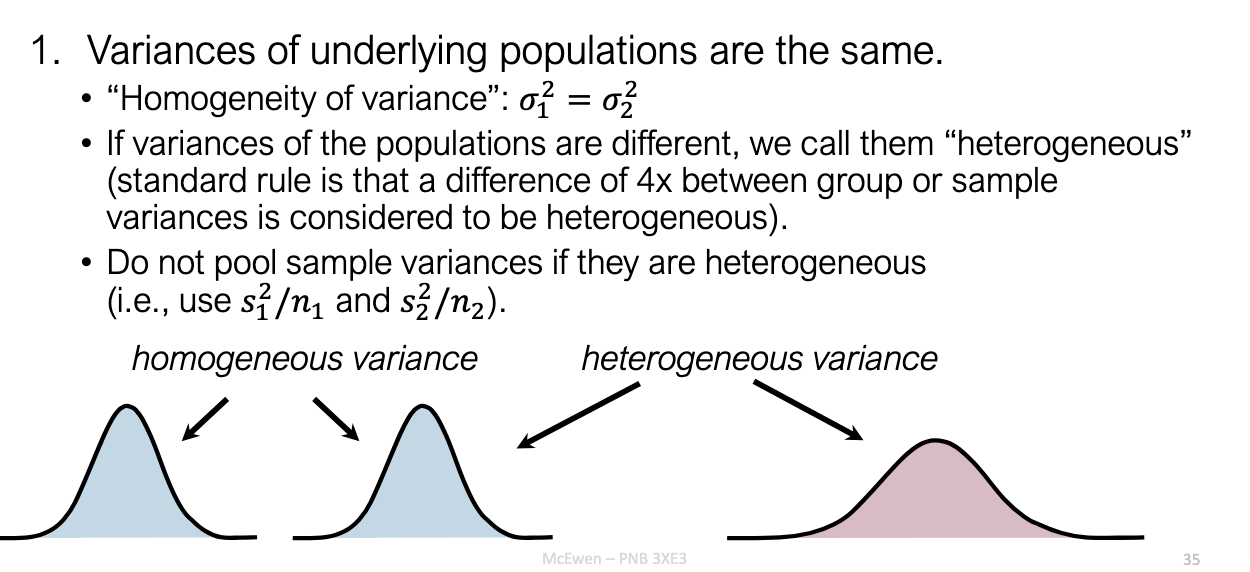
What is the “homogeneity of variance” assumption in t-tests?
Assumption: population variances equal (σ21=σ22)
If violated → “heterogeneity of variance.”
Rule of thumb: difference ≥ 4× → too different → don’t pool variances.
If heterogeneous: use separate variance formula instead of pooled.
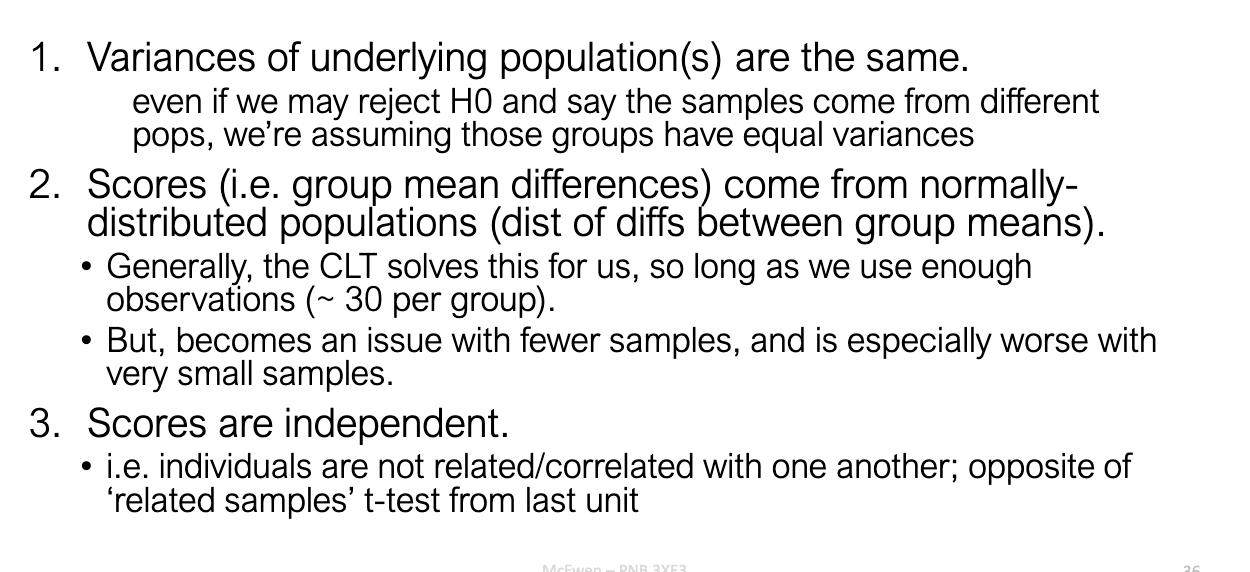
What are the three main assumptions of an independent-sample t-test?
Equal variances (homogeneity).
Even if means differ, assume variances are the same.
Normality.
Group means should come from normal populations.
CLT helps if n ≥ 30 per group; issue if very small n.
Independence.
Individuals’ scores not related (no pairing)
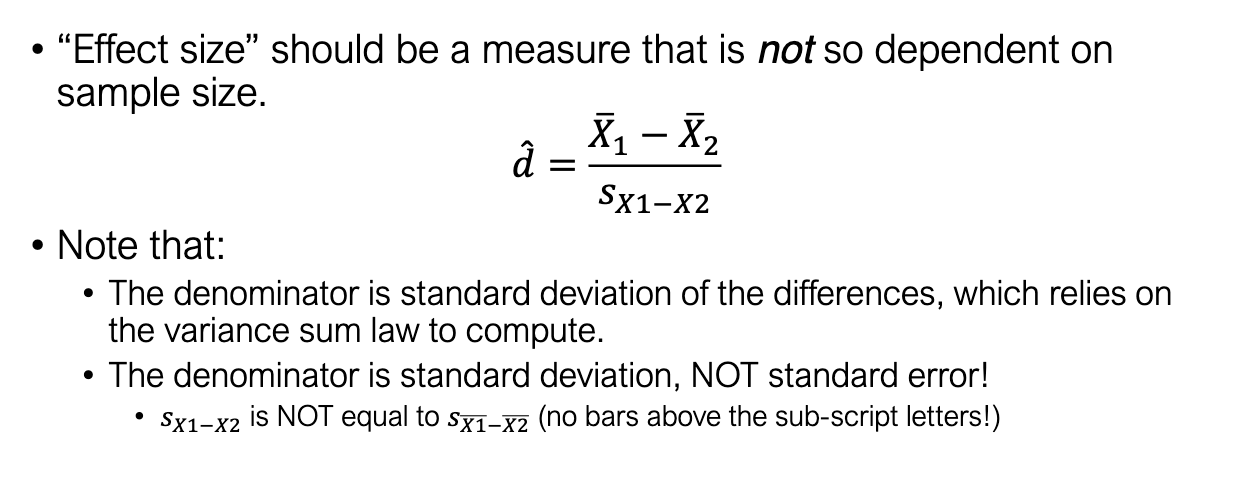
Why use effect size with t-tests, and how is it calculated?
Problem: p-values depend on sample size.
Effect size gives a standardized difference, less sensitive to n.
Formula:
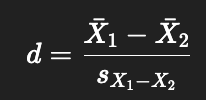
Important: denominator = standard deviation of differences, not standard error.
Uses variance sum law for calculation.
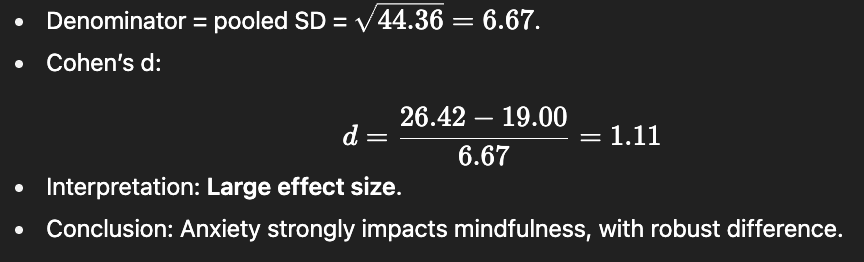
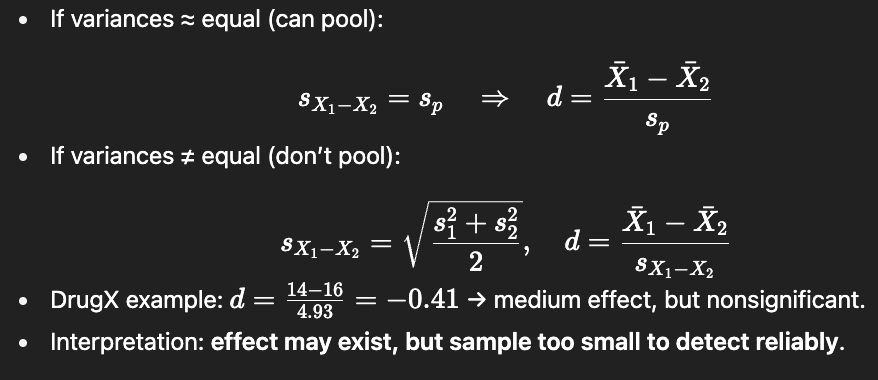
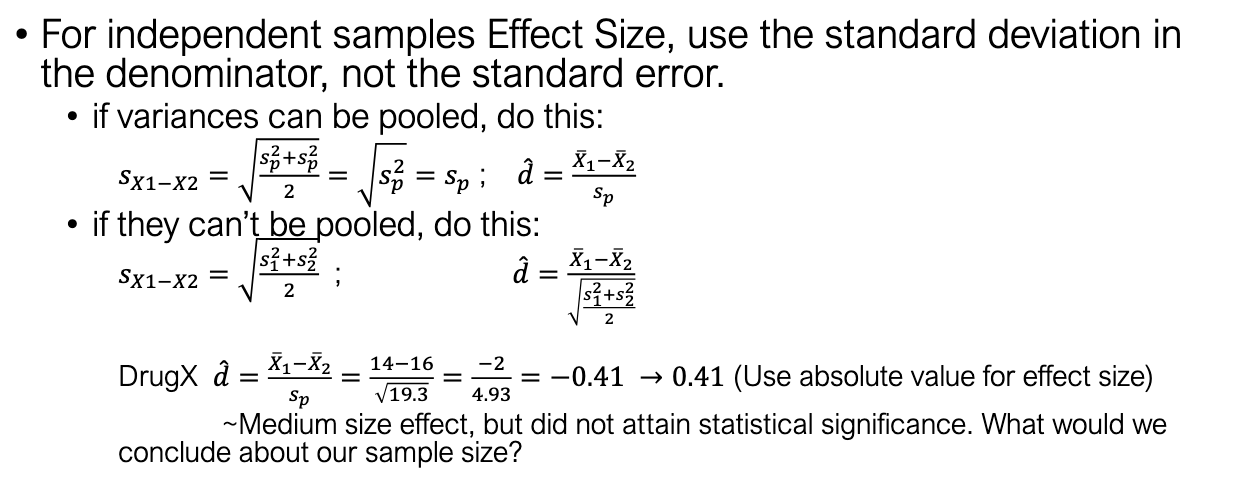
How do we compute Cohen’s d for independent samples?
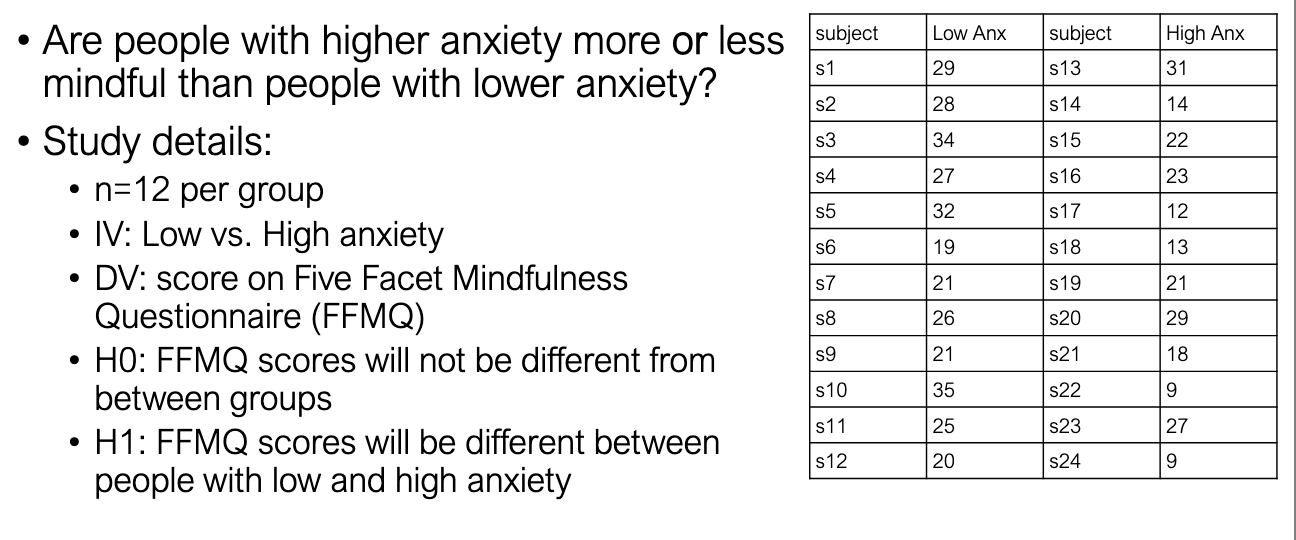
How was the mindfulness/anxiety study designed?
n=12 per group (low anxiety vs high anxiety).
IV: Anxiety group.
DV: Mindfulness (FFMQ scores).
Hypotheses:
H0: No difference in mindfulness.
H1: Groups differ in mindfulness.
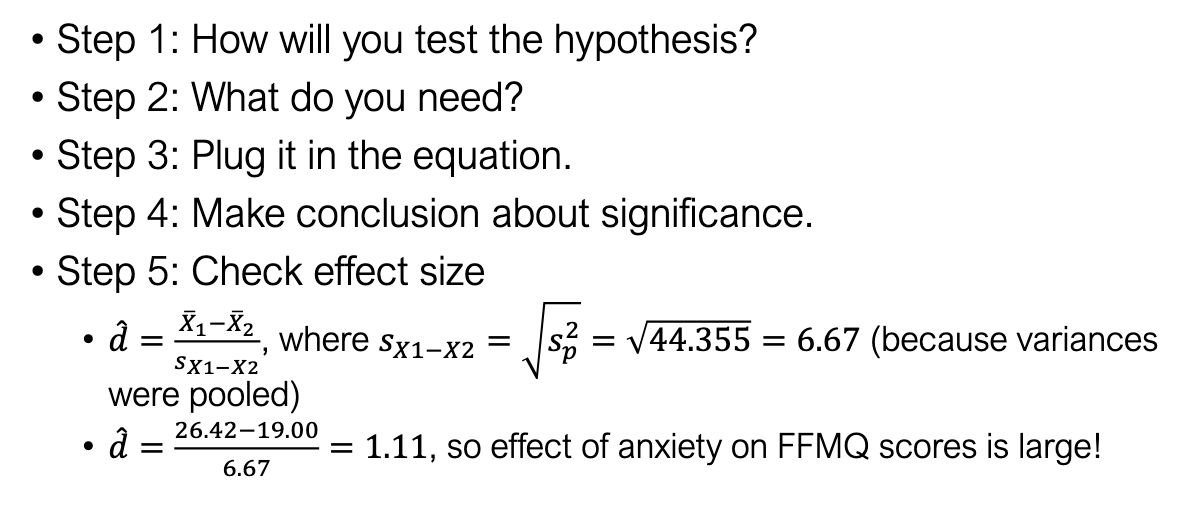
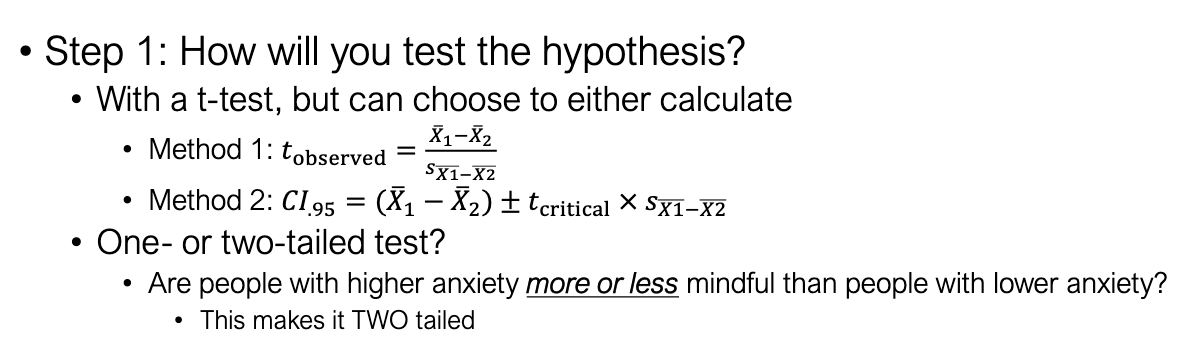
What are the 5 steps of hypothesis testing (applied to mindfulness/anxiety)?
State hypotheses.
Choose test (independent t-test).
Gather what’s needed (means, variances, n, SE).
Calculate t and make decision.
Check effect size.
How do we choose the test and decide 1- vs 2-tailed for mindfulness/anxiety?
Test: Independent t-test.
Method:
Option 1: Compute tobs
Option 2: Compute CI.
Tail: TWO-tailed (question is whether mindfulness differs, not directional).
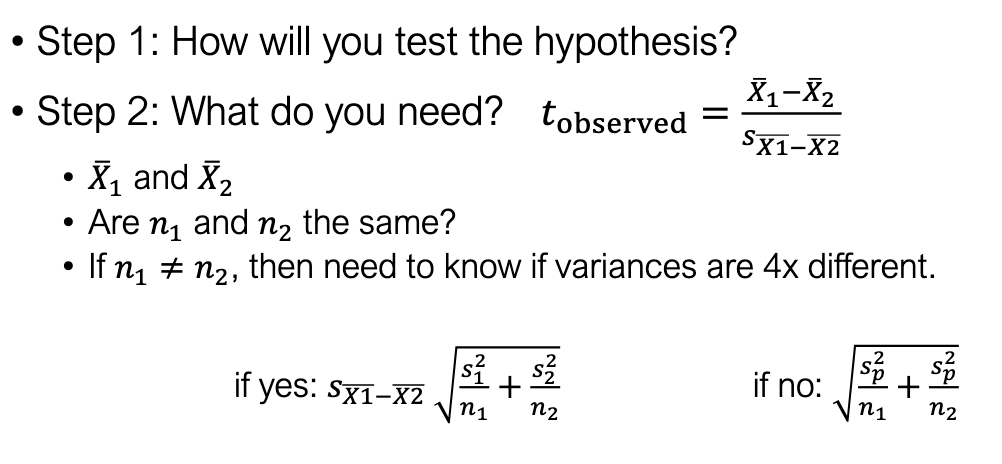
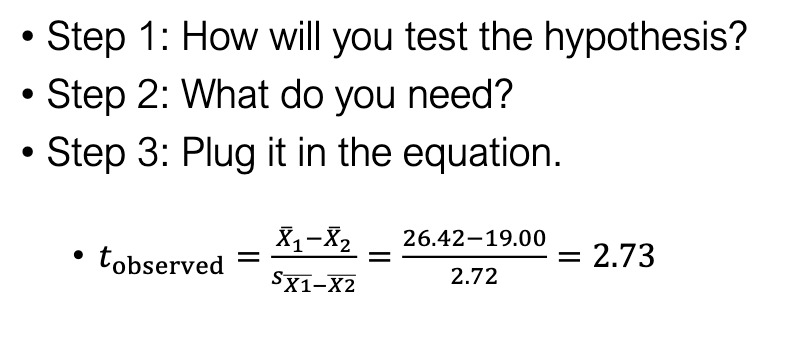
What info do we need to compute tobs in mindfulness/anxiety?
Group means (X1, X2)
Group sizes (n1, n2)
Variances (s21, s22)
Decide: pool or not?
If n1=n2 and variances ≈ equal → pool.
If variances ≥4× different → don’t pool.
How do we compute pooled variance for mindfulness/anxiety?
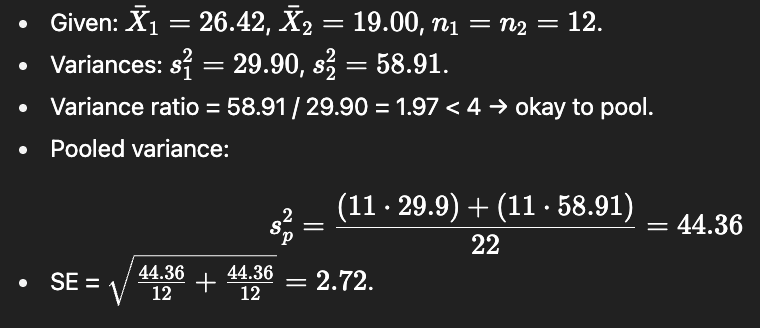
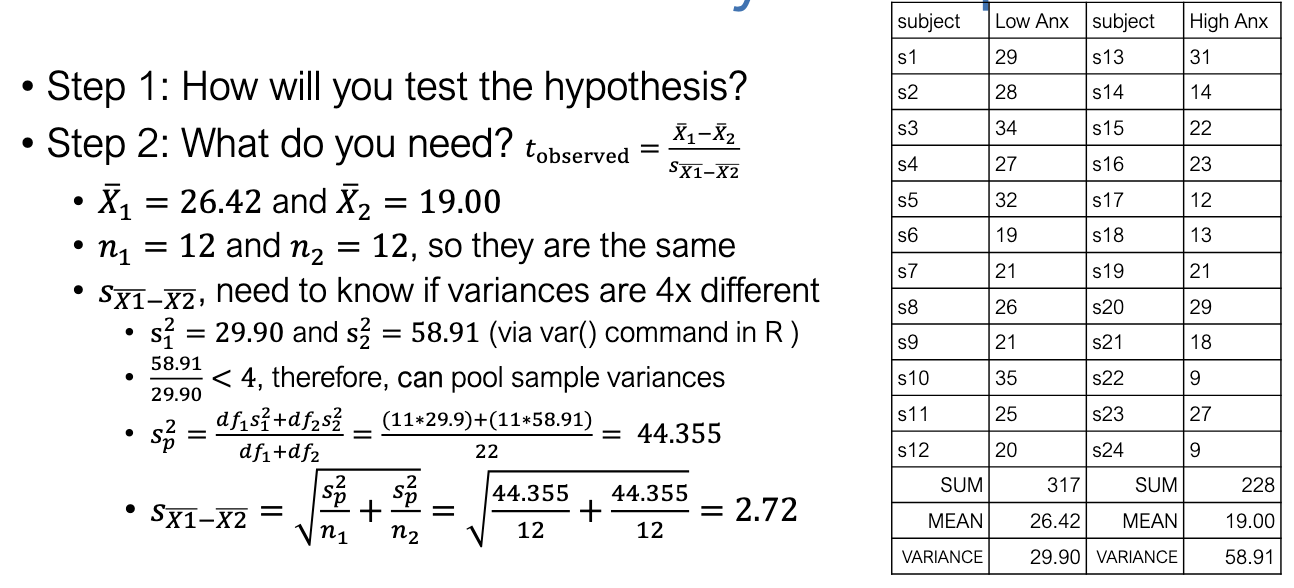
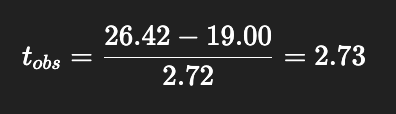
What is the observed t-value for mindfulness/anxiety?
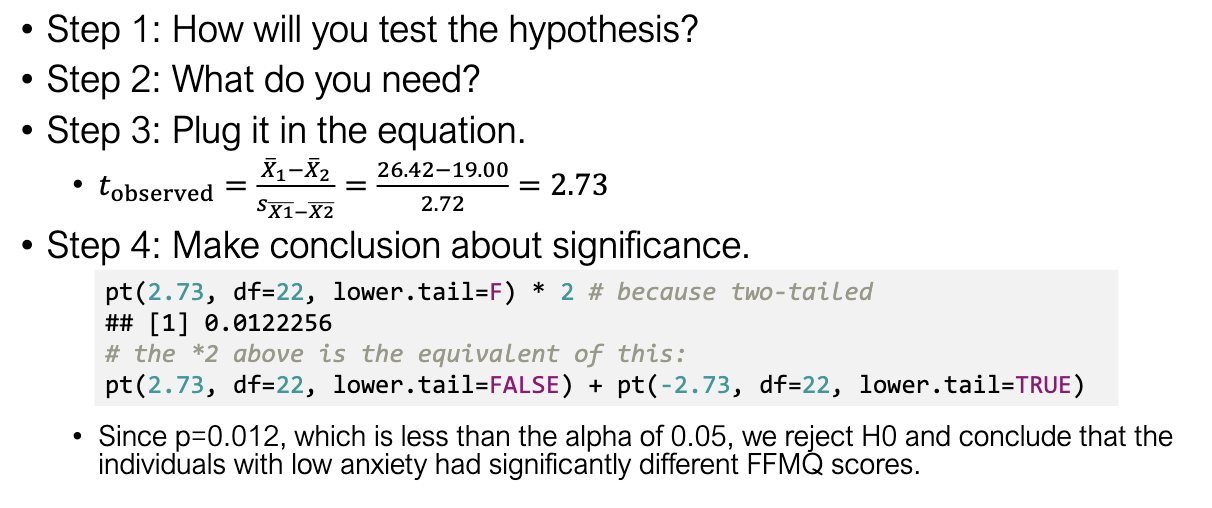
What is the conclusion from the mindfulness/anxiety test?
tobs=2.73=2.73, p = 0.012 (< 0.05).
Reject H0
Conclusion: Low- and high-anxiety groups differ in mindfulness scores.
What is the effect size for mindfulness/anxiety, and how do we interpret it?