3.3 macroeconomic objectives
1/119
There's no tags or description
Looks like no tags are added yet.
Name | Mastery | Learn | Test | Matching | Spaced | Call with Kai |
|---|
No analytics yet
Send a link to your students to track their progress
120 Terms
ECONOMIC GROWTH
economic growth definition
the ability of the economy to increase the production of goods and services, the sustainable increase in a country's real GDP over time
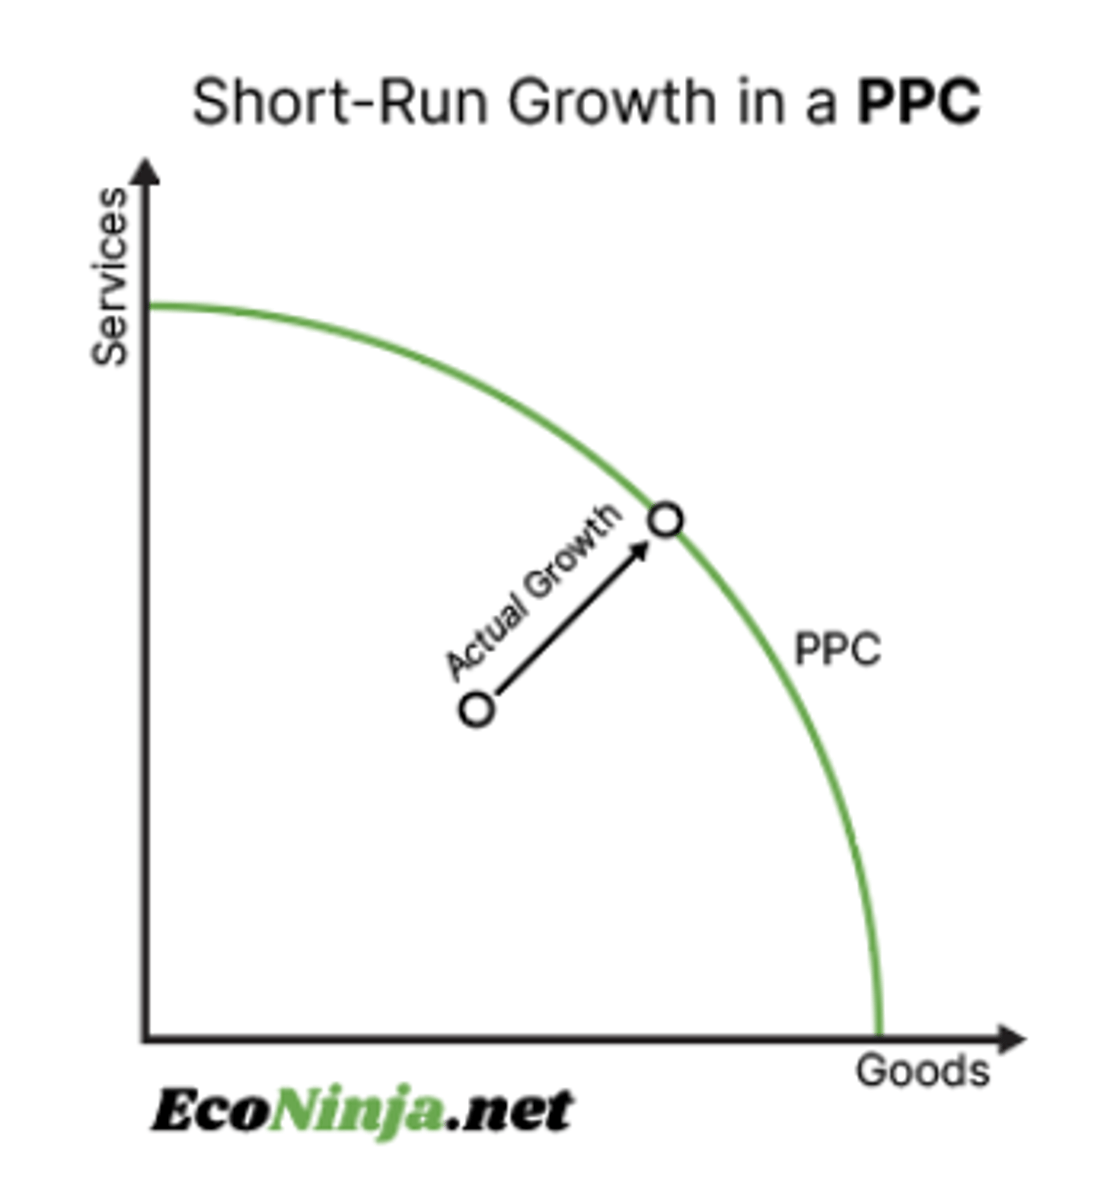
short-term growth
Growth of an economy (growth in real output) over relatively short periods of time;
(i) a movement of a point inside the production possibilities curve (PPC) to a point closer to the PPC (see actual growth), or
(ii) by upturns in the business cycle usually due to increases in aggregate demand.
short-run growth in a PPC
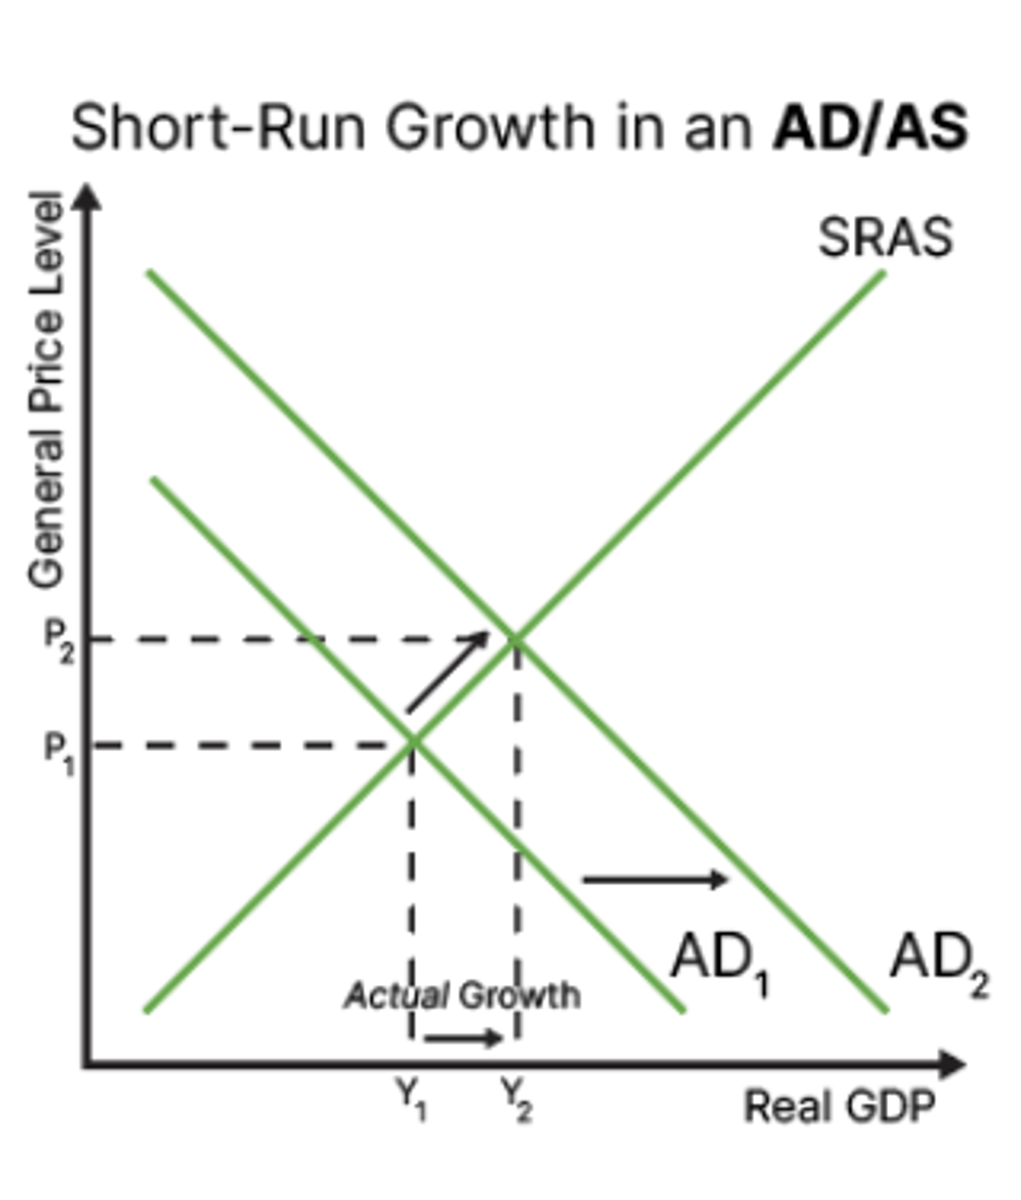
short-run growth in AD/AS
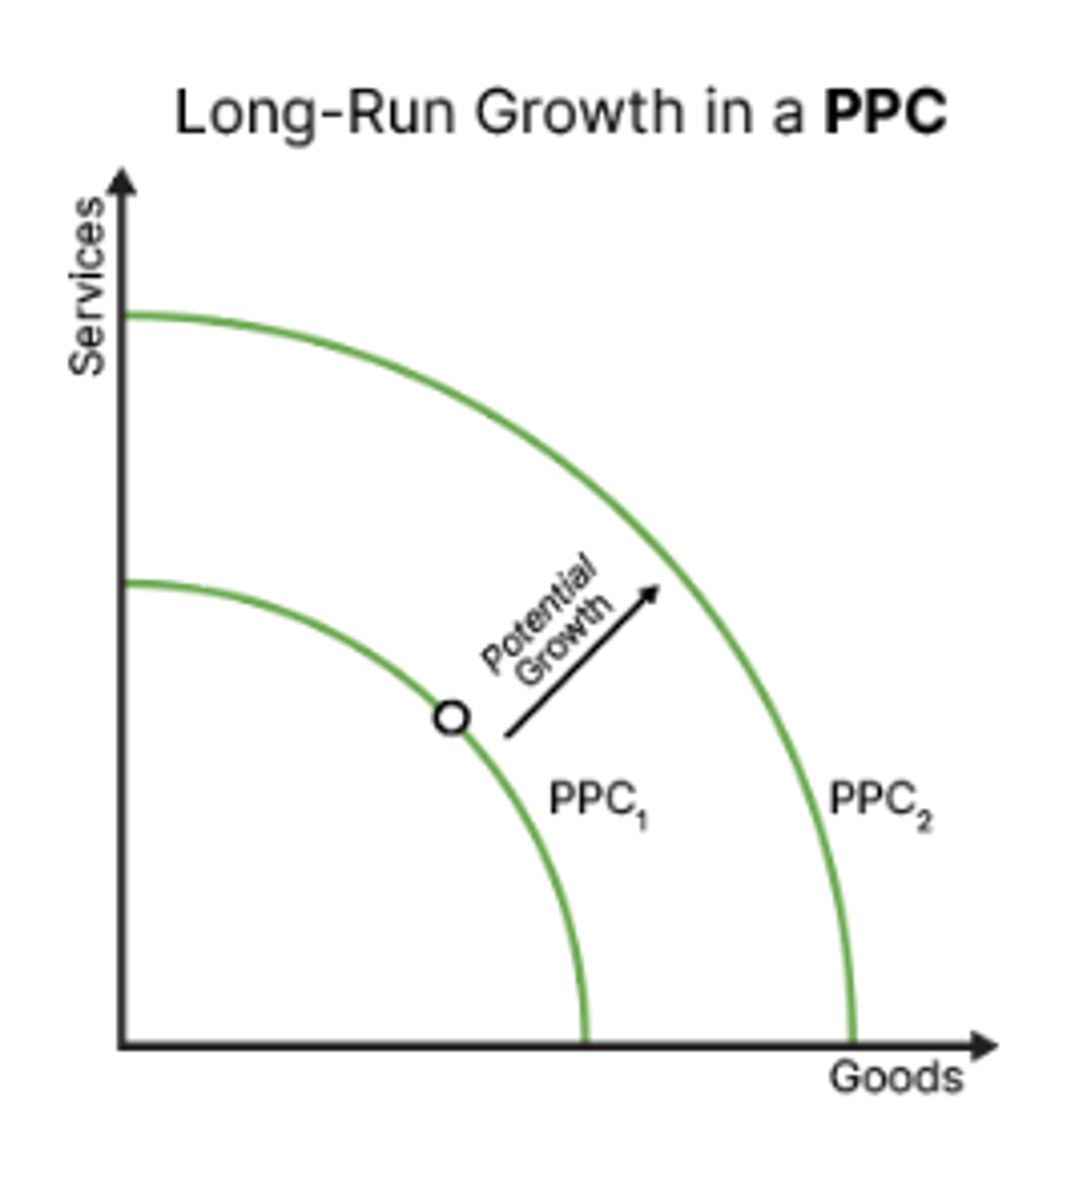
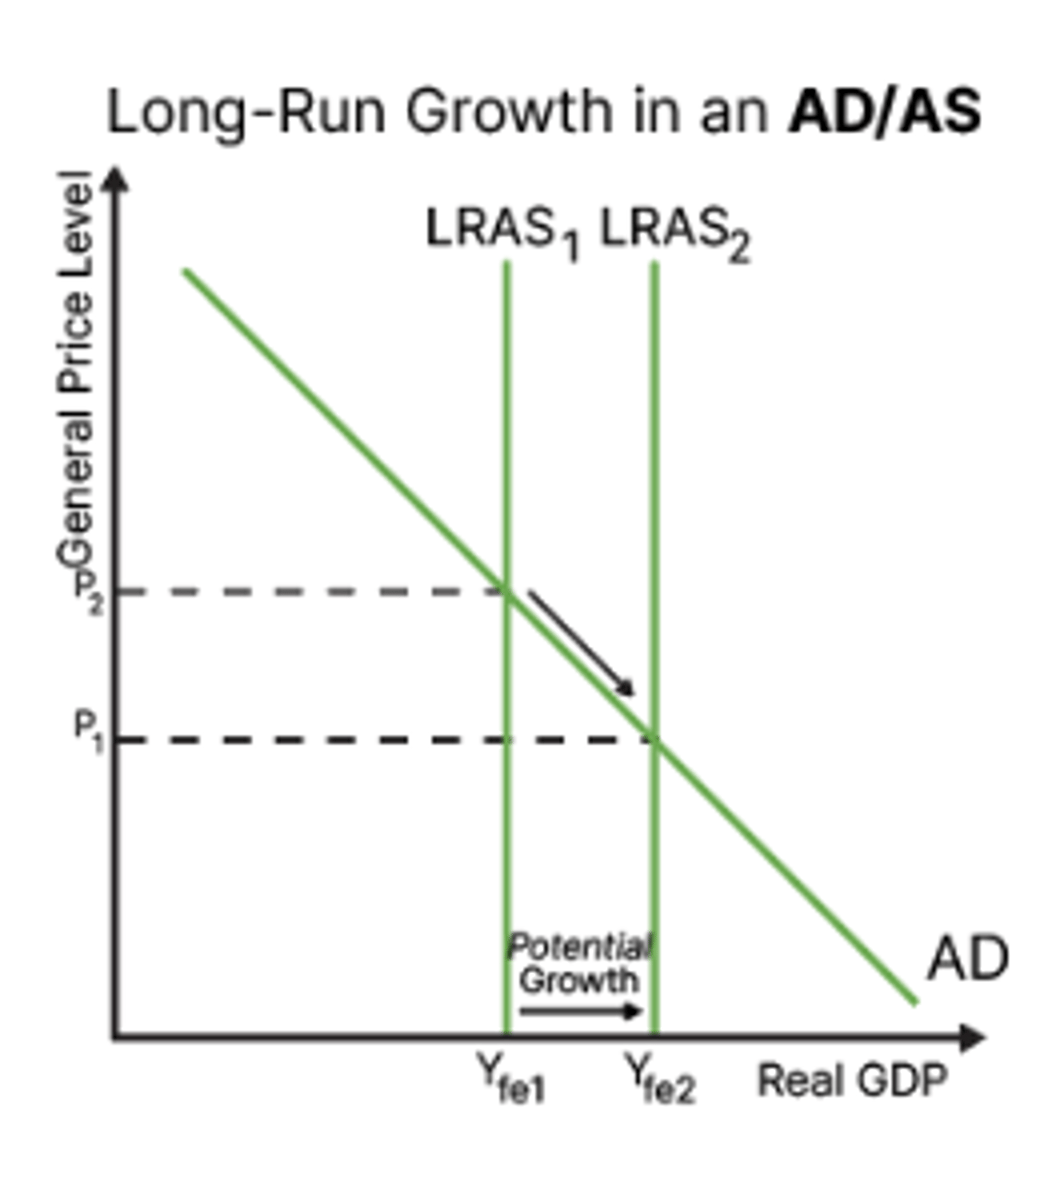
long term growth
potential growth in the economy : in the long run, the economy could get to this point
long-run growth in a PPC
long-run growth in AD/AS
measurement of economic growth
can be measured by comparing GDP or GNI values from different times
growth in percent formula (percentage change)
Growth in percent = [(New GDP - Old GDP) ÷ Old GDP]x 100
growth in percent benchmark
GDP
Growth < 3% means unemployment will rise
Growth > 4% results in inflation
consequences of economic growth
- living standards
- environment
- income distribution
impact on living standards
Economic growth generally leads to improvements in living standards. It may decrease poverty levels, increase spending (on both merit and demerit goods), increase cost of living, risk higher inflation, and increase investment. This is why economic growth is desired.
impact on the environment
Economic growth may create negative externalities on the environment, as market failure may result in issues such as climate change, destruction of the ozone layer, and overfishing. Current consumption of raw materials on earth is not sustainable in the long run.
impact on income distribution
Economic growth usually creates higher gaps between the wealthy and the poor, both in terms of income and wealth. Governments may generate more tax revenue which they can then spend on helping the poor, but income and wealth gaps tend to increase as economies grow.
LOW UNEMPLOYMENT
employment
the use of all factors of production in the process of producing goods and services, not only the labour force
the unemployed
the total number of people actively seeking work but are not employed, out of the labour force
a labour force
a country’s population that is able to work, consisting of workers actively working plus the unemployed (seeking work)
a non-labour force
includes all those not seeking work e.g. stay at home parents, pensioners, students
full employment
describes the ideal situation when everyone in the economy who is willing and able to work has a job
unemployment rate formula
(no. of unemployed ÷ total labour force) x 100
labour force formula
no. employed + no. unemployed
employment rate formula
(no. of employed ÷ population of working age) x 100
labour force participation rate
(labour force ÷ total population) x 100
difficulties of measuring unemployment
1. hidden unemployment
2. underemployment
3. voluntary unemployment
4. retraining
5. disparities
hidden unemployment
people who become discouraged and stop looking for a job are no longer counted as unemployed
many people give up after many months of searching, and while they are unemployed, they don't count in the measurement. these are called discouraged workers
underemployment
Some people are working, but would like to work more, but can't find anything. They also don't count in the unemployment figure.
voluntary unemployment
Some people don't want to work. They also don't count to the figure.
retraining
students/people in training are not counted as unemployed
disparities in a country are not recognised
age, level of education, skill level, geographic region, gender, none of these things are accounted for in a nationwide figure
→ don't provide insight into ethnic, regional, gender or youth unemployment disparities which may exist in an economy
types of unemployment
1. cyclical
2. structural
3. seasonal
4. frictional
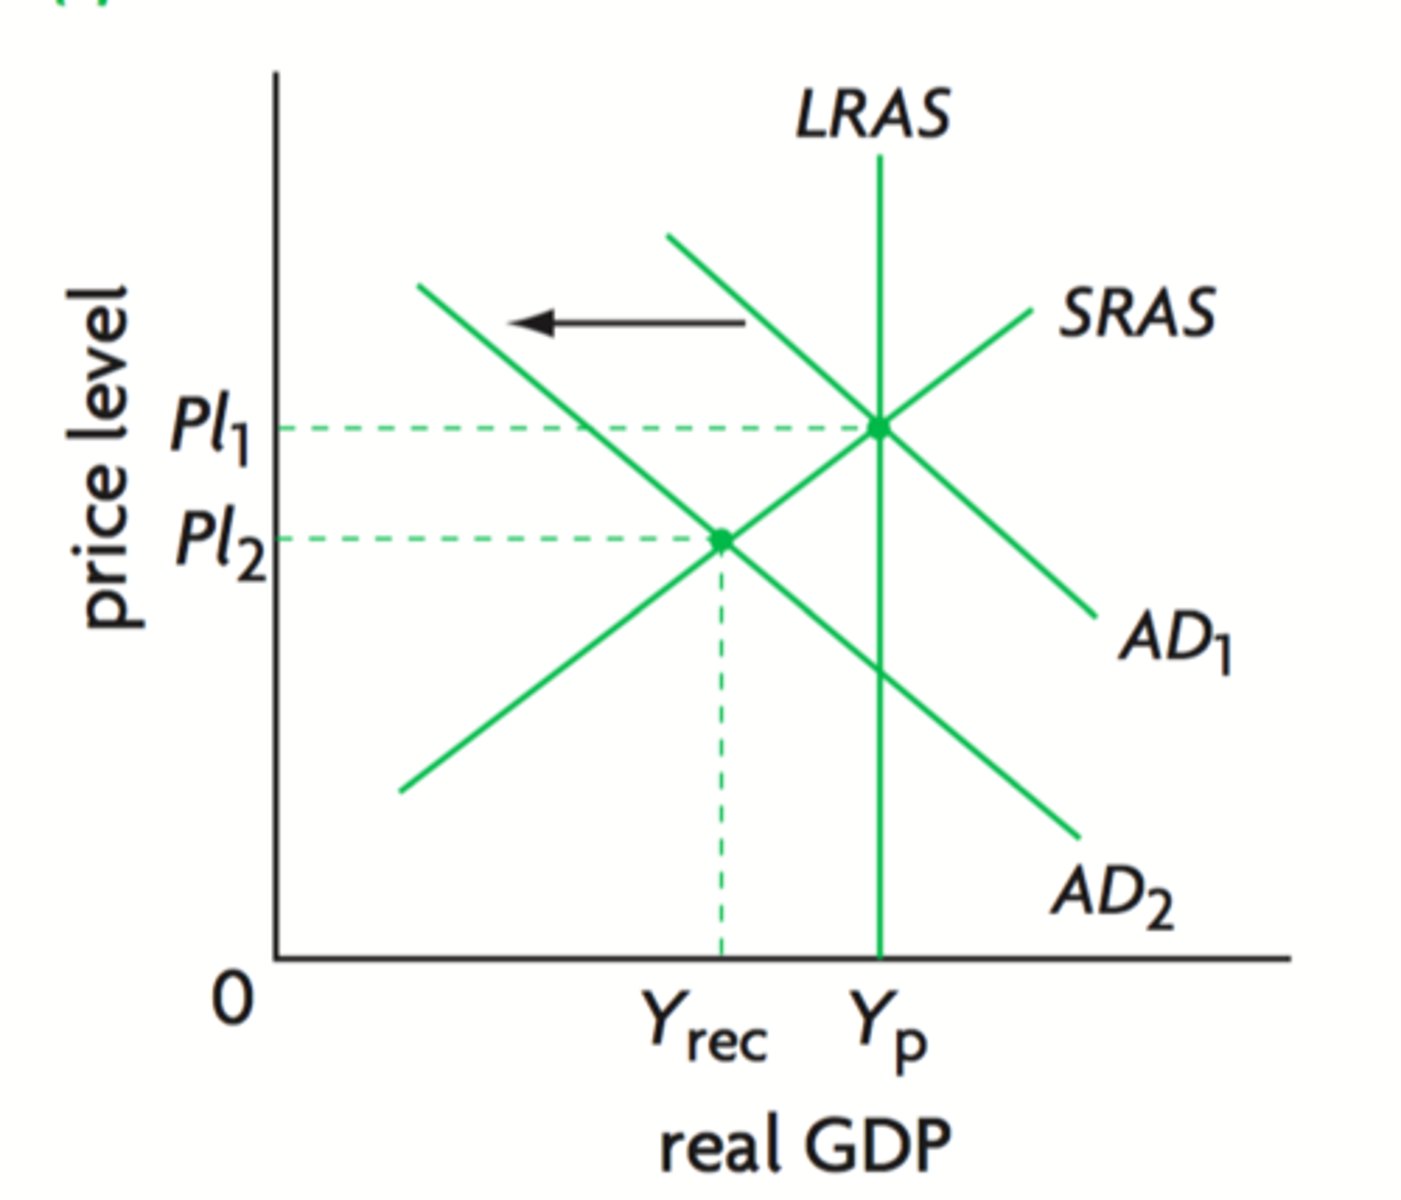
cyclical unemployment
Unemployment as a result of a downturn in the business cycle (a lack of demand for work). It can be represented using a deflationary gap on an AD/AS curve.
deviation of unemployment from its natural rate
cause of cyclical unemployment
a downturn in the economy = a fall in AD = fall in output = wages fall
cyclical unemployment diagram
deflationary gap
actions that can be taken (cyclical)
methods to minimize troughs in the business cycle such as transfer payments (unemployment benefits, family allowance)
this gives lower income earners more money in their pockets to spend in the economy
government policy to increase AD such as expansionary fiscal policy and/or monetary policy
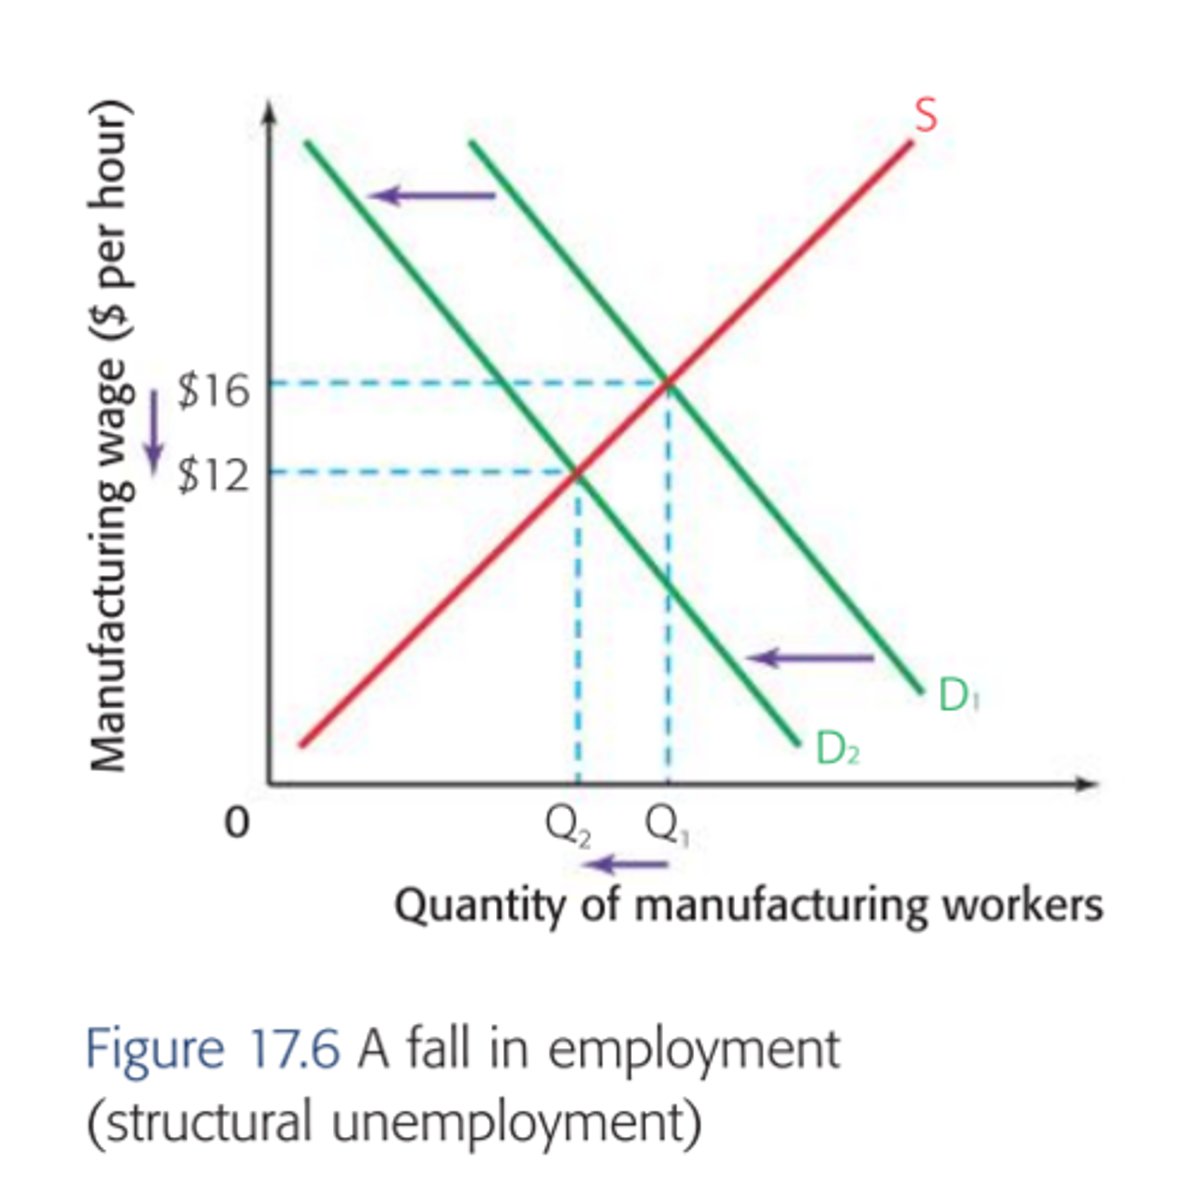
structural unemployment
Unemployment as a result of a skill mismatch. It takes time to learn new skills and it might involve you having to move.
can happen as the structure of an economy changes and there is no longer a need for a specific type of worker
causes of structural employment
1. changes in demand for particular skills or industries
2. changes in geographical location of jobs
3. labor market rigidies (minimum wage legislation that stop firms from paying lower wages)
structural unemployment diagram (mismatch of skills/location)
- when demand for labour shifts left as workers are no longer required
- fall in demand for labour caused by mismatch of skills or geographic relocation of employment
- demand for labour is derived from the demand for products if the industry - becomes less important then it will employ less workers
- if workers don't receive help to retrain, they are often left unemployed
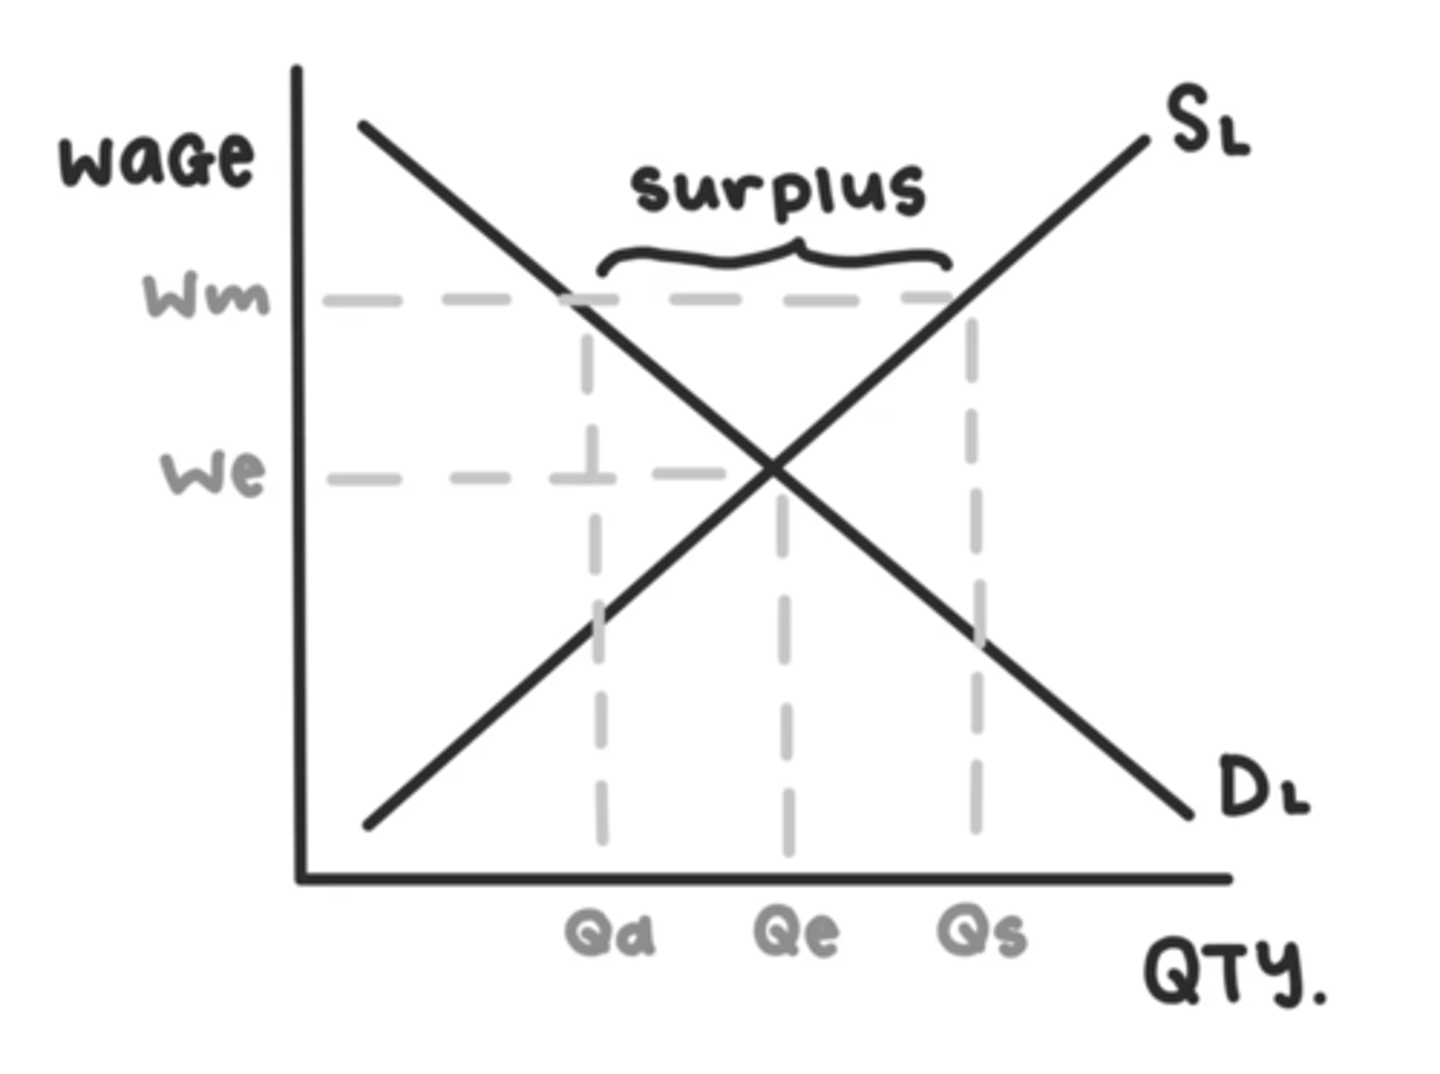
structural unemployment diagram (labor marker rigidities)
actions to PREVENT structural employment
- retrain workers so they have different skill sets and are able to get different kinds of jobs
- classical economist would argue that removing labour market rigidities would increase employment (there will be more people able to work at the lower wage because there will be more labor demanded)
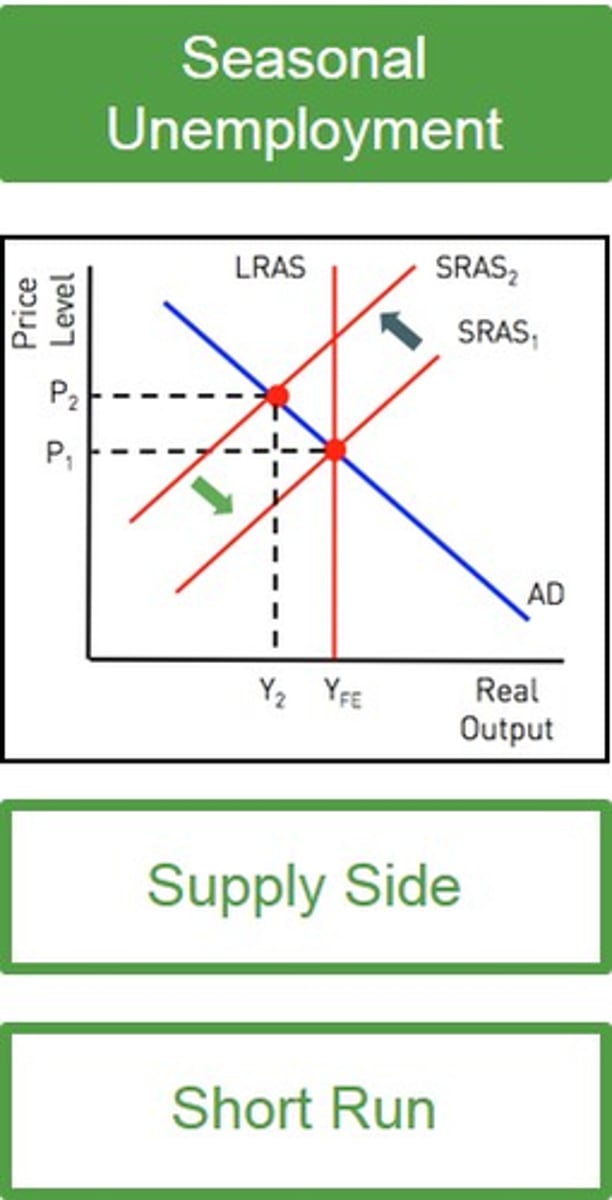
seasonal unemployment
occurs as certain seasons come to an end and labour is not required until the next season, associated with seasonal industries
e.g. tourism, fruit pickers, seaside resort workers, ski instructors
→ supply-side problem
seasonal unemployment diagram
actions to prevent seasonal unemployment
- make it easier for people to be matched with new work
- diversify the economy so that different jobs are available that are less seasonal
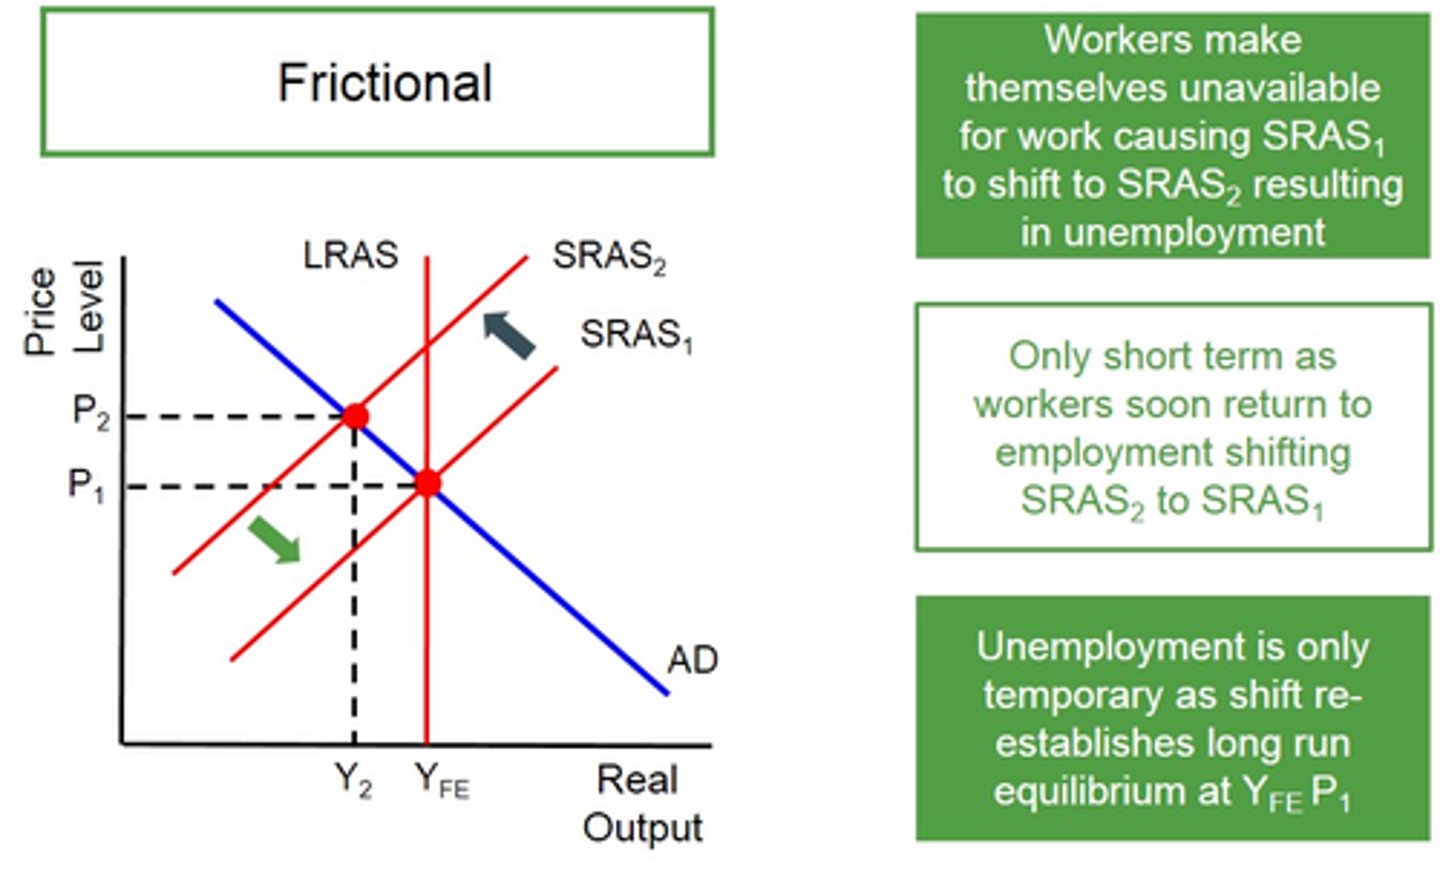
frictional unemployment
Unemployment as people are transitioning to a new job. There will be a few weeks/months in which people are updating their resumes, applying for jobs, and attending interviews.
→ usually short-term unemployment
actions to prevent frictional unemployment
- try to reduce the time it takes to find a new job
- set up job centers to make it easier to find work and spend less time unemployed
frictional unemployment diagram
natural rate of unemployment
This is the equilibrium rate of unemployment. There will always be structural, seasonal, and frictional unemployment in an economy.
→ the lowest achievable level of unemployment in an economy (the unemployment rate can never be 0% as there is always some unemployment)
NRU formula
= frictional + seasonal + structural unemployment
full employment level of output =
= zero cyclical unemployment = natural rate of unemployment
minimum wage vs NRU
A minimum wage disturbs this equilibrium, as more people will be willing to work at the minimum wage than what firms will employ. It acts as a price floor, increasing quantity supplied and decreasing quantity demanded.
costs of unemployment
- personal
- social
- economic
personal costs
Stress, poverty, bad for family relationships
social costs
Crime, indebtedness, social deprivation
economic costs
Lower GDP, lower tax revenues, more unemployment benefits, more inequality
LOW + STABLE INFLATION

inflation
the sustained rise in the general price level in an economy over time
disinflation
occurs when the average price level is still rising/is positive, but at a lower rate than before
⇒ inflation is increasing but at a decreasing rate
price stability
refers to the general price level remains constant as a result of low and stable inflation.
how to measure inflation
the average price level is measured by checking the prices of a ‘basket’ of goods/services that an average household will purchase each month
➜ this is turned into an index called the consumer price index
base year
year serving as point of comparison for other years in a price index or other statistical measure
CPI formula
CPI = (cost of basket in year (x) ÷ cost of basket in base year) x100
inflation rate for the period
the percentage difference in CPI between 2 years is the inflation rate for the period
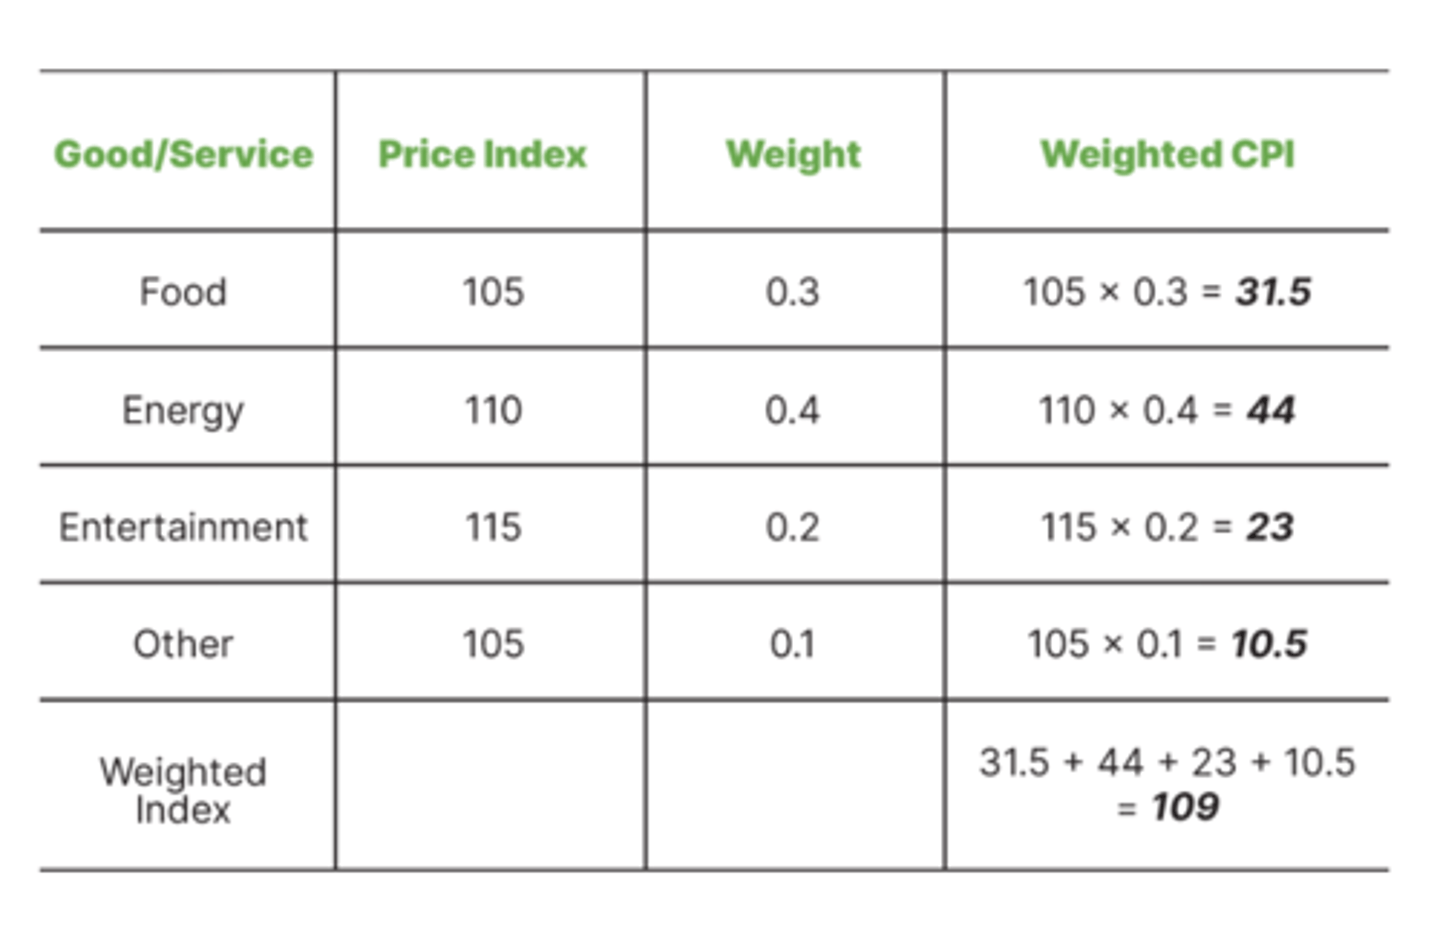
what does price x weighting determine
determines final value of the g/s in the basket, the final values are added to determine price of the basket
base index
100
at the base year...
the price index of goods and services are equal to 100. Changes in this price index can be measured by comparing to the base year. If the CPI is 110 the next year, there has been a 10% inflation in that year.
measuring change in CPI
Measuring the change in CPI is done by collecting information of prices of a typical household's expenditures. This typically includes food, gas, and transport.
percentage change
= [(New-Old)/Old] x 100
inflation calculations
However, goods and services usually have different weights, as some things are purchased more by households than others.In that case, simply multiply the price index of the category by the weight ->
limitations of measuring inflation using CPI
- Not all households have the same expenditures, and CPI only accounts for an average household.
- Inflation can vary within regions of a country, and CPI only accounts for the general price level.
- CPI does not measure changes in product quality. Something might become more expensive, but also have better features (Nokia phones -> Smartphones)
- Consumption patterns change over time, so the "basket" that CPI uses will have to change.
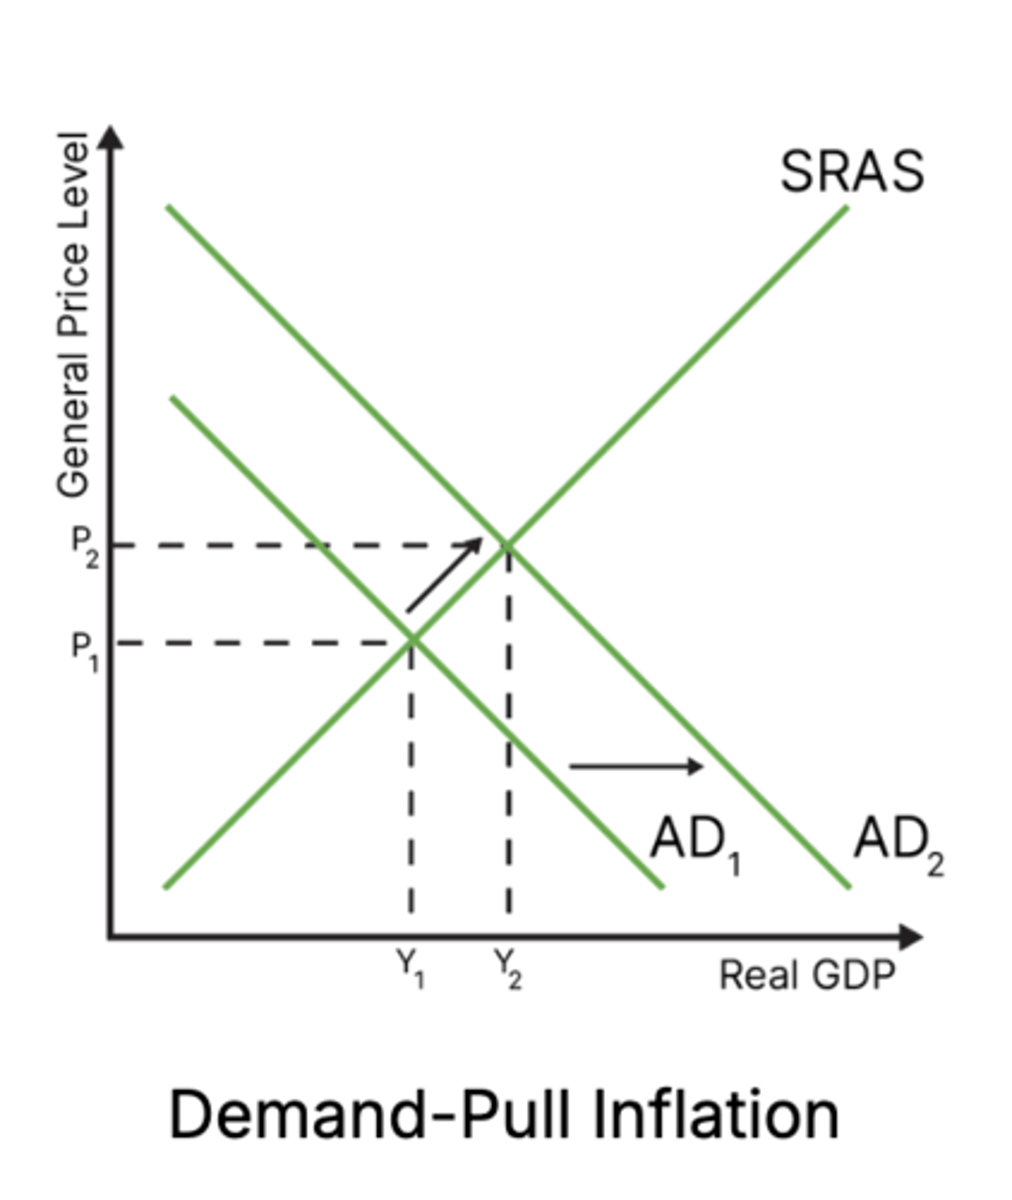
demand-pull inflation
Inflation is caused by higher/excess demand for goods and services in the economy, which grows faster than the supply.
Considered the "good" inflation, because while the general price level rises, real GDP does so, too.
demand-pull diagram
- if any of the four components of AD increase (ceteris paribus), there will be a shift to the right of the AD curve from AD1 to AD2
at the original price (AP1/PL1)
- there is now a condition of excess demand in the economy
- as prices rise, there is a contraction of AD and an extension of SRAS
- prices for goods/services are bid up from AP1 → AP2 (PL1 → PL2)
- demand pull inflation has occured
- if the central bank lowers the base rate, there is likely to be increased borrowing by firms and consumers
- this will result in an increase in consumption and investment likely to lead to a form of demand pull inflation
cost-push inflation
Inflation is caused by higher costs of production, shifting AS to the left.
Considered the "bad" inflation, because prices rise and real GDP shrinks.
cost-push diagram
- if any of the COP increase (labour, raw materials etc.) or if there is a fall in productivity, there will be a shift to the left of the SRAS curve
- at the original price (AP1/PL1) there is now a condition of excess demand in the economy
- as prices rise, there is a contraction of AD and an extension of SRAS
- prices for g/s are bid up from AP1 → AP2 (PL1 → PL2)

costs of high inflation : firms
- uncertainty and low confidence
- menu price change costs
costs of high inflation : consumers
- decrease in purchasing power
- decrease in real value of savings
- fall in real income
- more harmful to low income households
costs of high inflation : government
- inflation erodes international competitiveness of export industries
- economic growth may slow
- trade-offs involved in tacking inflation
costs of high inflation : workers
- demand higher wages
- if wages increases ≠ inflation
deflation
the sustained fall in the general price level in an economy over time (the exact opposite of inflation)
(only occurs when % change in price is below zero)
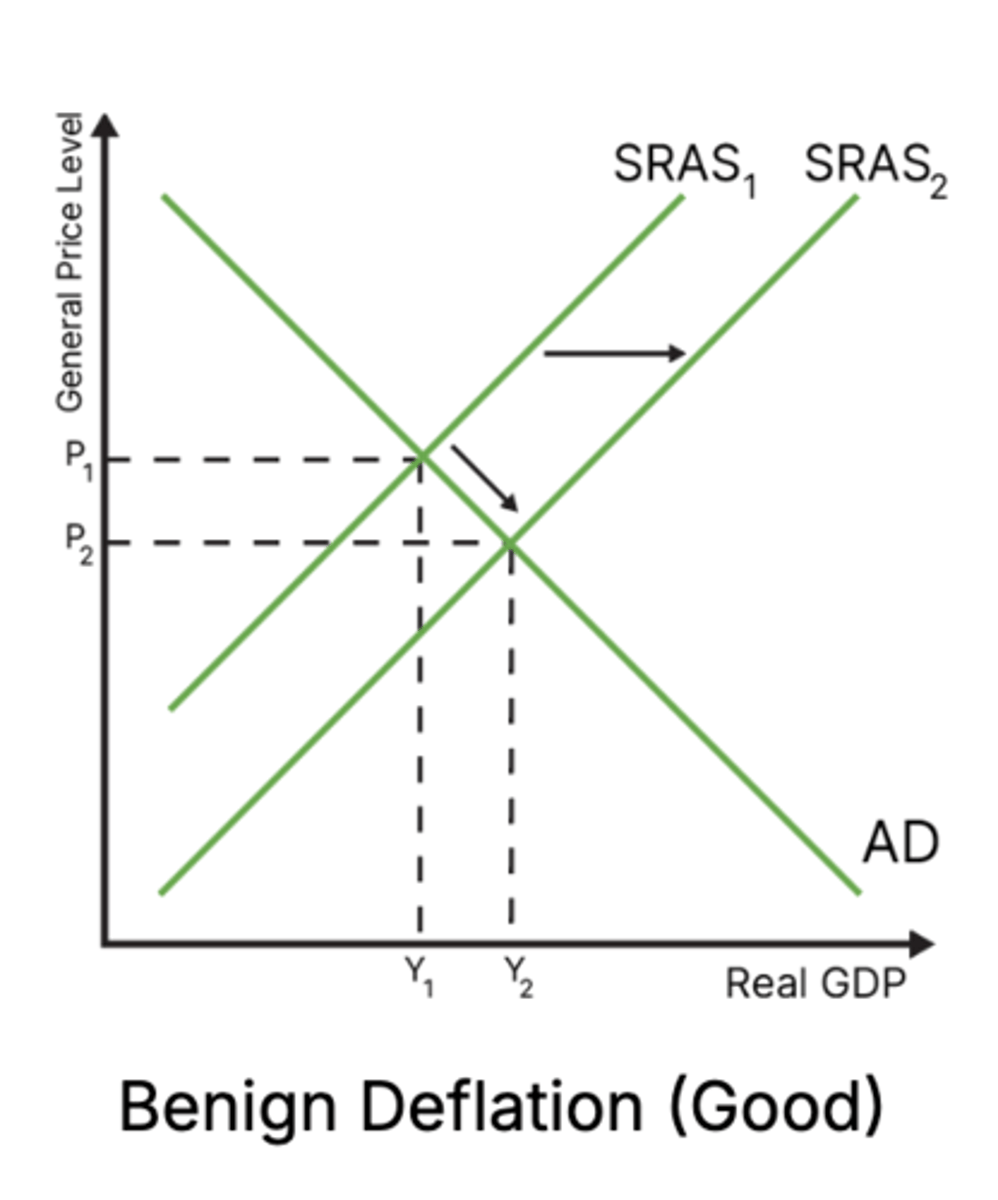
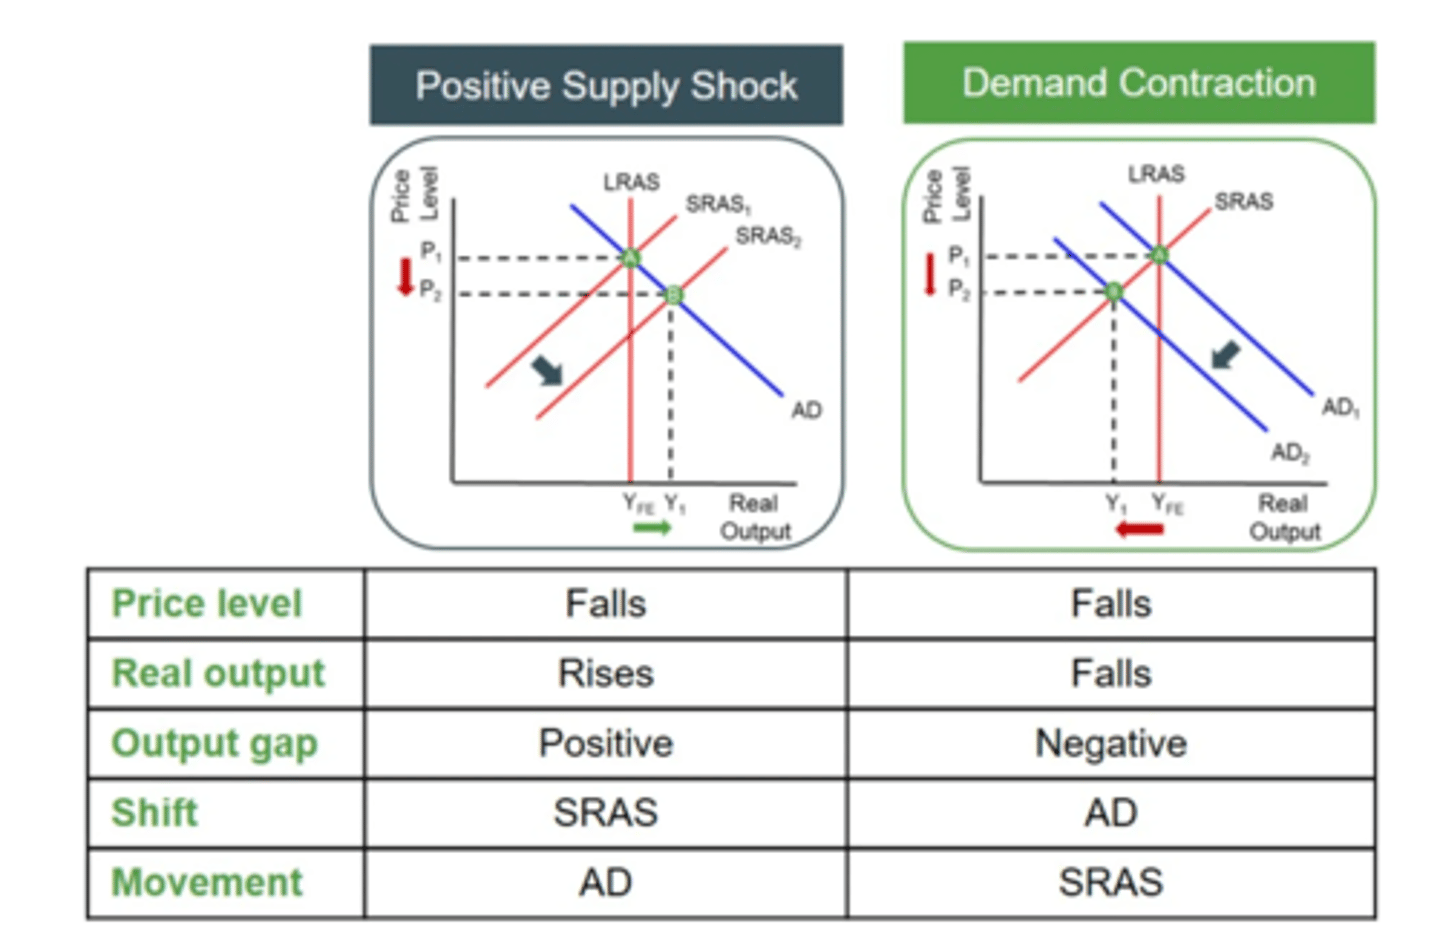
benign (good/supply-side) deflation
supply side deflation is caused by increases in the productive capacity of the economy
- this is caused by any increase in the quality/quantity of the factors of production
- it effectively creates a condition of excess supply in the economy
- average price levels fall national output (rGDP) increases
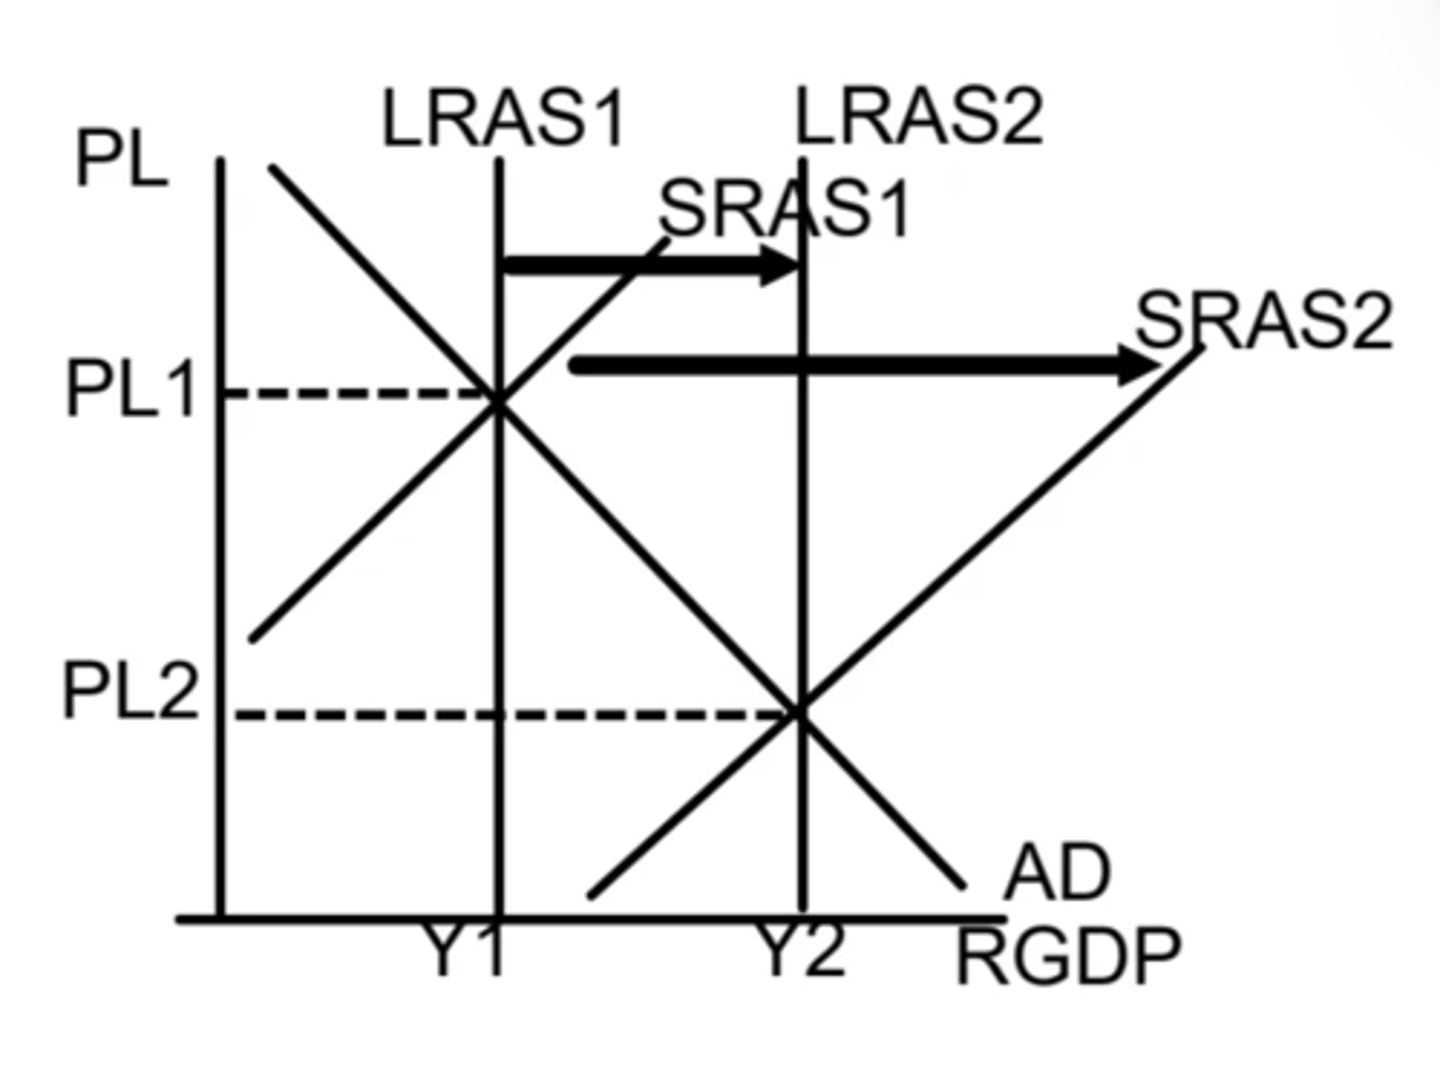
benign/good deflation (with LRAS)
⇒ a shift in LRAS and SRAS, with AD remaining constant
- improvements in technology, increases productivity and lowers COP
- associated with economic expansion, lower unemployment, rising incomes
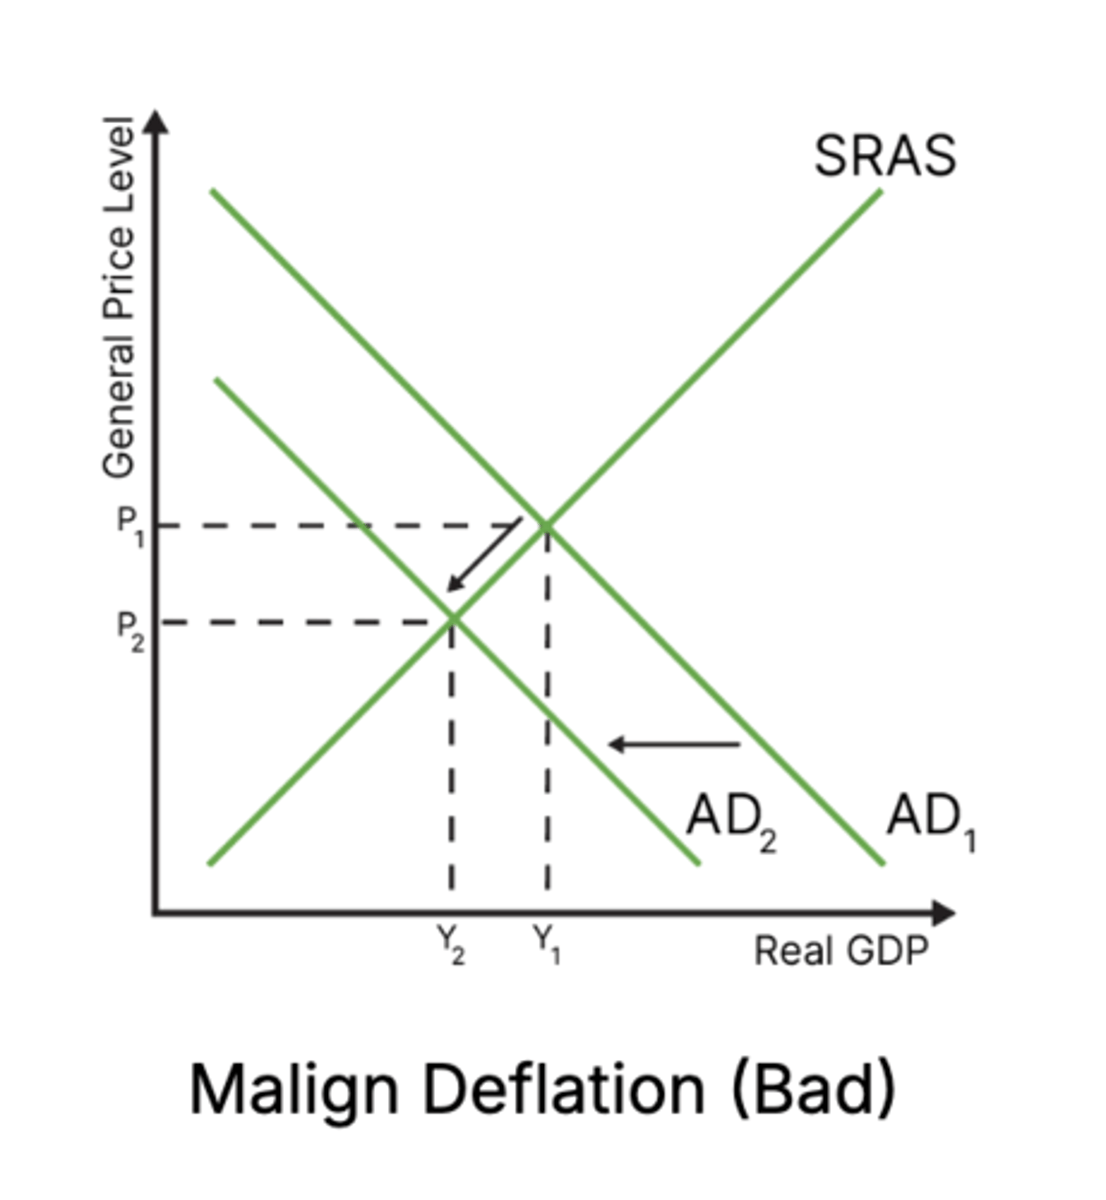
malign (demand-side) deflation
Malign deflation occurs when AD shifts to the left. This is bad because while prices go down, so does real GDP.
if any of the four components of rGDP decrease there will be a decrease in AD, leading to a decrease of the average price level
this can lead to a deflationary spiral
demand vs supply deflation
costs of deflation
- uncertainty
- borrowers lose money, savers money worth more, lenders get more
- deferred consumption = even less C = deflationary spiral
- high levels of cyclical unemployment and bankruptcies
- increase in real value of debt
- inefficient resource allocation
- policy ineffectiveness
SUSTAINABLE LEVEL OF DEBT

government debt
refers to the total amount of money owed by the government to lenders.
sustainable levels of government debt
refers to a situation where the government's borrowing and debt levels are manageable and they are able to manage repayments without placing their economy at risk
considered a macroeconomic objective because the level of government debt can have wide-ranging impacts on the economy as a whole
repeated budget deficit / spending
Governments may run deficits (spending > income) in order to try to achieve other macroeconomic objectives. However, repeated budget deficits will lead to debt.
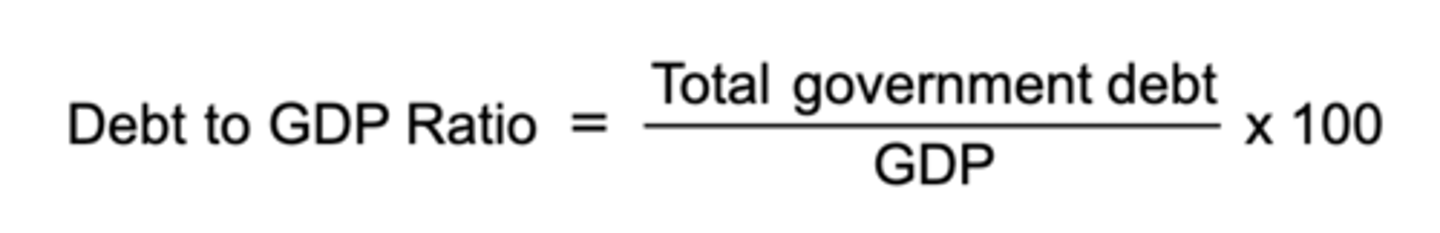
a debt to GDP ratio
the government's debt as a percentage of GDP.
can be used to measure the amount of debt in relation to the economy's size
e.g. the US has more debt than Japan, but not when compared to their economies
a debt to GDP ratio : higher percentage
indicates a larger debt burden relative to the size of the economy, which could raise concerns about debt sustainability
a debt to GDP ratio : lower ratio
suggests a more manageable debt level
costs of high government debt
- debt servicing costs
- credit ratings
- impact on future taxation and spending
debt servicing costs
The money the government has to pay back (initial amount + interest rates). This will be higher when there is more debt.
credit ratings (debt)
A rating of a borrower's ability to repay a loan. This rating tends to be lower for countries that already have more debt, making it harder to get better loans later.
impact on future taxation & spending
The money will have to be paid back at some point. Therefore, future sacrifices are made when taking on debt now.
reasons why sustainable government debt is important
- economic stability
- fiscal sustainability
- intergenerational equity
- monetary policy effectiveness
- external vulnerability
budget deficit & government debt
Budget deficits contribute to the accumulation of government debt
- When a government runs a budget deficit, it needs to borrow money to cover the shortfall
- As the government issues bonds or takes loans to finance its deficit, this borrowing adds to the outstanding government debt
budget surplus & government debt
Budget surpluses can help reduce government debt
- In a surplus situation, the government's total revenues exceed its total expenditures
- This surplus can be used to repay outstanding debt, thereby reducing the overall debt burden
determinants of debt accumulation
- budget deficit
- interest payments on existing debt
- economic conditions
- fiscal policies
- debt management practices (plays a role in determining the trajectory of govt. debt)
high levels of government debt
may mean that financial markets view offering any new loans to a government as risky