stuff
 Call Kai
 Learn
Learn Practice Test
 Spaced Repetition
 Match
Match Flashcards
 Knowt Play
1/114

There's no tags or description
Looks like no tags are added yet.
Name | Mastery | Learn | Test | Matching | Spaced | Call with Kai | Chat |
|---|
No analytics yet
Send a link to your students to track their progress
115 Terms
give one possible benefit to fritilarry butterflies with genetic biodiversity (2 mark)
allows adaptation for environmental changes
provides variation for natural selection
can offer, camouflage / protection from predators
Beavers are considered to be a keystone species in Canada, where they…
• constructed dams – the largest of which was 18 m long and 1.6 m high
• felled trees
• created canals
• built lodges (large nests)
• successfully reproduced
explain why they are considered a keystone species in their native Canada. (2 marks)
have significant effect on ecosystem✓
many other species rely on activity of beavers✓
One benefit of the reintroduction of beavers in Scotland was an increase in habitat diversity. Explain how the following activities could have contributed to increased habitat diversity (3 marks)
constructed dams
felled trees
built lodges
constructed dams
flooded areas upstream / reduced flow rate downstream creating still / slow moving water for aquatic species✓
felled trees
opened up tree canopy allowing light to ground level✓
built lodges
creates sheltered habitat for insect species / beaver parasites✓
Beavers are considered to be a keystone species in Canada, where they…
• constructed dams – the largest of which was 18 m long and 1.6 m high
• felled trees
• created canals
• built lodges (large nests)
• successfully reproduced
increasing habitat diversity may lead to an increase in species diversity and genetic diversity.
explain why species diversity and genetic diversity may be increased as a result of the beavers’ activity. (2 marks)
species diversity will increase as more species live in new habitats
genetic diversity will increase as species have a wider range of conditions in which to live

Calculate the total percentage decrease in the number of butterflies on farmland between 1992 and 2012. Show your working. Give your answer to the nearest whole number. (2 marks)
1992: 110 butterflies
2012: 79 butterflies
28%

Using the data given in Fig. 5, compare the changes in the number of butterflies on farmland and on woodland between 1992 and 2012. (2 marks)
number in farmland stays higher than in woodland ✓
number of butterflies in woodland, has a greater decrease / drops faster / falls more steeply, (than those on farmland) or number of butterflies on farmland, has a smaller decrease / drops slower / falls less steeply, (than those in woodland) ✓
from 2004 to 2012 they both fall by, similar / same, rate or by 6 (per km2) ✓
COMPARITIVE LANGUAGE
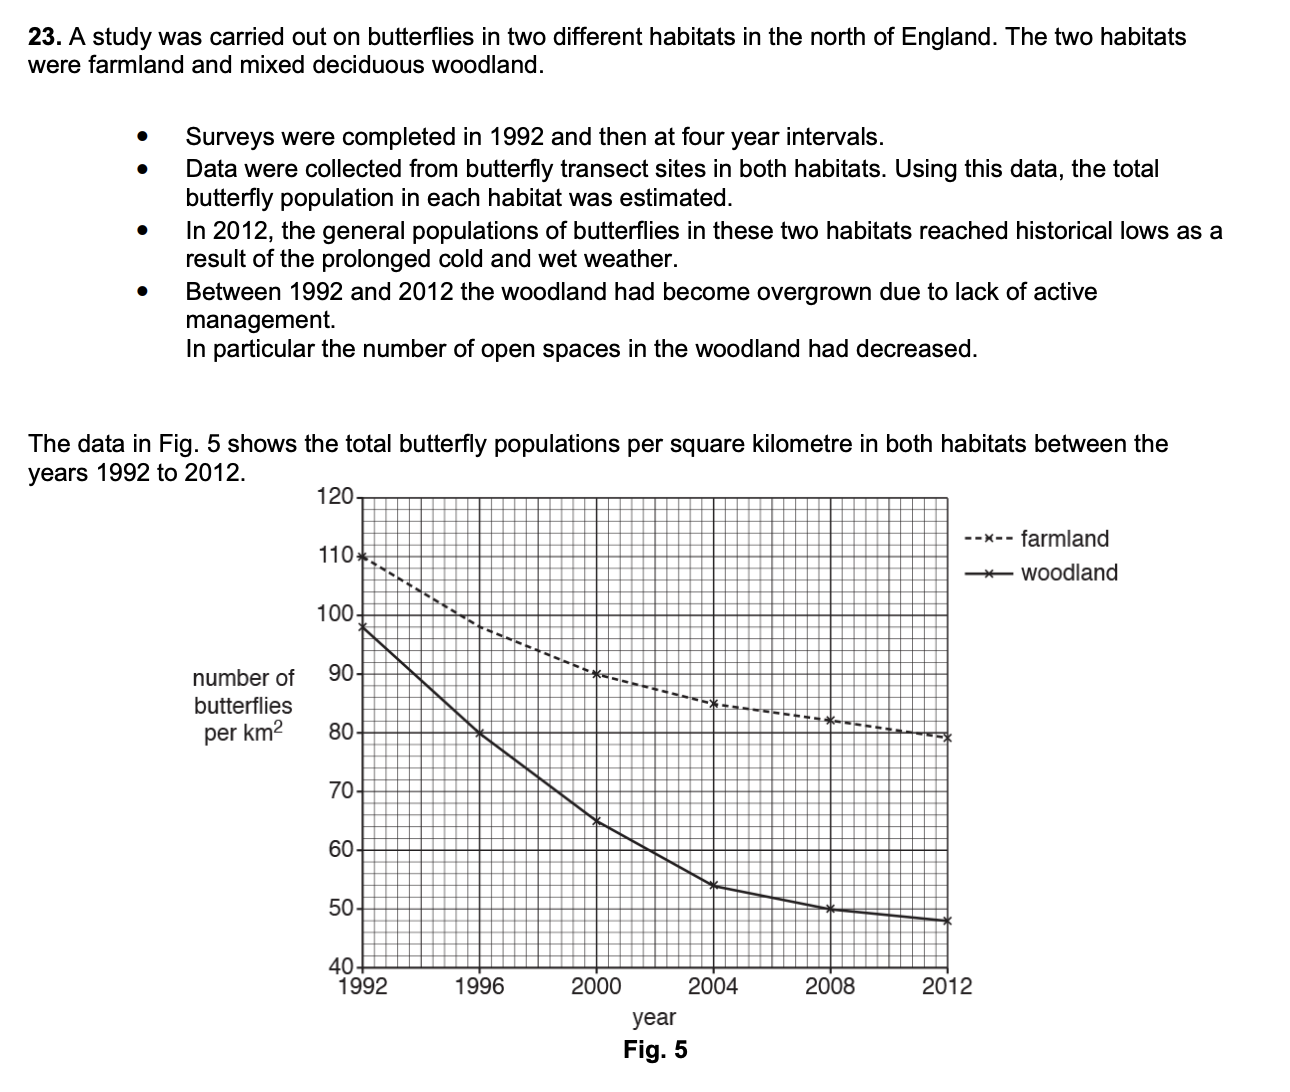
Both habitats experienced the same weather conditions. Suggest a reason for the difference in the rates of decline in butterfly numbers in woodland and farmland. (1 mark)
woodland population dropped more because…
of new / more, predator(s) / parasite(s) / disease(s) (of butterflies)
or more interspecific competition / new species competing for food or (lack of management / woodland became over grown / reduction in open spaces, leading to) loss of, habitat / food supply / breeding sites ✓ farmland decreased less because leave, wildlife refuges / area to grow wild or conserve hedgerows or fewer, predators / parasite(s) / disease(s) (of butterflies) or (more open spaces) for breeding sites ✓
Explain how a pitfall trap can be set up and used to sample invertebrate biodiversity. (3 marks)
dig hole and place container in soil ✓
make top of container level with soil level ✓
cover to protect from, rain / scavengers ✓
leave overnight ✓
identify / count, (named) invertebrates ✓
sample both areas, randomly / at 5(+) sites ✓

suggest 2 improvements you could make to these instructions (2 marks)
1 use a tape measure to mark the line ✓
2 at, fixed / 1m, intervals (along the tape) ✓
3 use quadrat to measure percentage cover ✓
4 identify with, key / field guide / app ✓
5 repeat / use group data (not just your own results) ✓
Scientists planned to sample the biodiversity in another peat bog ecosystem. They identified three
different areas within the ecosystem:
• an area of conifer trees (800 m2)
• a marshy area with a high water table (2400 m2)
• a heavily grazed area (3200 m2)
Suggest the sampling strategy that the scientists should use and comment on the number of
samples they should collect. (3 marks)
stratified AND random (within each area) (1)
idea that the number of samples within each area should be proportional to their size (1)
correct suggestion for the number of samples taken within each area (1)
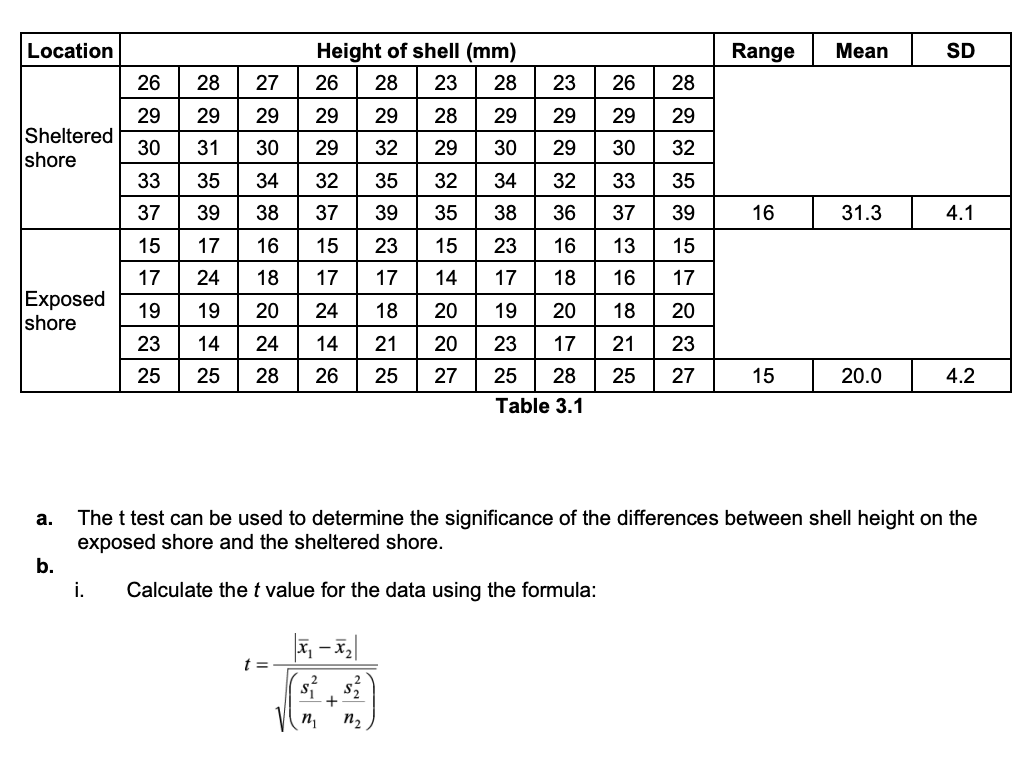
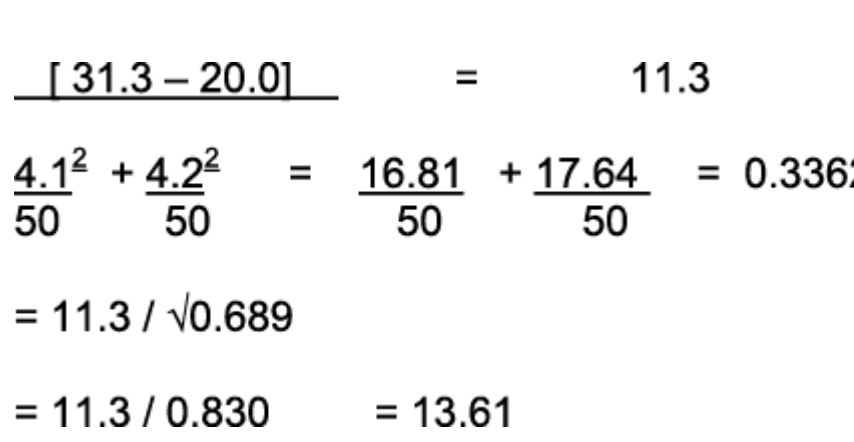
the strangler fig is the common name for plants in the Ficus genus. They are found in some forest communities in tropical America and bear fruit several times a year, often when other plants do not. explain the role that the strangler fig plays within the ecosystem in which it is found (3 marks)
the strangler fig is…
a keystone species
keystone species have a large impact on the ecosystem
the strangler fig is a key food source for animals
Strangler figs begin life as a sticky seed on a tree branch and often smother and outcompete their hosts, however, there is some evidence that trees encased in strangler figs are more likely to survive storms. Explain why this is an example of a mutualistic relationship. (2 marks)
in a mutualistic relationship, both organisms benefit
the strangler fig uses the host tree to grow upon
the host tree is protected from storms by the strangler fig

Calculate the percentage increase in silvery gibbons in the Dieng Mountains between 2010 and 2021. (2 marks)
percentage increase: (1092-881)/881 × 100 = 24.0%
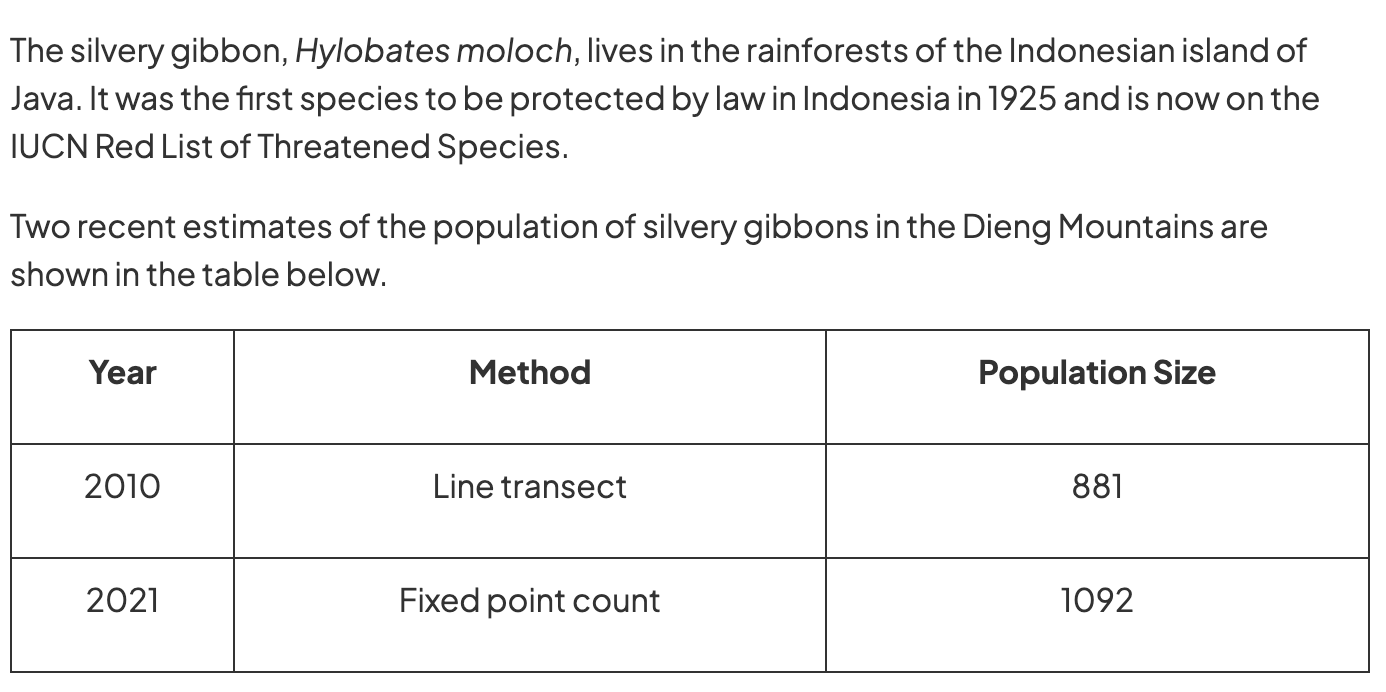
The fixed point count in 2021 was completed by setting up listening posts at each sampling site to identify the calls of the gibbons. Suggest another explanation for the apparent increase in population size. (2 marks)
a different survey technique
line transects should be used for slow-moving or immobile species
gibbons move quickly so may have been missed in 2010

Beet armyworm larvae eat a variety of plants, including tomato plants. Scientists wanted to investigate how effective a chemical called methyl jasmonate was in stopping beet armyworm larvae from eating plants. They sprayed tomato plants with different concentrations of methyl jasmonate and recorded the final biomass of the plants.
The scientists wrote the following hypothesis: Plants use methyl jasmonate as a defence against herbivory
What additional information do the scientists need to confirm their hypothesis? (2 marks)
whether methyl jasmonate increases growth rate/ cell division (rather than reducing herbivory)
whether other plants respond in the same way as tomatoes
the effect on the armyworm population
if other insects respond in the same way
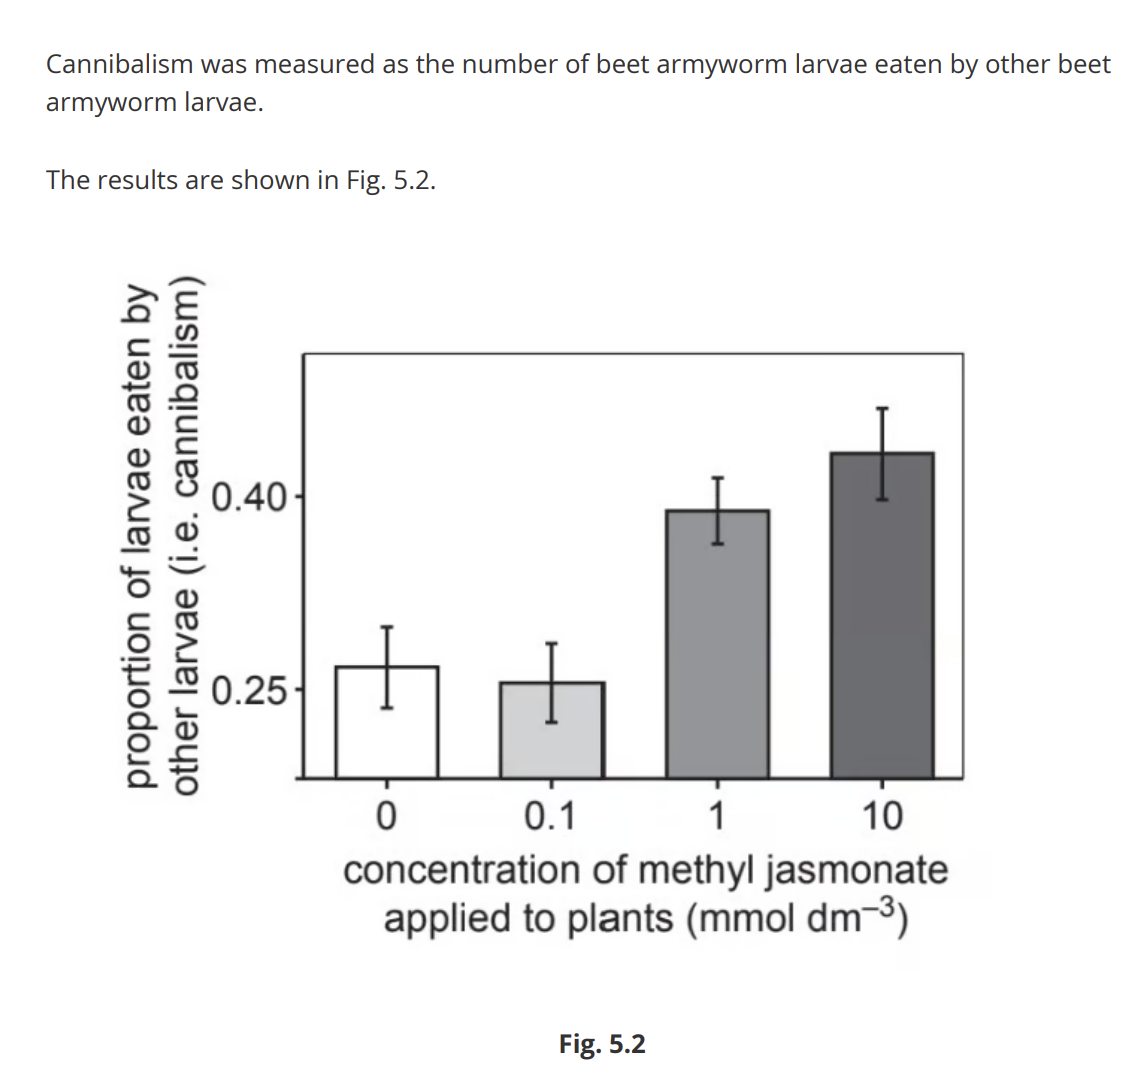
Suggest one valid conclusion it is possible for the scientists to draw from their results shown in Fig. 5.2. (1 mark)
methyl jasmonate causes increased cannibalism among larvae above 0.1 mmol dm-3 OR methyl jasmonate does not increase cannibalism below 0.1 mmol dm-3

(3 marks)
using stratified sampling
detail given of stratified sampling (e.g. number of samples in each sector is proportional to the area)
proportions of locations should be proportional numbers e.g. 8 (farmland): 4 (grassland): 8 (peat bog) but calculations for these numbers are required
The peat bog habitat had been damaged by peat extraction and by management of the neighbouring farmland. Ecologists decided to treat the peat bog in the following way: A buffer region was created between the peat bog and the neighbouring farmland. No visitors were allowed on the land. Ditches were blocked to raise water levels. Peat extraction, tree planting and the use of fertilisers were banned. A student suggested that this was an example of preservation.
Evaluate the student’s conclusion (2 marks)
in support
no visitors allowed
human interference is restricted (do not allow ‘NO human interference)
against
the habitat is being managed (e.g. water levels raised/ ditches blocked)
the habitat had already been changed/ wasn’t original habitat
describe how agriculture can reduce biodiversity (3 marks)
farmers may grow monocultures
deforestation may be carried out to clear space for crops/ livestock
hedgerows may be cleared to increase field size
chemical pesticides/ herbicides kill pests/ weeds
chemical fertilisers may run off into bodies of water causing eutrophication
removal of habitats/ food sources
question is DESCRIBE → no need to explain how each factor reduces biodiversity
Agriculture is not the only human activity that affects biodiversity around the world, and many now agree that the conservation of biodiversity is essential. Name two reasons for conserving biodiversity, and give an example for each. (4 marks)
aesthetic reasons (1) → provision of natural space to enjoy/ inspire art/ improve mental health (1)
economic reasons (1) → maintaining genetic diversity of crops species reduces the chance that a change in the environment will wipe out all crops/ biodiversity can increase tourism/ species may be discovered to have economic importance, such as a use in medicine or food production (1)
ethical/ moral reasons (1) → morally right/ humans have responsibility to protect other species
social reasons (1) → the enjoyment gained from spending time/ carrying out activities
ecological reasons (1) → removing decomposers from an ecosystem will reduce nutrient availability for other species/ removing pollinators will prevent plants from carrying out sexual reproduction or cross-pollination/ removal of a keystone species can have a large impact on the structure of an ecosystem (1)
Discuss the role of ex-situ conservation in maintaining biodiversity. (6 marks)
Indicative content relating to zoos
Zoos can provide a safe environment, e.g. food / shelter / healthcare / safety from predators
Building stable populations of at-risk species
Individuals bred in zoos can be reintroduced to the wild to build up wild populations
Captive breeding programmes can be carried out
Careful records are kept to reduce the risk of inbreeding within captive populations
Captive breeding can make use of artificial insemination / embryo transfer / embryo storage to overcome difficulties with mating
Research into behaviour / needs of at-risk species
Raising funds for conservation
Education of the public
Captive breeding in some species has proved challenging (e.g. the panda)
It can be difficult to maintain genetic diversity in small captive populations
Reintroductions into the wild may not be possible due to, e.g. disease in captive populations / a lack of important learned behaviours for survival / a lack of suitable habitat / a lack of ability to breed with wild populations after so long without gene flow


Describe a sampling method that the ecologists could have used to collect their data for the study described in part (a). (2 marks)
pitfall traps
containers are placed/ a hole is dug into the ground for beetles to fall into
→ Sweep nets are for sampling invertebrates living in long grass, which is unlikely to occur in grazed fields. Pooters will be too time consuming for sampling large areas. Tullgren funnels are for sampling leaf litter or soil invertebrates.

A student reading the results of the ecology study shown in part (a) concluded that cow grazing was the best way to manage land for beetle diversity, and that sheep grazing was the worst for beetle diversity. Evaluate the student's conclusion (3 marks)
support
species richness is significantly higher for cow-grazed fields than for other types of grazing
sheep-grazed fields have the lowest species richness
against
data doesn’t show species evenness
Fig. 2 shows no significant difference in overall beetle numbers between the types of grazing
The study only includes three types of animal grazing OR there may be another species that is better for beetle diversity than cows / worse for beetle diversity than sheep
Data is needed from more studies / more repeats are needed before being sure of this conclusion

Suggest the cause of the difference in beetle diversity between the different fields in the investigation. (2 marks)
some animals may eat more/ less plant species (so leaving different numbers of plants for bettles to live in/eat)
some animals may produce dung that is more/less suitable for beetles to eat/lay eggs in
The Madidi National Park, in the South American rainforest, is home to a wide variety of species. The largest predator in the area is the jaguar. These large cats are well camouflaged and hunt mostly at night. A single individual can cover a very large area. In 2007 the Wildlife Conservation Society (WCS) attempted to estimate the population of jaguars in the Madidi National Park.
• Digital camera traps were placed in areas that jaguars were likely to visit.
• If an infrared beam was broken by an animal, the camera was activated.
• The camera then took a photograph of the animal.
Suggest why it was not appropriate to estimate the number of jaguars using the capturerecapture technique. (2 marks)
estimate will be inaccurate (because of low numbers) (technique only works well with large populations)
dangerous for collector or jaguar
Most studies estimate the population density of jaguars in the South American rainforest to be 5 individuals per 100 km2. In the 2007 study:
100 camera traps were set up covering an area of 271 km2.
28 images of 9 different jaguars were recorded.
How well do these results support a population estimate of 5 individuals per 100 km2? (4 marks)
appropriate calculation of expected population density (e.g. 9/2.7= 3.33 jaguars per 100 km2)
lower than estimate
so doesn’t support
unknown/ low repeatability/ reproducibility of results
some support because 3 is close enough to 5
some individuals not photographed
idea that if many individuals are trapped
Other evidence used to estimate the jaguar population includes footprints and reports of sightings by local humans. Suggest one disadvantage of each of these methods for estimating the size of the jaguar population. (2 marks)
footprints
misidentification
might disappear
multiple prints in same sport makes counting difficult
same print might be counted on different occasions
human sightings
misidentification
poor recollection
jaguars likely to be in places/ times humans are not
Step 1: Find the original concentration
1.0×10⁶ cells÷20 cm3=5.0×10⁴ cells/cm3
Before you can track what happens through the dilutions, you need to know how concentrated the starting culture is — cells per unit volume, not just total cells. This lets you work out how many cells end up in any sample you take later.
Step 2: The 5% transfer, made up to 10 cm³
The 5% sample volume: 5% of 20 cm³ = 1 cm³
Cells in that sample: since concentration is uniform throughout the culture, this 1 cm³ still has a concentration of 5.0 × 10⁴ cells/cm³ (same as the whole culture — see previous explanation)
Now that 1 cm³ is diluted up to 10 cm³ — a 10-fold increase in volume, so a 10-fold drop in concentration:
5.0×10⁴÷10=5.0×10³ cells/cm3
The "5%" tells you what you removed; the "made up to 10 cm³" is a separate dilution step, so the two aren't combined into one multiplication.
Step 3: The additional ten-fold dilution
The question states this step is a ten-fold dilution, so you divide the concentration by 10 again:
5.0×10³÷10=5.0×10² cells/cm3 (=500 cells/cm3)
This models taking some of the 10 cm³ solution and diluting it further by a factor of 10 to get a new 10 cm³ solution — same logic as Step 2, just using the ten-fold factor given directly in the question instead of a percentage.
Step 4: Plating 0.1 cm³ and counting colonies
Only a small volume (0.1 cm³) of the final solution is actually spread on the agar plate, so you need the number of cells in that specific volume, not the whole 10 cm³:
500 cells/cm3×0.1 cm3=50 cells
Since each colony is assumed to grow from a single bacterial cell, the number of cells plated equals the number of colonies expected:
Number of colonies = 50
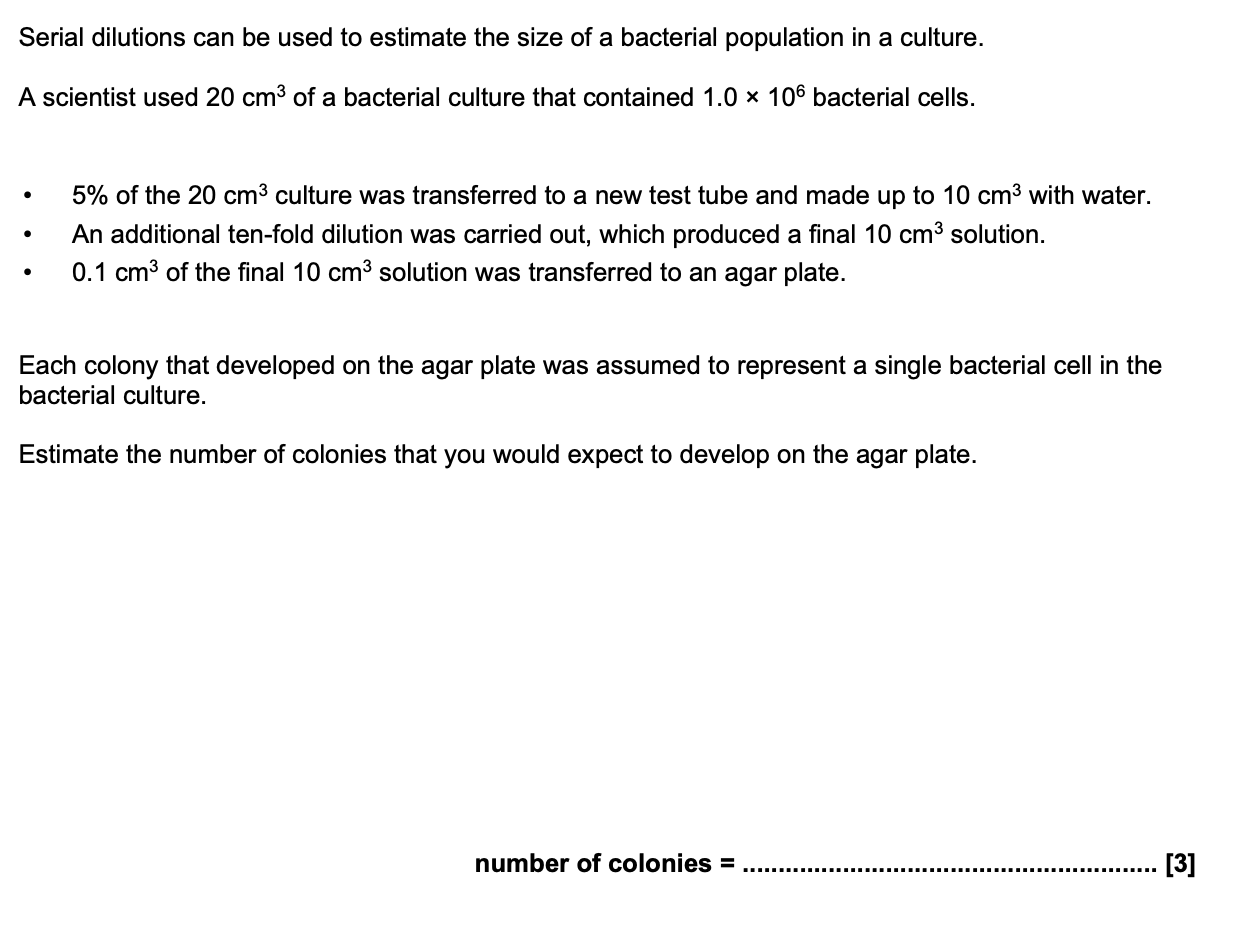
Serial dilutions can be used to estimate the size of a bacterial population in a culture. A scientist used 20 cm3 of a bacterial culture that contained 1.0 × 10⁶ bacterial cells.
• 5% of the 20 cm3 culture was transferred to a new test tube and made up to 10 cm3 with water.
• An additional ten-fold dilution was carried out, which produced a final 10 cm3 solution.
• 0.1 cm3 of the final 10 cm3 solution was transferred to an agar plate. Each colony that developed on the agar plate was assumed to represent a single bacterial cell in the bacterial culture.
A student carried out a different serial dilution to estimate the size of another bacterial population. The serial dilution resulted in four colonies developing on an agar plate. Explain why the student’s estimation of this bacterial population is likely to be inaccurate. (1 mark)
idea of with low colony numbers, small random differences in plating produce large errors when estimating/ scaling
On a biology field trip, some students carried out a survey of butterfly species in two areas of heathland. One part of the heathland was used regularly by walkers, while the other had been deliberately fenced off by the National Park Authority in an attempt to promote biodiversity.
Area 1 was the area accessible to walkers. Area 2 was the fenced off area.
On two different mornings in June the students walked along a transect in each area 4 times, at 30 minute intervals, and recorded every butterfly sighting. The aim of the survey was to compare the biodiversity of butterfly species in the two areas.
Suggest how the procedure could be improved so that a valid comparison could be made. (3 marks)
idea of more transects in different parts of area 1 and 2
collect at different times of day/ year/ weather conditions
method of ensuring that individuals are'n’t counted again
use a method to correctly identify species (e.g. a photograph or use of a key)
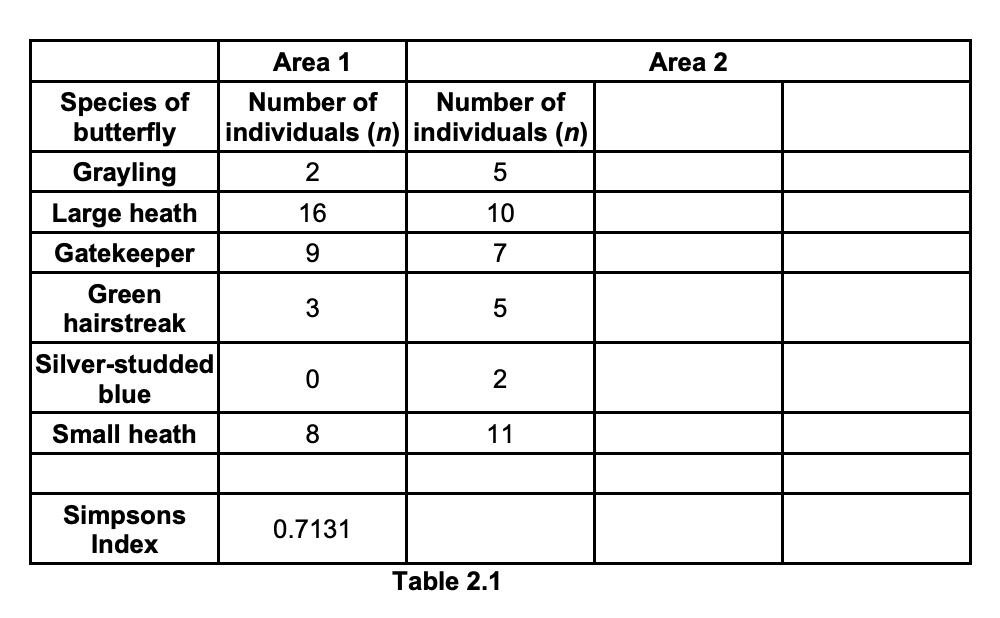
a) Identify the area with the higher species richness and justify your answer. (1 mark)
b) Identify the area with the higher species evenness and justify your answer. (1 mark)
a) Area 2 because it has more/ 6 species
b) Area 2 because the range of n is smaller
A group of students found 50 animals in a soil sample collected from Upper End Meadow and identified them as follows:
• 2 click beetles • 24 leatherjackets • 23 meadow ants • 1 wireworm
What can you conclude about the species evenness shown in the soil sample? Justify your answer. (1 mark)
low species evenness AND large number/ population of leather jackets/ meadow ants but small population of click beetles/ wireworms

The students calculated the Simpson’s Index of Diversity (D) for the mature area to be 0.489. Use the example of the students’ fieldwork to explain how biodiversity can be considered at different levels. (3 marks)
species biodiversity/evenness → shown by calculated Simpson’s Index OR species biodiversity/richness → shown by 5 plant species
variety/ diversity of habitats → shown by coppiced and mature woodland/ habitats
idea that genetic diversity not measured by or evident from student’s fieldwork
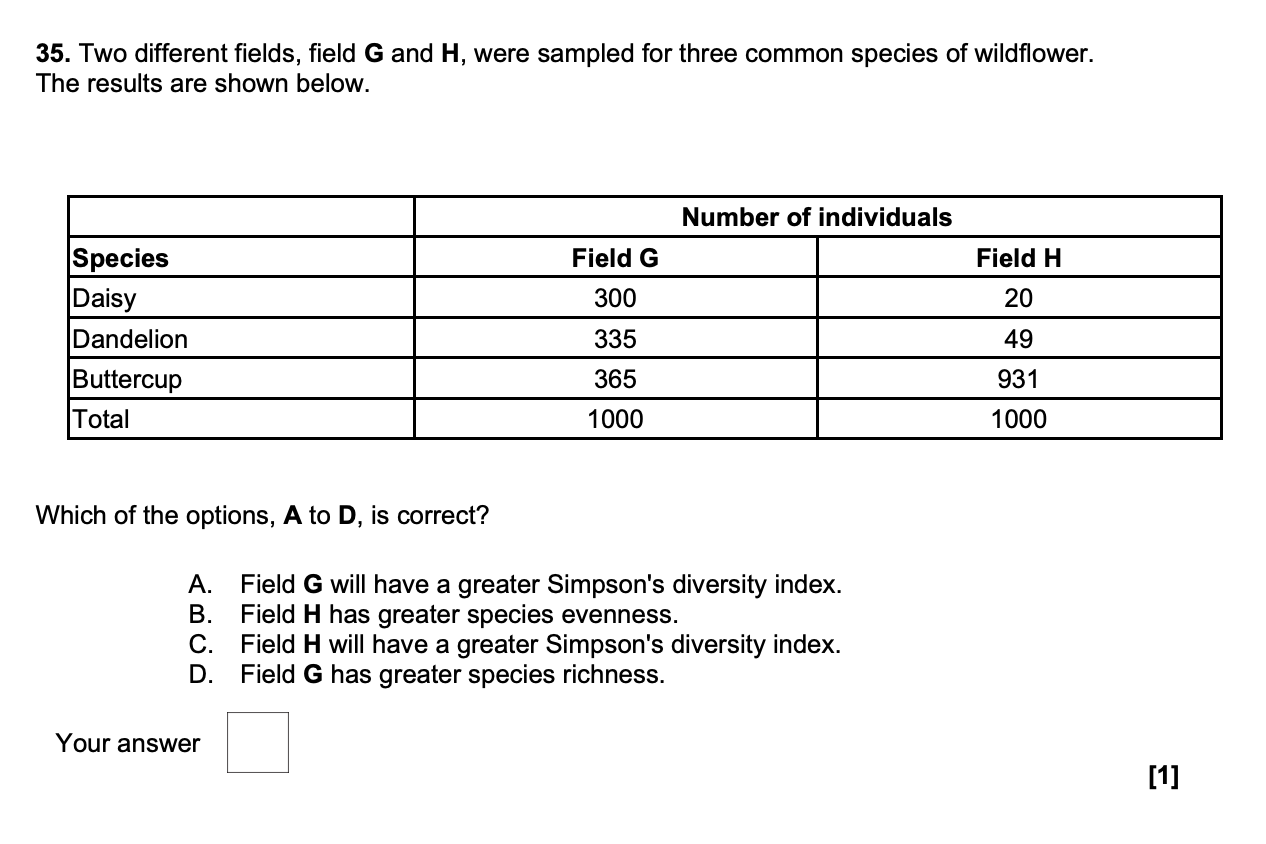
A
The Sumatran rhinoceros, Dicerorhinus sumatrensis, is a rare member of the family Rhinocerotidae. These rhinoceros are now critically endangered, with only six substantial populations in the wild: four in Sumatra, one in Borneo, and one in the Malay Peninsula. D. sumatrensis lives in rainforests. Their numbers are difficult to determine but they are estimated to number fewer than 100.
Suggest two reasons why this species is critically endangered in the wild. (2 marks)
loss of habitat/food source OR deforestation
hunting/poaching (for horn)
climate change
The Sumatran rhinoceros, Dicerorhinus sumatrensis, is a rare member of the family Rhinocerotidae. These rhinoceros are now critically endangered, with only six substantial populations in the wild: four in Sumatra, one in Borneo, and one in the Malay Peninsula. D. sumatrensis lives in rainforests. Their numbers are difficult to determine but they are estimated to number fewer than 100.
The remaining populations of D. sumatrensis are all small and are scattered in isolated areas. These are factors that might speed up the extinction of the species. Suggest why (2 marks)
hard to find a mate
low genetic diversity/ small gene pool
less likely to cope with/ adapt to environmental change
all wiped out by the same disease
more vulnerable to predators/ poachers
natural disaster could wipe out one/ small of the small populations
The Sumatran rhinoceros, Dicerorhinus sumatrensis, is a rare member of the family Rhinocerotidae. These rhinoceros are now critically endangered, with only six substantial populations in the wild: four in Sumatra, one in Borneo, and one in the Malay Peninsula. D. sumatrensis lives in rainforests. Their numbers are difficult to determine but they are estimated to number fewer than 100.
Captive breeding programmes with D. sumatrensis have been unsuccessful. Suggest one other way in which zoos can contribute to the conservation of the Sumatran rhinoceros. (1 mark)
education/awareness
support for/promote conservation projects/research
Individuals within populations vary. Much of this variation is under genetic control. Two groups of scientists were studying genetic polymorphism in fruit flies. They extracted DNA from two different species of fruit fly, A and B. The first group of scientists studied 26 gene loci from species A. They calculated the genetic polymorphism of species A to be 0.35. The second group of scientists studied 32 gene loci from species B. They found that 13 of the gene loci were polymorphic.
Evaluate the conclusion that species B shows greater genetic polymorphism than species A. (3 marks)
support
species B has greater calculated genetic polymorphism than species A
might not support
numbers are similar
no statistical test performed
might not have sampled same loci
no indication of fruit flies sample size

The genetic diversity of the moss Polytrichum commune was analysed in two peat bog ecosystems. Scientists measured genetic diversity by studying three gene loci. For each gene locus, they calculated the proportion of heterozygotes in each population. These values were used as a measure of genetic diversity. The scientists sampled 72 individuals from Population A and 48 individuals from Population B.
Using the data in Table 4.2, suggest which of the two populations of P. commune has the greater genetic diversity. Explain your conclusion and show your working. (2 marks)
A because mean proportion of heterozygotes is higher
A= 0.898 AND B= 0.854

Global biodiversity is in decline. Human population growth, agriculture and climate change each have an effect upon biodiversity. Explain how each of these factors contributes to the decline in biodiversity. (6 marks)
human population growth
need for more agricultural land/ housing
destroys habitats
more waste/pollution produced
damaging ecosystems
agriculture
monoculture/ lower biodiversity
loss of older/ wild type strains
reduced genetic diversity
subject to disease
inability to adapt to changing conditions
pesticide use
use of fertiliser
nitrate polluion
eutrophication
climate change
warmer/ drier climate
modern species not adapted
migration may not be possible
rise in sea level reduces land area
more frequent flooding affects terrestrial ecosystems
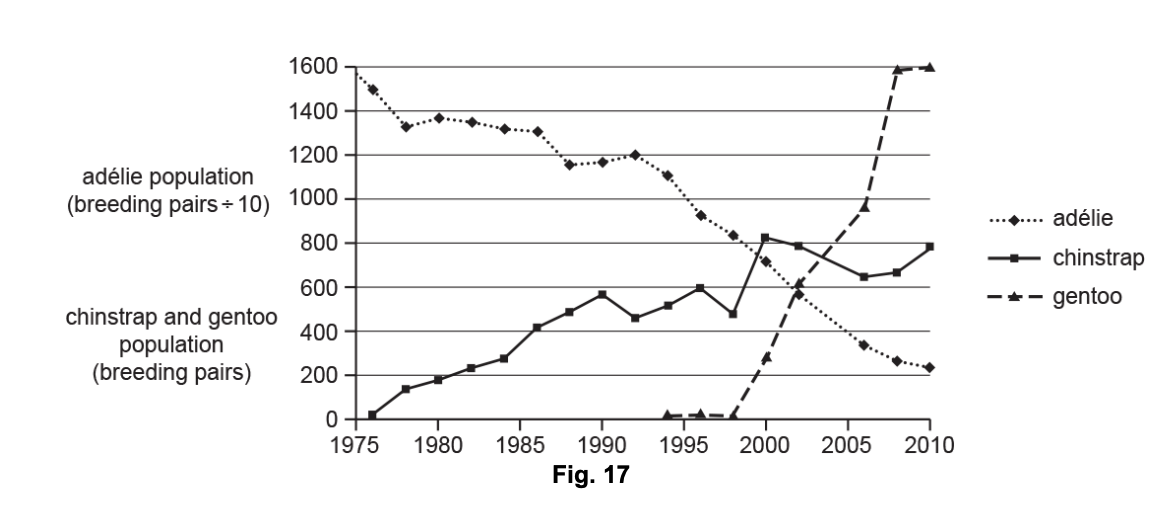
Penguins are flightless birds that eat fish. Most species of penguin live near the coast of Antarctica or on the many islands that surround Antarctica.
Adélie penguins need a habitat that contains sea-ice. Gentoo and chinstrap penguins can survive without access to sea ice. Scientists have claimed that the population changes in the three penguin species on the island suggests that the Antarctic temperature is increasing.
Discuss whether the information in Fig. 17 supports the scientists’ claim. You should refer to the data in Fig. 17 in your answer. (3 marks)
support
adelie penguin population decreased OR gentoo/chinstrap penguin population increased
doesn’t support
changes could be explained by (chance) arrival of gentoo/chinstrap and subsequent competition
change in another described factor could explain changes
correlation doesn’t mean causation

Penguins are flightless birds that eat fish. Most species of penguin live near the coast of Antarctica or on the many islands that surround Antarctica.
Adélie penguins need a habitat that contains sea-ice. Gentoo and chinstrap penguins can survive without access to sea ice. Scientists have claimed that the population changes in the three penguin species on the island suggests that the Antarctic temperature is increasing.
Scientists working in the local area monitored water temperatures and populations of other water animals around the island between 1976 and 2010. Suggest two further pieces of evidence that the scientists might have found to support their claim. (2 marks)


Current estimates of the Scottish wildcat population vary. Recent reports by the Scottish Wildcat Association indicate that fewer than 100 individuals, possibly as few as 35, remain in the wild. These individuals occur only in the most remote, uninhabited areas of the Scottish Highlands. Biodiversity can be considered at several levels. A scientist concluded that the biodiversity of the Scottish Highlands would continue to reduce because of the small population of Scottish wildcats. Evaluate the scientist’s conclusion with reference to genetic biodiversity and species biodiversity (6 marks)
genetic biodiversity
• genetic, diversity / variation, low / will decrease
• small gene pool / few alleles (at each locus)
• proportion of polymorphic loci is small
• homozygosity increases / heterozygosity decreases
• inbreeding (depression will occur) • (as closely-) related cats, mate / breed
• loss of alleles / genetic erosion
• by chance / genetic drift • correct ref. to disease susceptibility
• low potential for adaptation (to future change)
• new alleles may arise (slowly)
• by mutation • (slow as) one / few, generation(s) per year
species biodiversity
• wildcats may go extinct (in Scotland)
• one less species
• correct ref. to species richness
• correct ref. to species evenness
• former prey species may, return / increase / extend range (increasing biodiversity)
• affect food chain / example of food chain effect
• conservation, efforts / effects
• only one cat species (in Scotland)

Explain one way in which tourists can lead to an increase in the biodiversity of an area. (2 marks)
ecotourism
idea that money from tourists is used to support conservation
example of conservation project (e.g. planting trees, maintain footpath, rewilding, creating nature reserves, reintroduction programmes)
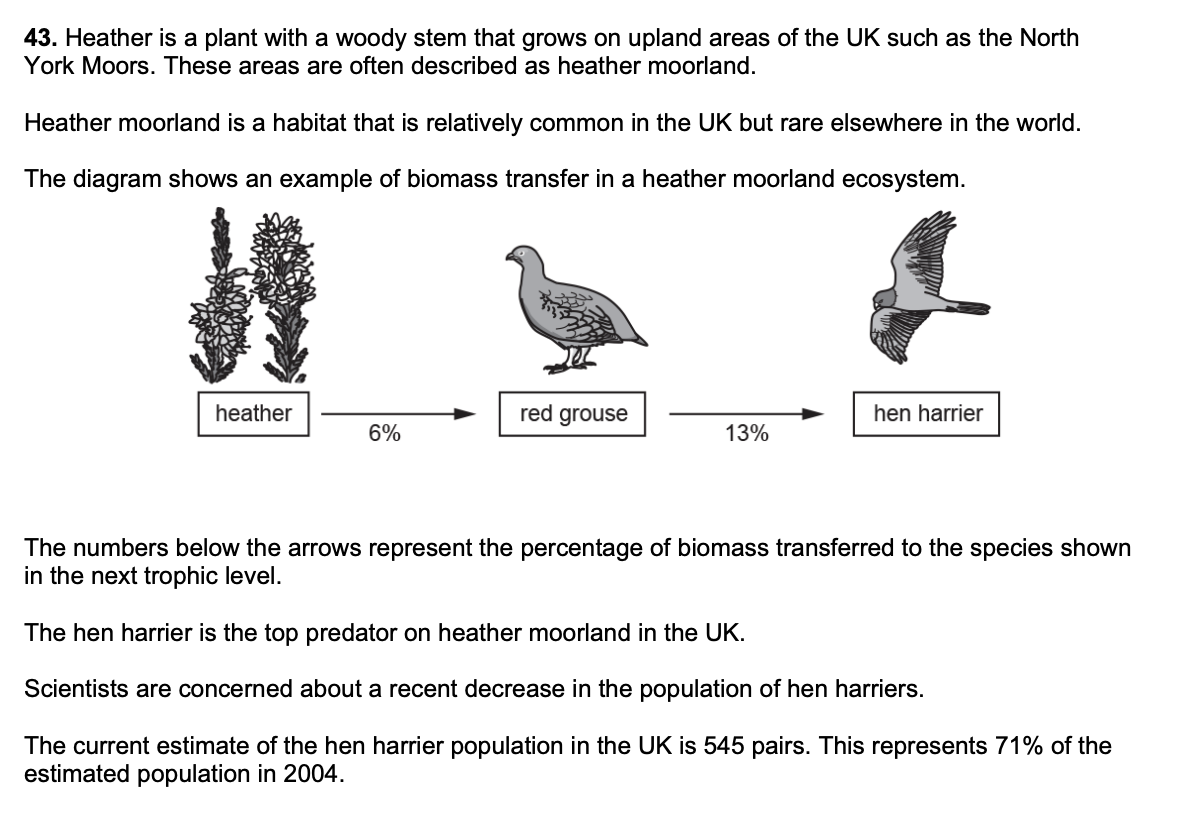
Since 2004, the population of red grouse in the UK has been relatively stable and it is not thought that the population has been affected by changes in climate. Suggest an explanation for the decrease in hen harrier numbers since 2004 (1 mark)
pollution
pesticides
disease
loss of another food source
competition from new predator
The cassowary is a large, flightless bird found in the rainforest in parts of Australia. It feeds mainly on fruit. The seeds of the fruit are deposited on the rainforest floor.
The cassowary is known as a keystone species. This means it is important for the survival of other species. Suggest what role the cassowary plays in the survival of other species (1 mark)
seed dispersal
The cassowary needs to be conserved for ecological reasons. State two other reasons for maintaining biodiversity. (2 marks)
economic reasons
aesthetic reasons
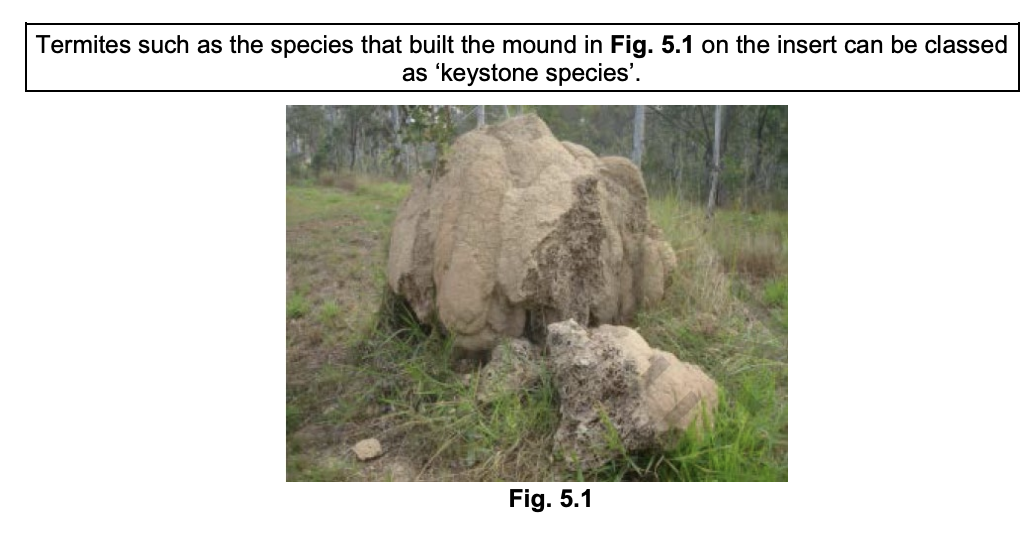
Use the information given to state one argument that supports this statement and one argument that does not. (2 marks)
support
important recyclers/ saprotrophs
doesn’t support
not a predator
large in abundance/ biomass (so effect on environment not disproportionate)
In 2019, scientists discovered a source of a new antibiotic in the roots of a wild bean plant, Phaseolus vulgaris, in Los Tuxtlas, Mexico. The antibiotic, phazolicin, was extracted from the roots of the wild bean plant.
Suggest one feature of a bacterium the phazolicin might attack (1 mark)
cell wall
metabolic reaction
reproduction of bacterium
In 2019, scientists discovered a source of a new antibiotic in the roots of a wild bean plant, Phaseolus vulgaris, in Los Tuxtlas, Mexico. The antibiotic, phazolicin, was extracted from the roots of the wild bean plant.
Explain the importance of maintaining biodiversity for the discovery of new antibiotics like phazolicin. (2 marks)
many drugs originated from plants/ microbes
so maintaining biodiversity increase the chance of finding/ developing new drugs
maintains a genetic resource for future

The biomass of large fish in the Southern Ocean is a food resource for humans. It is increasingly harvested by powerful, long-distance trawlers. If over-exploited, the Southern Ocean ecosystem may be permanently altered.
o Suggest two measures that an international treaty might impose, to prevent fishing from causing permanent damage to the Southern Ocean.
o Identify the practical difficulties that might prevent your two measures from being effective. (4 marks)
measures
fishing quotas
mesh size
species restriction
trawler size/ days at sea
penalties/ sanctions
publicity/ public education
difficulties
area too large
expense of monitoring
false reporting of catches/ trawler size/ mesh size

State why the management of heather moorland is known as in situ conservation. (1 mark)
species are conserved in their natural habitat

Apart from regular burning, suggest another procedure that could be carried out to conserve the heather moorland habitat. (1 mark)
controlled grazing
monitoring of populations
restricting human access
remove invasive species
The mountain gorilla is an endangered species with as few as 880 individuals surviving in the wild. Many of the animals have been ‘habituated’ to human contact. The health of these animals is monitored and medical assistance is given when necessary. Animals that are not habituated are rarely visited.
Suggest one advantage and one disadvantage of keeping some gorilla families that have not been habituated. (2 marks)
advantage
exhibit natural behaviour/ less likely to catch disease from humans
disadvantage
poaching more likely/ could be wiped out by disease/ more difficult to count
Give one aim of CITES. (1 mark)
to protect/conserve species endangered by trading activities OR to prevent/ restrict trade in endangered species
to regulate/ restrict international trade
Between 1913 and 2013 the approximate worldwide population of living elephants dropped from 10 000 000 to 500 000. Calculate how many orders of magnitude smaller the elephant population is likely to be in 2213 compared to 1913. Assume that the elephant population continues to decline at the same rate each 100 years. Show your working. (2 marks)
1. In 1913 there were 1 ' 107 elephants.
2. In 2013 there were 5 ' 105 elephants.
3. The percentage remaining after 100 years is calculated as the final number divided by the starting number multiplied by 100 (= 5%) OR The percentage decrease after 100 years is calculated as the difference divided by the starting number multiplied by 100 (= 95%).
4. Assuming the same rate of decline every 100 years, in 2113 there will be 5% left of 5 ' 105 so 5/100 ' 500 000 = 25 000 (2.5 ' 104)
5. Again assuming the same rate of decline, in 2213 there will be 5% left of 2.5 ' 104 so 5/100 ' 25 000 = 1250 (1.25 ' 103).
6. To find the difference in order of magnitude between the elephant population in 1913 and 2213, compare 1 ' 107 with 1.25 ' 103. The difference in the exponential is 7 − 3 = 4 orders of magnitude.

Consider the statement: ‘Genetically modified plants and animals should be classed as new species’. Outline one experiment or investigation that would provide evidence to support or contradict the statement. (3 marks)
breed GM stock with non-modified stock
see if offspring fertile
if so they should be classed as the same species

Describe two differences between the two images that could have been used to classify humans and chimpanzees in separate families. (2 marks)
chimpanzees have relatively…
smaller/ shorter/ thinner thumb
longer/ narrower palm
thicker fingers
wider wrists
→ no scale was given so references to size are ignored
The Scottish wildcat and European wildcat are both classified in the same species, Felis silvestris.
Researchers have suggested that both wildcats originated from the same population.
Name the genus of the Scottish wildcat (1 mark)
Felis
The Scottish wildcat and European wildcat are both classified in the same species, Felis silvestris.
Researchers have suggested that both wildcats originated from the same population.
What is the term used to describe the differences between the two populations of wildcat? (1 mark)
intraspecific ✓
variation ✓
The Scottish wildcat and European wildcat are both classified in the same species, Felis silvestris.
Researchers have suggested that both wildcats originated from the same population.
After the Ice Age, sea levels rose and the British Isles became isolated from the rest of Europe.
The isolated population of wildcats in the British Isles developed slightly different characteristics from the mainland population in Europe.
Suggest why the Scottish wildcat and the European wildcat cannot yet be classified as different species (2 marks)
can produce fertile offspring
similar in appearance/ not enough phenotypic differences
have only been isolated for a short time
genetically similar
The creation of an organism with an artificial genome is known as ........................... biology. The bacterium created has been classified in the genus ........................... However, the classification of this organism is problematic because the basis of classification is ........................... . (3 marks)
synthetic
Escherichia
phylogeny/ phylogenetics
The Titicaca water frog, Telmatobius culeus, is an aquatic amphibian found in Lake Titicaca in sub-tropical South America. Name the genus of the Titicaca water frog (1 mark)
Telmatobius

The Sumatran rhinoceros, Dicerorhinus sumatrensis, is a rare member of the family Rhinocerotidae.
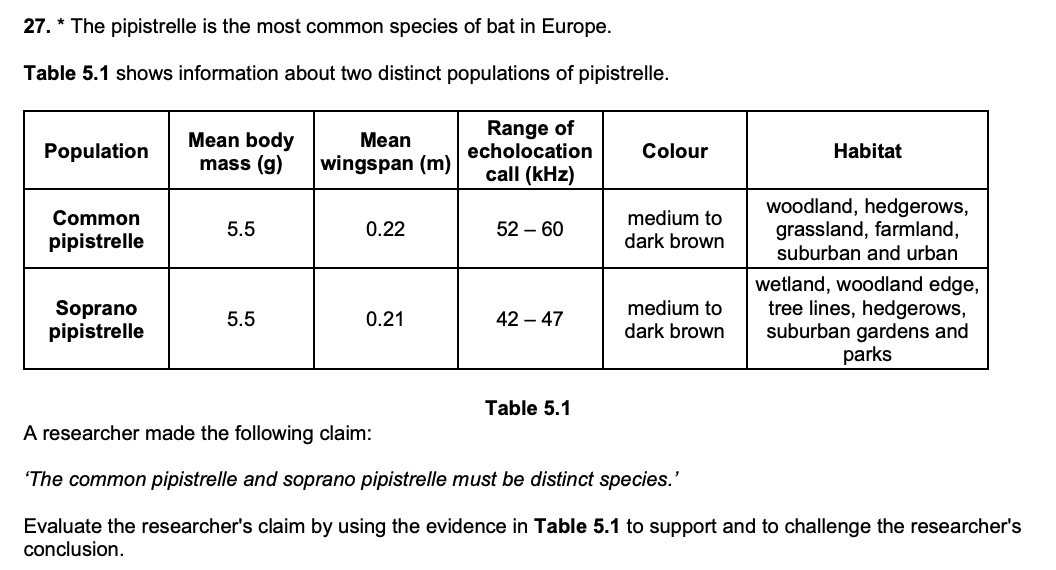
Complete the table below, showing the classification of the Sumatran rhinoceros (2 marks)
column 1
class
order
genus
column 2
animalia
sumatrensis
(6 marks)

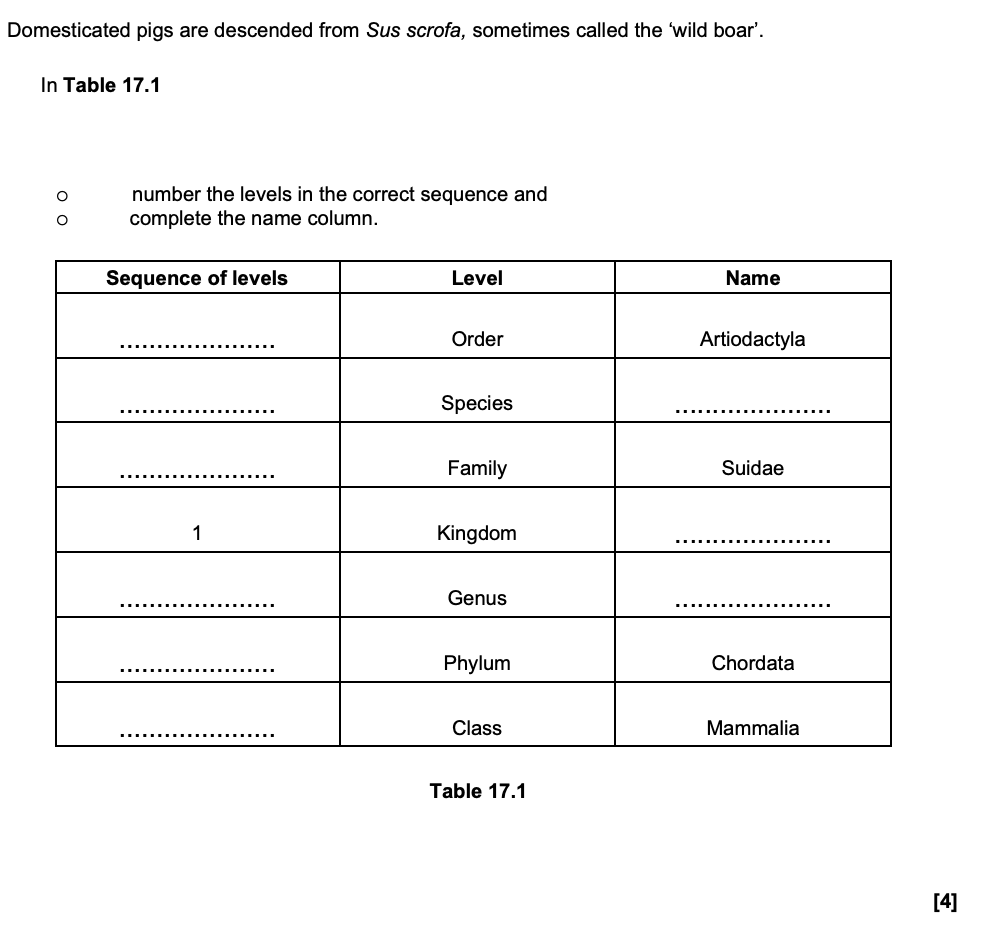
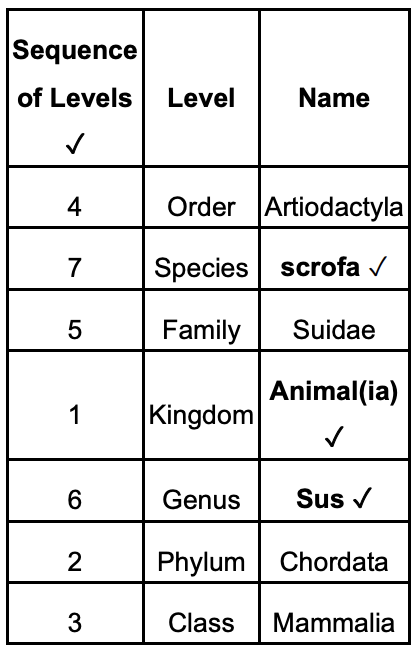
The name Dicerorhinus sumatrensis is part of the binomial naming system for classifying species.
State an advantage of using this system rather than using the common nameof the species, Sumatran rhinoceros. (1 mark)
universal/ recognised worldwide
knows which genus/ species it belongs to
idea of different common name for the same organism
State two features of organisms that belong to the Kingdom Protoctista. (2 marks)
eukayotic cells
detail of eukaryotic feature (e.g. membrane bounded organelles, 80S ribosomes, linear DNA, DNA with histones)
aquatic
most are unicellular/ few multicellular
autotrophic or heterotrophic
describe how genetic material is arranged in prokayota organisms (1 mark)
ref to nucleoid OR loop/ circular OR free in the cytoplasm
not associated with histones/ proteins
only one chromosome

At various times, algae have been classified in different kingdoms. Using the information given above, draw a conclusion about which kingdom is the most appropriate in which to classify algae. In your answer explain why other kingdoms are not appropriate choices. (4 marks)
protoctista
nucleus/ (named) membrane-bound organelles, so eukaryotic/ not prokaryotic
unicellular so not plant(ae)
cell wall/ chloroplast/ starch grains, so not animal(ia)
cellulose cell wall/ chloroplast, so not fungi
Name the cell component that appears in organisms of all three domains that Woese suggested (1 mark)
ribosomes
One of the domains Carl Woese suggested is called Eukarya. Name the other two domains (2 marks)
bacteria
archaea
State two defining features of all members of the domain Eukarya (2 marks)
nucleus
DNA with histones/ associated proteins
linear DNA
(named) membrane bound organelles
80S ribosomes
Woese carried out a detailed study of RNA molecules in order to draw his conclusions.
Suggest two ways in which the scientific community are likely to have validated Woese’s research. (2 marks)
scientific conferences/ meetings
peer review
replication of work by others to see if the same results are obtained
looking for more evidence (e.g. from other people’s work)

Explain how scientists are able to estimate the age of extinct organisms, such as species A and species B. (2 marks)
fossils
idea that fossils deeper in the ground are older than those near the surface
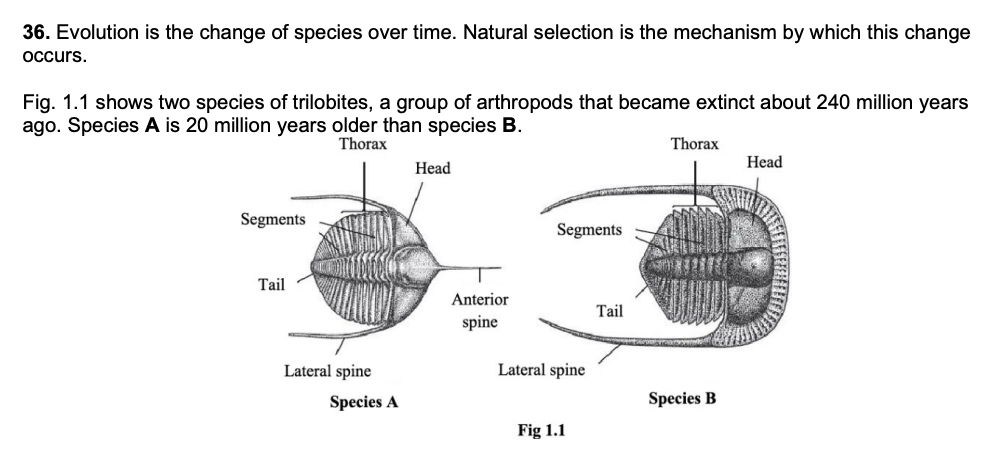
One such observation was “species B had longer lateral spines than species A”.
Explain why this is not a valid observation to make on the basis of Fig. 1.1. (2 marks)
no scale given on figure
idea that comparison in absolute length cannot be made
maturity/ age of specimen unknown
idea that only one individual of each species observed
Explain how a specific molecule is used to show that two different species have evolved from a recent common ancestor. (2 marks)
sequence of amino acids/ DNA bases
the smaller the differences, the more closely related they are
reference to named protein (e.g. cytochrome c)
How might scientists a century ago have known that termites evolved in the Jurassic geological period? (1 mark)
fossils
What new source of evidence might help today's scientists to find out how closely related termites are to cockroaches? (1 mark)
DNA/ cytochrome c
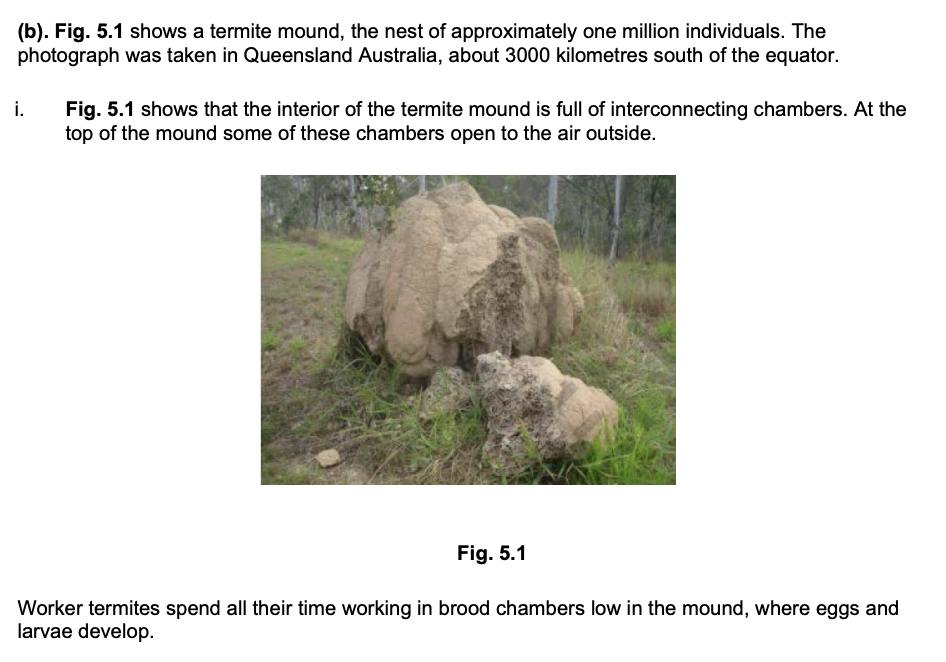
Explain how carbon dioxide produced in the respiring body cells of worker termites is removed to the air outside the termite mound. (4 marks)
carbon dioxide diffuses down concentration gradient out of the respiring cell
carried through body from cell (to tracheoles) by blood passing out via tracheoles/ trachea/ spiracles
hot gases expand and are less dense so rise up by convention through the mounds to vents at mound-top
State one way in which genetic diversity can be measured (1 mark)
genetic polymorphism/ proportion of heterozygotes/ proportion of gene variants
The cheetah, Acinonyx jubatus, is a member of the cat family, Felidae. Cheetahs display less intraspecific variation than other members of the family Felidae. The population of cheetahs has been declining for the past 100 years and is estimated to be between 6000 and 7000. Within the remaining cheetah population, intraspecific genetic diversity is very low. One isolated population of cheetahs in Iran has fewer than 100 individuals.
It is thought that the modern cheetah population has low genetic diversity because the population,relatively recently, experienced a genetic bottleneck.
Explain why a genetic bottleneck can lead to low genetic diversity (2 marks)
many alleles lost when population dropped
modern population descended from few survivors
The cheetah, Acinonyx jubatus, is a member of the cat family, Felidae. Cheetahs display less intraspecific variation than other members of the family Felidae. The population of cheetahs has been declining for the past 100 years and is estimated to be between 6000 and 7000. Within the remaining cheetah population, intraspecific genetic diversity is very low. One isolated population of cheetahs in Iran has fewer than 100 individuals.
Scientists are concerned about genetic drift in the remaining cheetah populations.
Explain why genetic drift is likely to be of particular concern in the population of 100 cheetahs in Iran. (2 marks)
idea that one individual or allele has proportionally higher effect on small population
more likely that alleles will be lost from population
population more vulnerable/ likely to become extinct due to environmental change
Name the type of speciation that occurs when two populations live in the same location. (1 mark)
sympatric
In disruptive selection, extreme phenotypes are selected for and average phenotypes selected against. The G. fortis all live in the same location. If disruptive selection is occurring in the G. fortis population, it is possible that speciation might occur.
Suggest how G. fortis with large beaks could become reproductively isolated from G. fortis with small beaks despite living in the same location. (1 mark)
idea that individuals choose to mate only with other individuals with similar sized beaks
Describe how DNA can be used to provide evidence to support the theory of evolution by natural selection (2 marks).
(DNA) found in all organisms ✓
some / AW , sequences highly conserved ✓
comparison (of DNA between species) ✓
similar (base) sequence indicates recent common ancestor ✓ ora
Alfred Russel Wallace is another important figure in the understanding of evolution.
Outline the way in which Wallace contributed to the acceptance of Darwin’s theory of natural selection by the wider scientific community. (2 marks)
similar ideas to Darwin ✓
arrived at independently ✓
presented / published (paper) , together ✓
idea of increased weight of evidence ✓
Explain how biological molecules can provide evidence that species have evolved.
You should refer to different types of molecule in your answer. (2 marks)
biological molecule
nucleic acid / (nuclear) DNA / mtDNA / RNA (1)
idea that in samples from two species sequence similarity in any of the above can imply an evolutionary relationship, difference / divergence in sequence implies evolutionary distance (1)
biological molecule
proteins / polypeptides / cytochrome C / haemoglobin (1)
idea that in the same protein from two species, amino acid / primary sequence similarity implies evolutionary relationship, difference / divergence in sequence implies evolutionary distance (1)
The students concluded that there is a positive correlation between distance of the tree from the river and mean leaf hair density.
Suggest reasons for this positive correlation (2 marks)
further away from the river less water (available) / ORA ✓
transpiration causes water loss ✓
hairs, trap water vapour / reduce transpiration / reduce loss of water (vapour)✓
reduced water (vapour) potential gradient from inside to outside leaf ✓
Another group of students repeated this investigation and calculated rs = 0.589. The critical value of rs at the 5% level for 9 degrees of freedom is 0.600.
They concluded that their results showed a weak positive correlation between leaf hair density and distance of the tree from the river.
Evaluate the conclusion of this group of students. (1 mark)
their conclusion is incorrect ✓
reject (the student’s), hypothesis / H1 ✓
there is no, relationship / correlation, (between leaf hair density and distance from river) / the pattern seen is due to chance ✓
state the two patterns of variation (1 marks)
continuous and discontinuous

using fig. 20.1 and that female cheetahs are 4.7% shorter than male cheetahs at ages 2.5 and 4 years old, what can be concluded about the significance of the difference between the length of male and female cheetahs aged between 2.5 and 4 years? Explain your answer (2 marks)
little / nothing (can be concluded) ✓
because no (named) statistical test done ✓

A student looked at Fig. 20.1 and wrote:
“The longest male cheetah that was measured was 1.52 m long”.
Explain whether the information in Fig. 20.1 supports the student’s answer. (1 mark)
No, because… idea that standard deviation is not the same as range ✓

State the likely causes of variation in body length in cheetahs (2 marks)
environment ✓
genes / genetic / alleles , and environment ✓
many genes / polygenic ✓
age ✓

state 2 factors that should be controlled as part of this investigation (2 marks)
number of seeds per pot ✓
size of pot ✓
type of soil / compost used ✓
mass of soil / compost used ✓
temperature ✓
light intensity ✓
oxygen / carbon dioxide concentration ✓
AVP ✓
State two responses that some plants use to defend themselves from herbivory. (2 marks)
chemicals
foldings
stings
Adaptations can be divided into three types. State the type of adaptation represented by the tiger’s stripes. (1 mark)
anatomical

Describe and explain how a tiger with striped fur may have evolved from a non-striped ancestor. In your answer you should discuss the different types of genes that might be involved in the creation of the striped pattern in the tiger’s fur. (6 marks)
natural selection
mutations
selection pressure of prey availability
the adaptation helped tigers hide from prey/ camouflage
striped tigers had greater survival probability and were more likely to reproduce
beneficial alleles were passed on to the next generation
the allele frequency for the relevant genes would have increased with each generation
after many generations, all tigers within a population were striped
roles of regulatory genes
regulatory genes control the pattern/ where pigments produced
genes switched on and off during development
correct roles for epistasis (e.g. recessive epistasis preventing expression of pigment gene)