SPSS

0.0(0)
studied byStudied by 0 people
full-widthCall with Kai
GameKnowt Play
learnLearn
examPractice Test
spaced repetitionSpaced Repetition
heart puzzleMatch
flashcardsFlashcards
Card Sorting

1/11

encourage image

There's no tags or description

Looks like no tags are added yet.

Study Analytics
Name
Mastery
Learn
Test
Matching
Spaced

No study sessions yet.

12 Terms

1
New cards

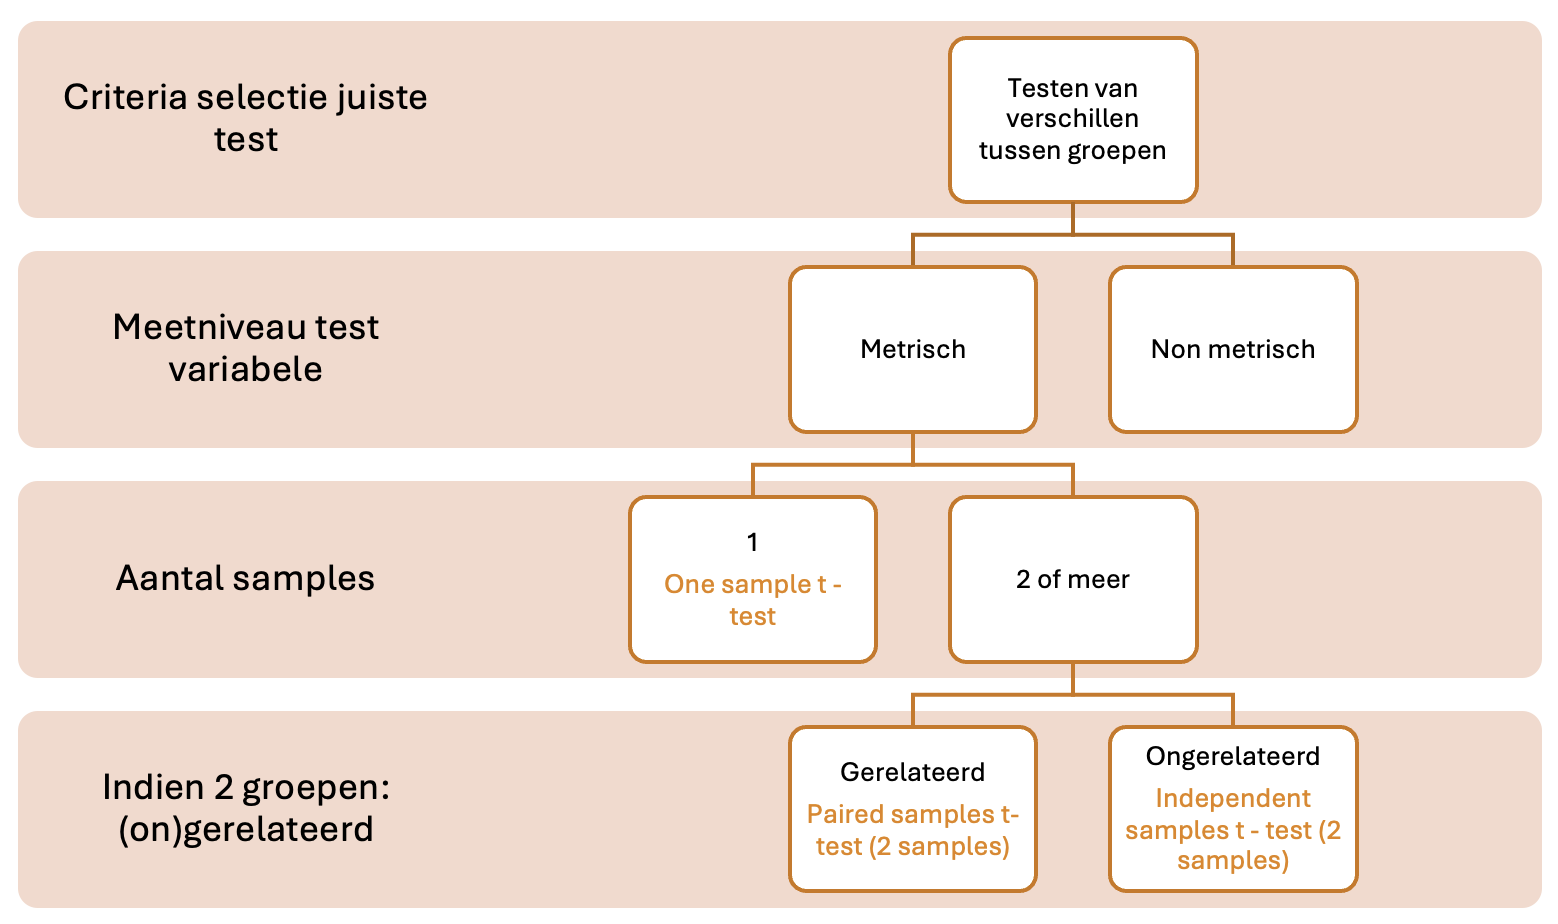
Soorten t - test

knowt flashcard image
2
New cards

Tukey’s methode

  • Waarde die lager zijn dan de lower fence of hoger dan de upper fence kun je beschouwen als mogelijke outlier

  • Lower fence: Q1 - 1,5 (Q3 - Q1)

  • Upper fence: Q3 + 1,5 (Q3 - Q1)

3
New cards

Trimmed mean

Onderste en bovenste 5% van de extreme waarden worden weggelaten

4
New cards

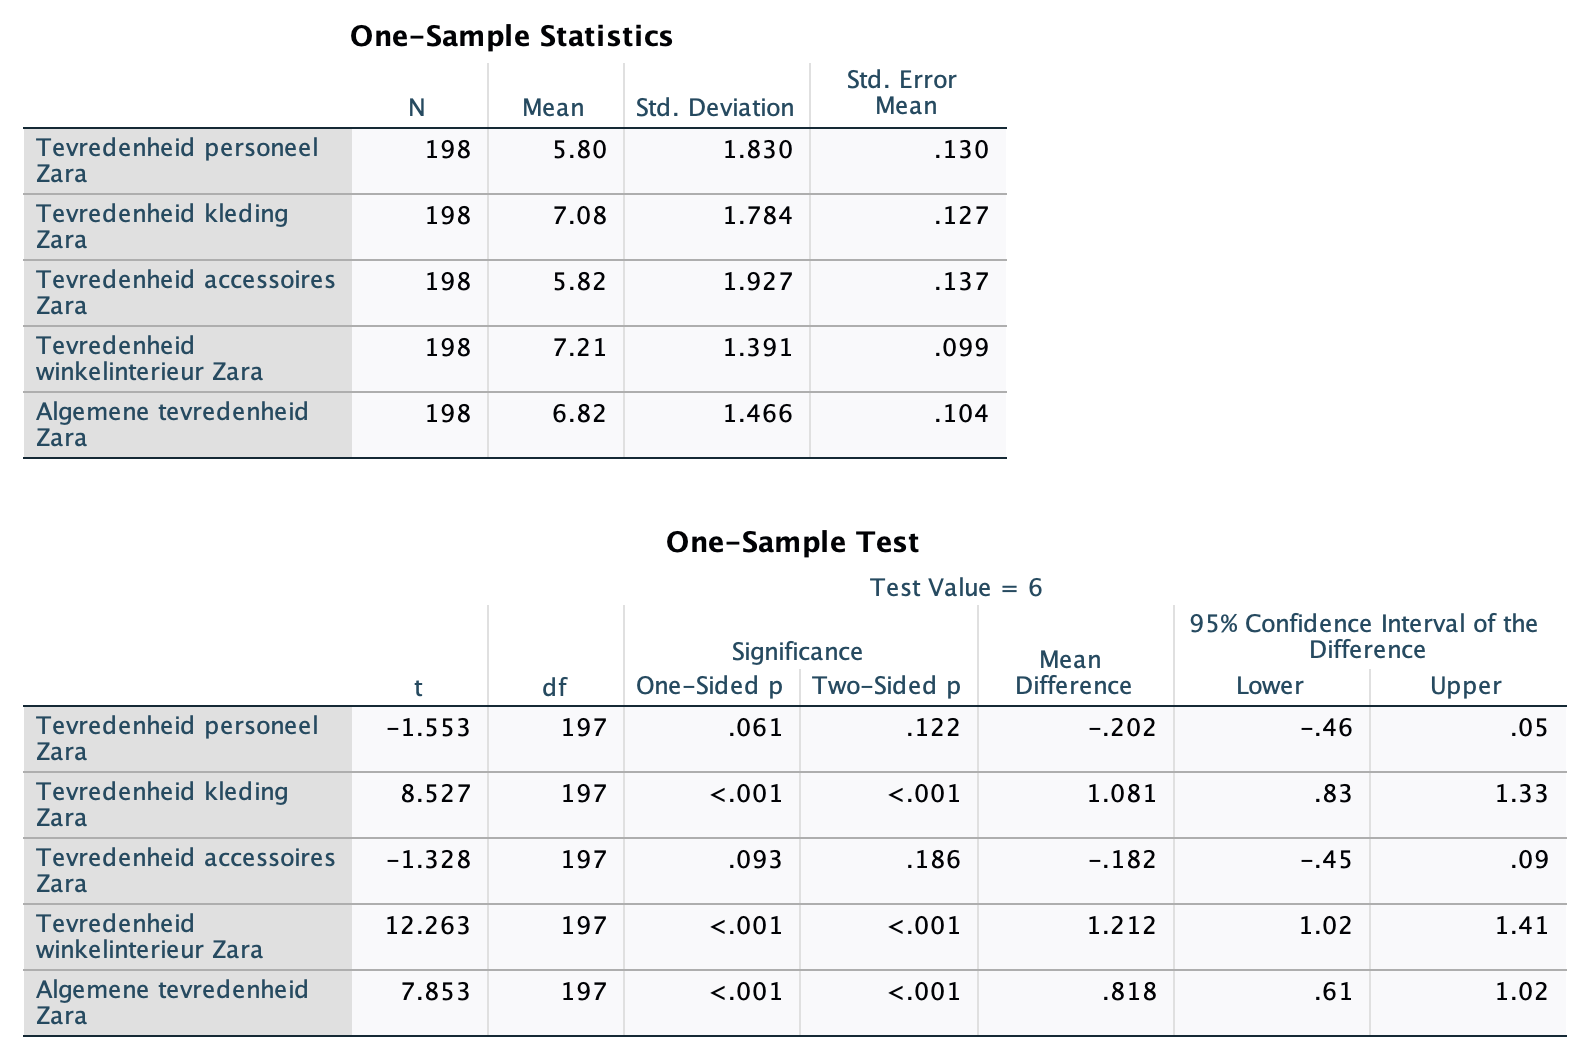
One sample t - test

knowt flashcard image
5
New cards

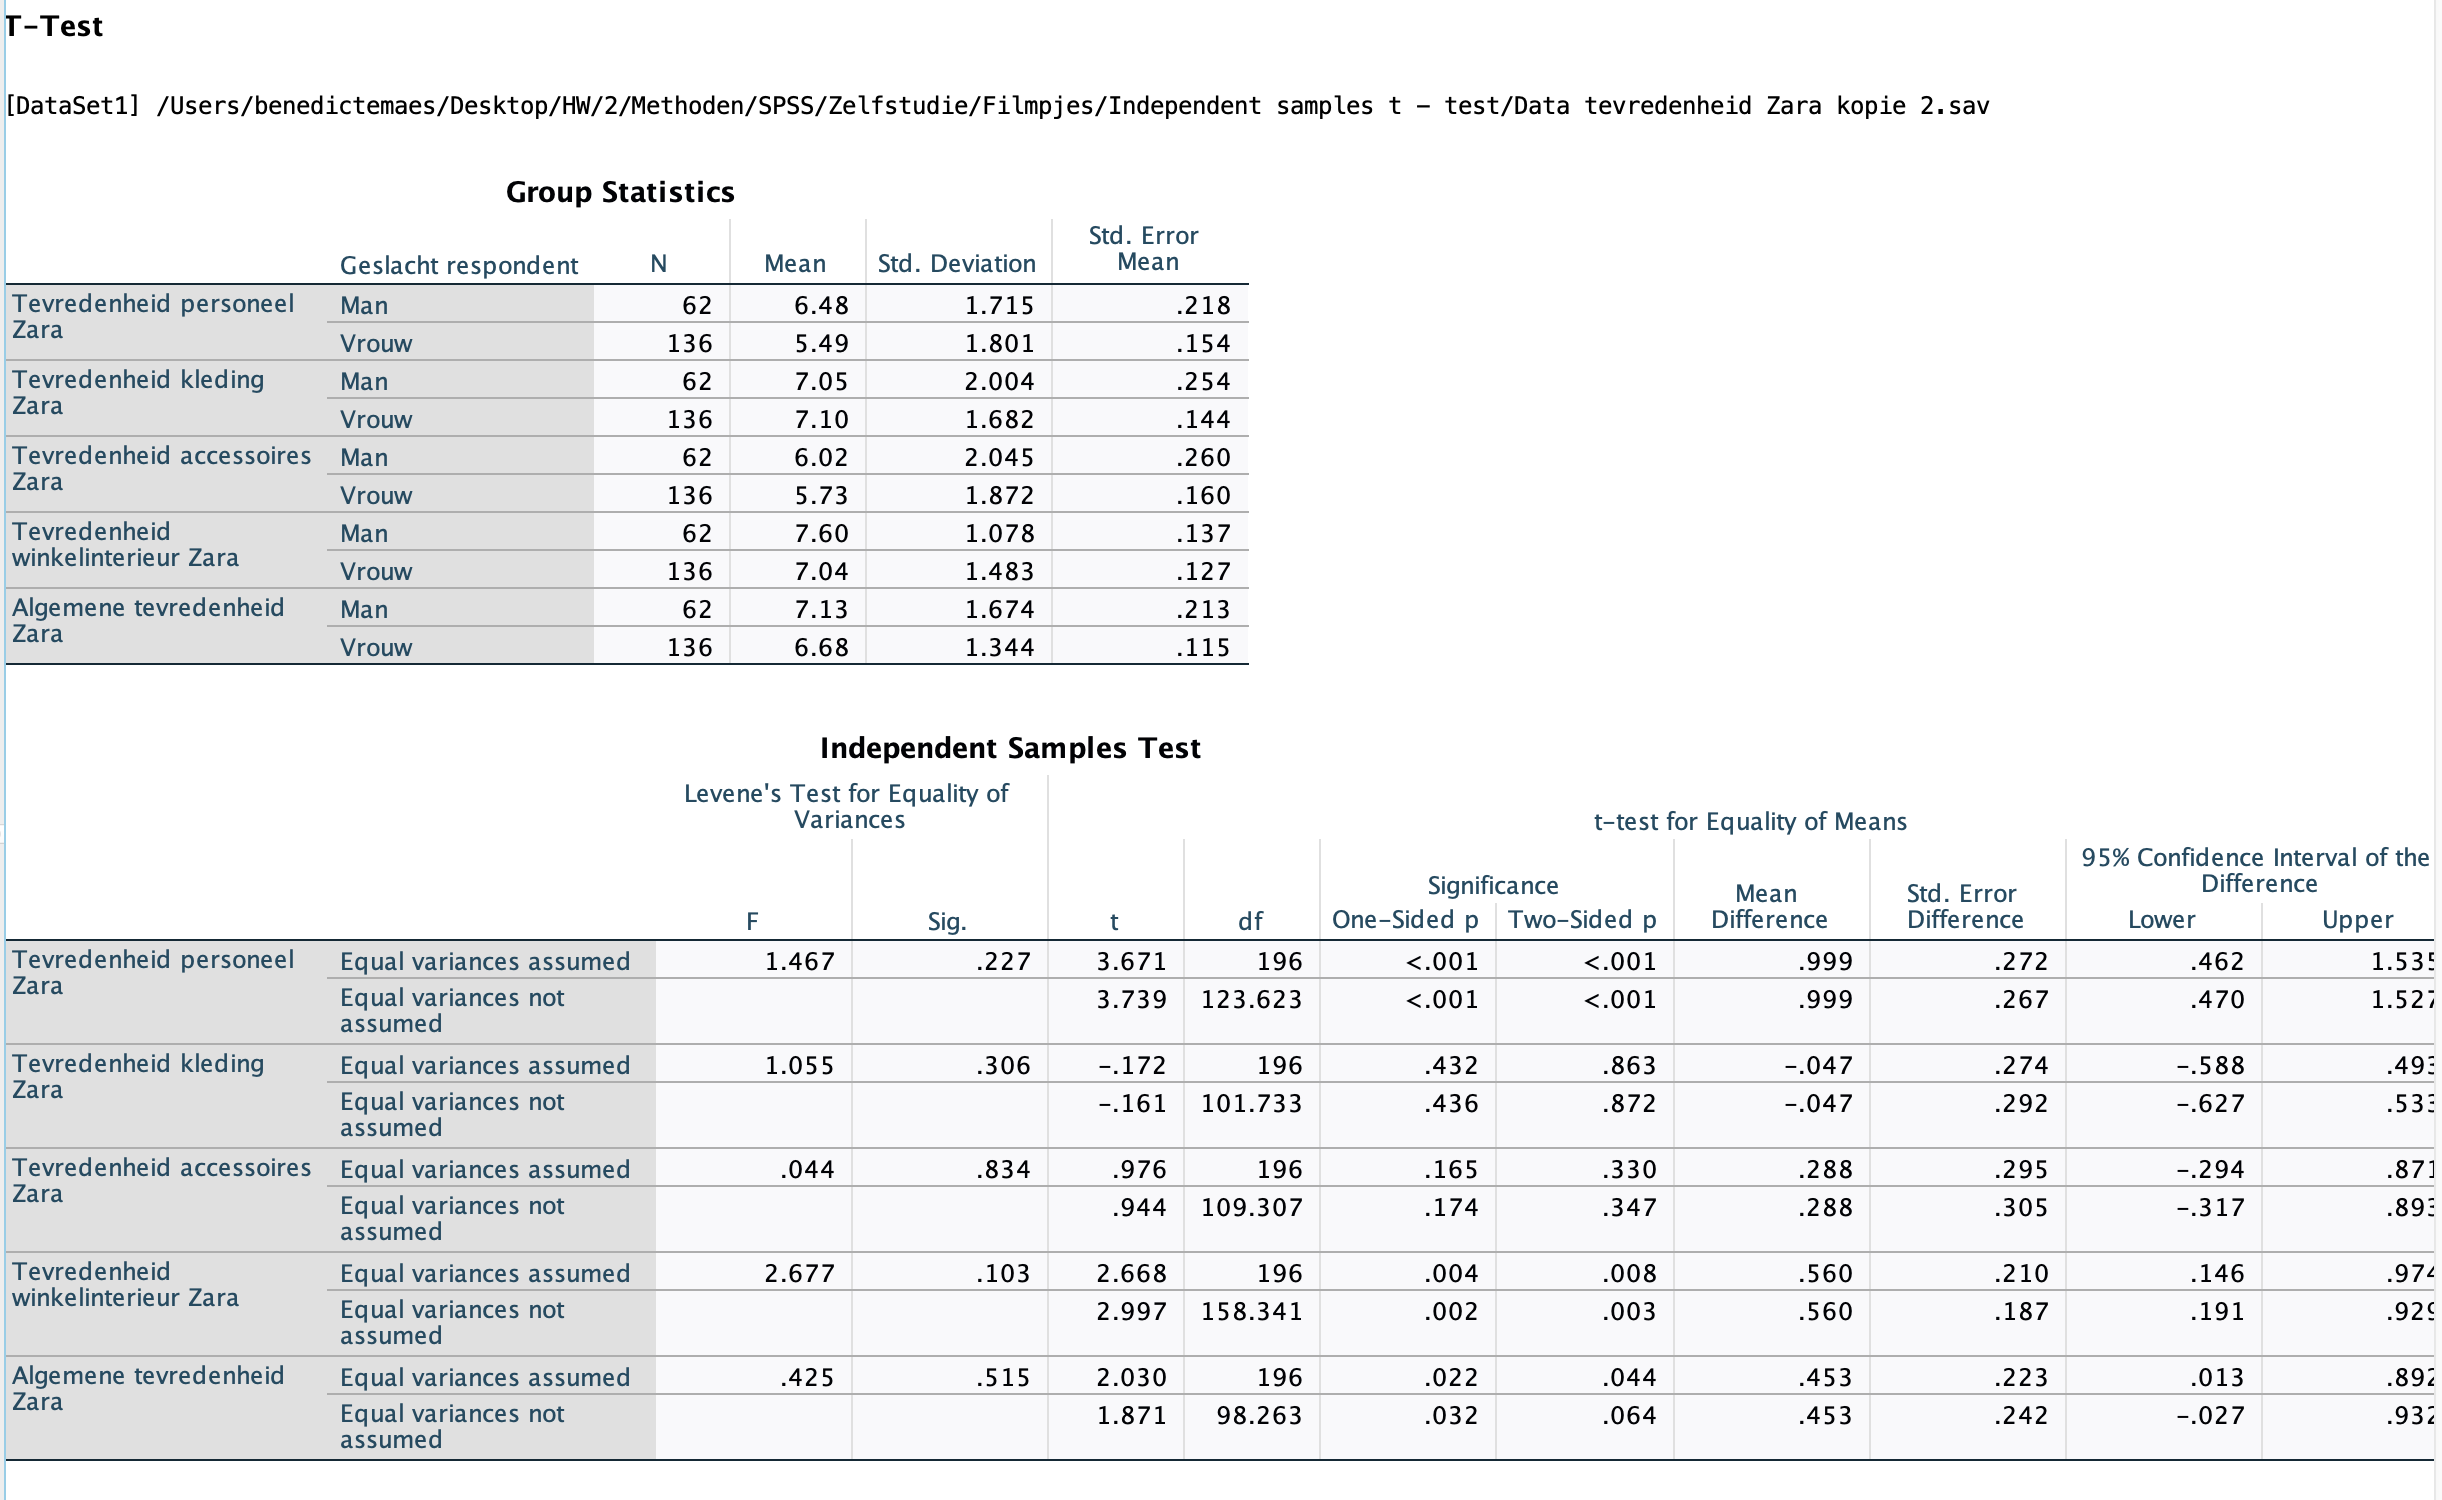
Independent t - test

  • Metingen zijn onafhankelijk van elkaar

  • Levene’s test

<ul><li><p>Metingen zijn onafhankelijk van elkaar</p></li><li><p>Levene’s test </p></li></ul><p></p>
6
New cards

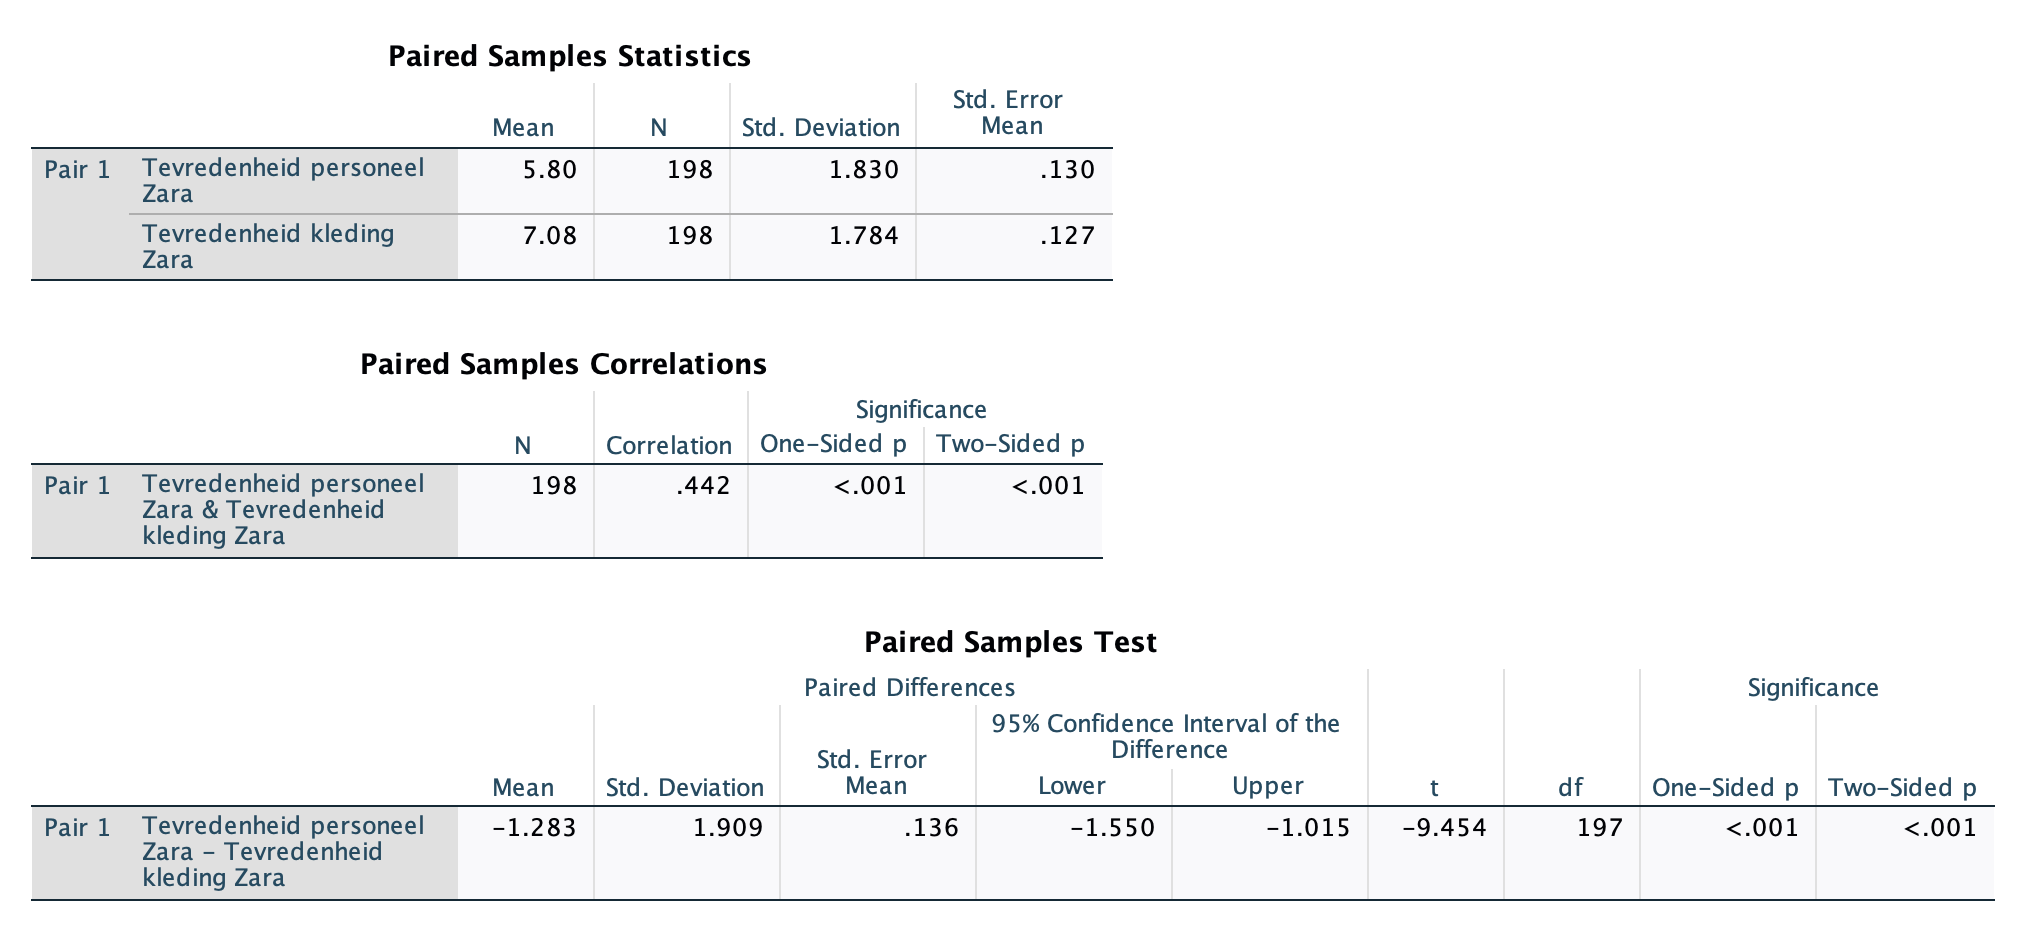
Dependent t - test

  • Metingen zijn afhankelijk van elkaar

<ul><li><p>Metingen zijn afhankelijk van elkaar </p></li></ul><p></p>
7
New cards

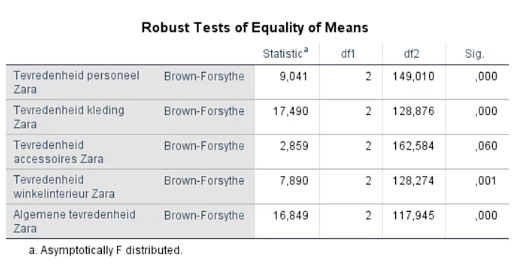
Between subject anova

  • One way anova

  • 2 of meer onafhankelijke groepen

<ul><li><p>One way anova</p></li><li><p>2 of meer onafhankelijke groepen </p></li></ul><p></p>
8
New cards

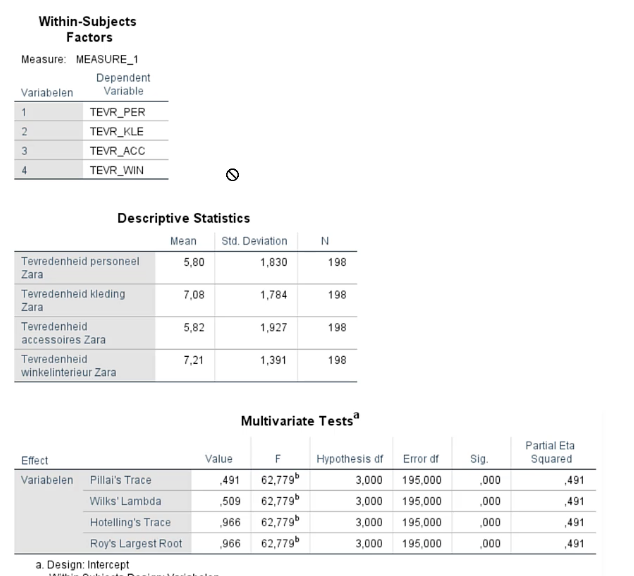
Within subject anova

  • Repeated measures anova

  • 2 of meer onafhankelijke variabelen

<ul><li><p>Repeated measures anova</p></li><li><p>2 of meer onafhankelijke variabelen </p></li></ul><p></p>
9
New cards

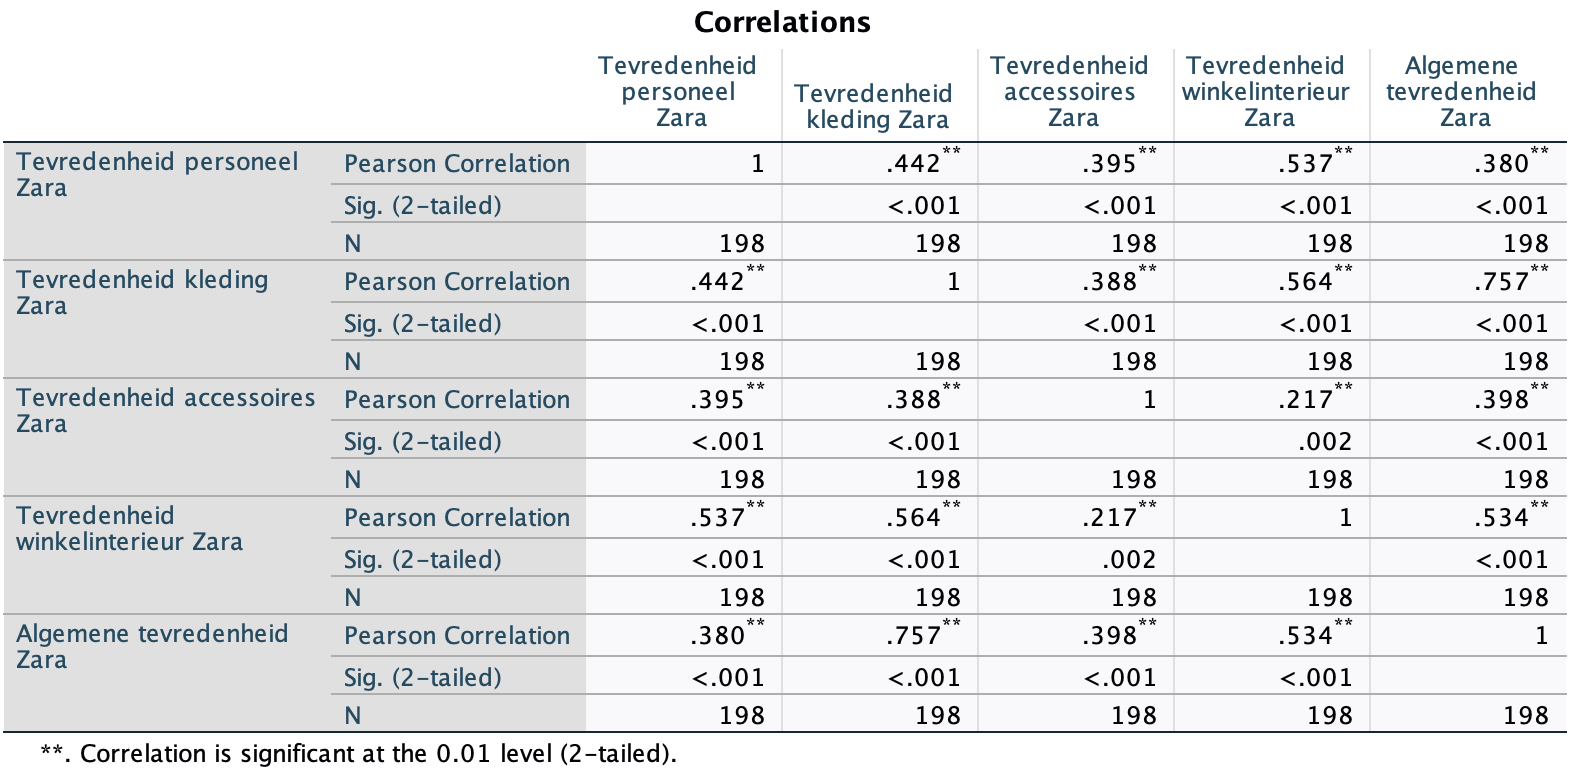
Correlatie

  • Relatie tussen 2 metrische variabelen

  • Statistische hypotheses

    • H(0): Er is geen lineaire relatie

    • H(1): Er is een lineaire relatie

<ul><li><p>Relatie tussen 2 metrische variabelen </p></li><li><p>Statistische hypotheses</p><ul><li><p><span>H(0): Er is geen lineaire relatie</span></p></li><li><p><span>H(1): Er is een lineaire relatie</span></p></li></ul></li></ul><p></p>
10
New cards

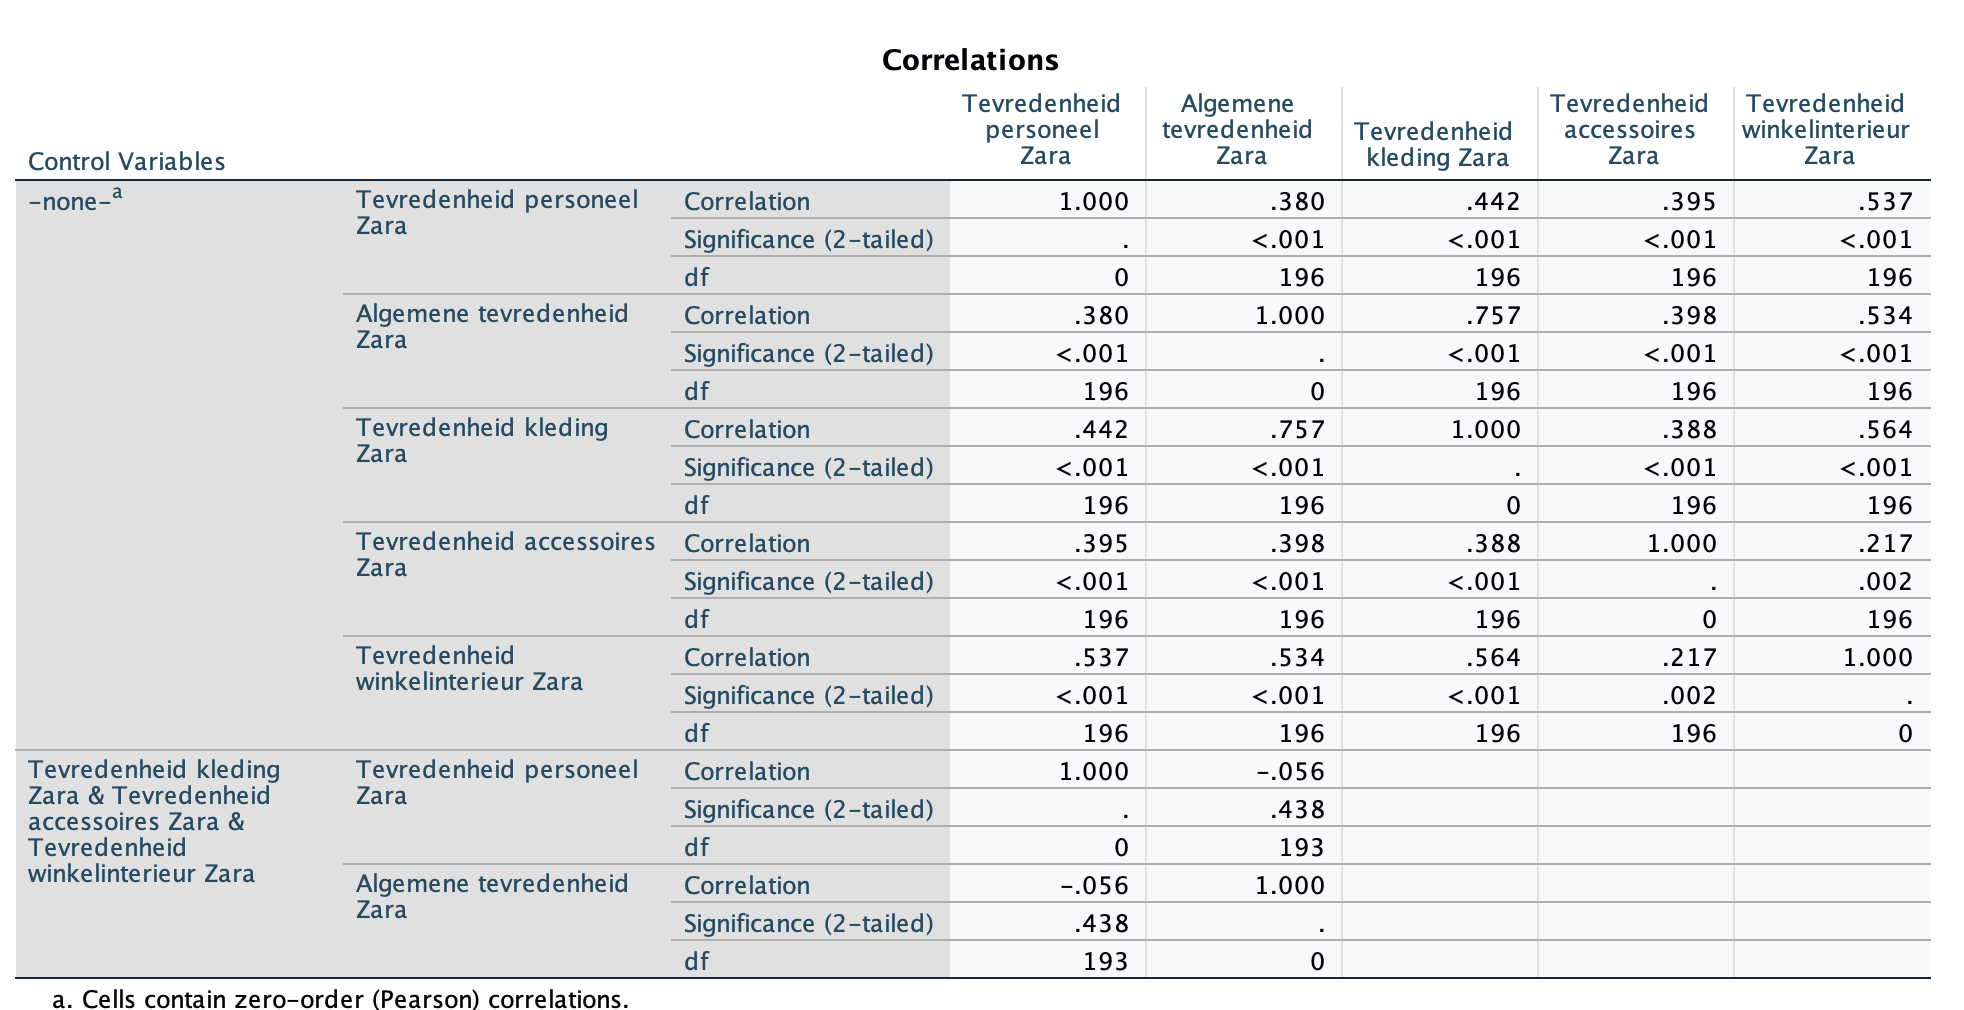
Partiële correlatie

  • Relatie tussen 2 metrische variabelen met controle invloed additionele metrische variabelen

  • Statistische hypothese

    • H(0): Er is geen lineaire relatie

    • H(1): Er is een lineaire relatie

<ul><li><p>Relatie tussen 2 metrische variabelen met controle invloed additionele metrische variabelen</p></li><li><p>Statistische hypothese</p><ul><li><p><span>H(0): Er is geen lineaire relatie</span></p></li><li><p><span>H(1): Er is een lineaire relatie</span></p></li></ul></li></ul><p></p>
11
New cards

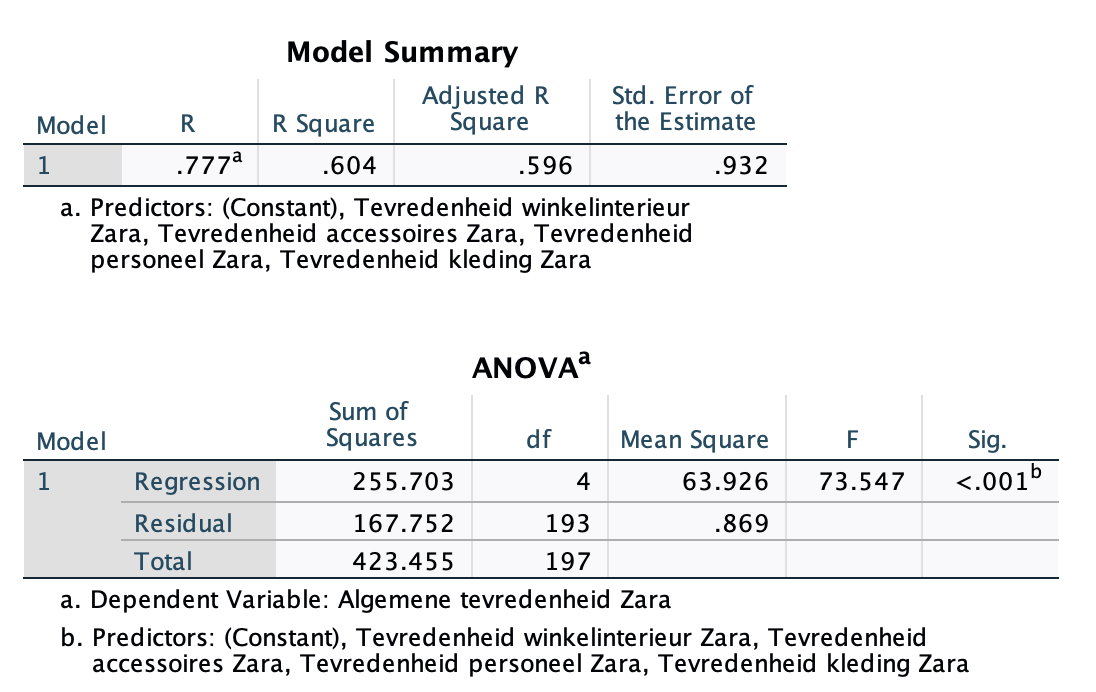
Regressie analyse

  • Relatie tussen metrische afhankelijke variabelen en een set van meerdere metrische onafhankelijke variabelen

  • Interpretatie regressie resultaten

    • Overall model performance

    • Interpretatie individuele coëfficiënten
<ul><li><p>Relatie tussen metrische <span><u>afhankelijke</u></span> variabelen en een set van meerdere metrische <span><u>onafhankelijke</u></span> variabelen</p></li><li><p>Interpretatie regressie resultaten </p><ul><li><p>Overall model performance</p></li><li><p>Interpretatie individuele coëfficiënten </p></li></ul></li></ul><p></p>
12
New cards

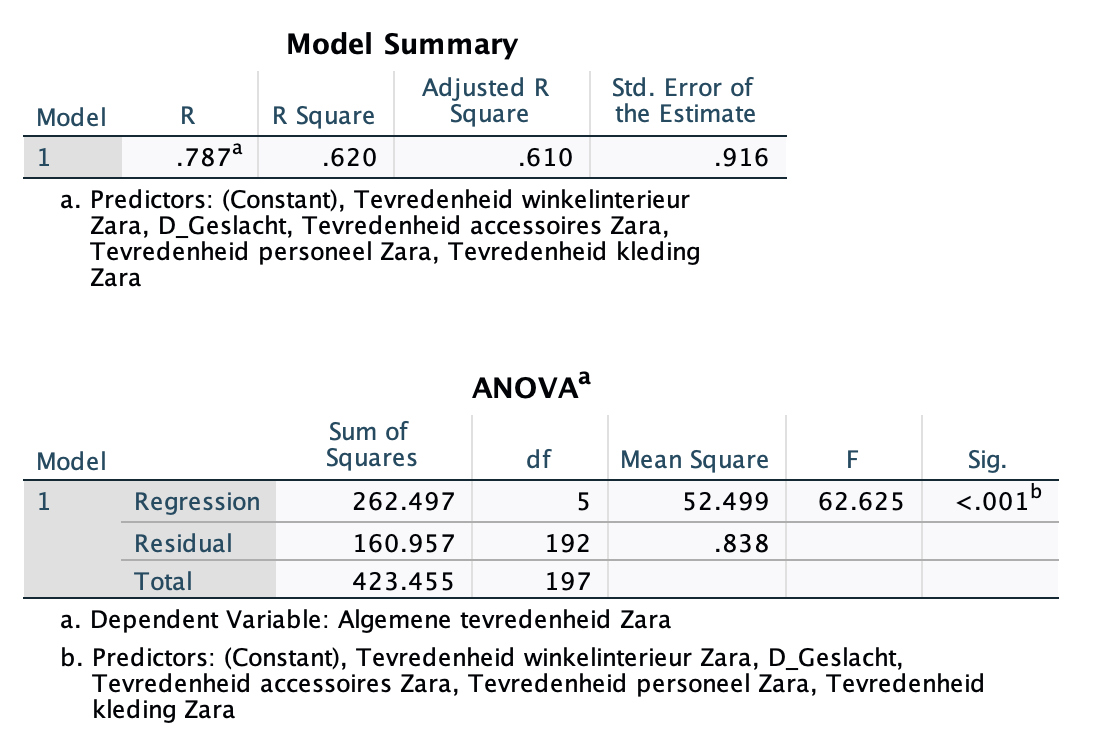
Regressieanalyse met dummies

  • Dummies: Tussen 0 en 1

  • Interpretatie regressie resultaten

    • Overall model performance

    • Interpretatie individuele coëfficiënten

<ul><li><p>Dummies: Tussen 0 en 1</p></li><li><p>Interpretatie regressie resultaten </p><ul><li><p>Overall model performance</p></li><li><p>Interpretatie individuele coëfficiënten </p></li></ul></li></ul><p></p>