AP Biology - 2020 Practice Exam 2 MCQ
1/59
Earn XP
Description and Tags
Name | Mastery | Learn | Test | Matching | Spaced | Call with Kai | Chat |
|---|
No analytics yet
Send a link to your students to track their progress
60 Terms
Which of the following best describes the hydrolysis of carbohydrates?
A: The removal of a water molecule breaks a covalent bond between sugar monomers.
B: The removal of a water molecule forms a covalent bond between sugar monomers.
C: The addition of a water molecule breaks a covalent bond between sugar monomers.
D: The addition of a water molecule forms a covalent bond between sugar monomers.
C: The addition of a water molecule breaks a covalent bond between sugar monomers.
Which of the following best describes a characteristic of DNA that makes it useful as hereditary material?
A: There are many different types of nucleotide bases that can be incorporated into DNA.
B: The nucleotide bases can also be used to provide the energy needed for reproduction.
C: Nucleotide bases can be randomly replaced with different nucleotide bases to increase variation.
D: Nucleotide bases in one strand can only be paired with specific bases in the other strand.
D: Nucleotide bases in one strand can only be paired with specific bases in the other strand.
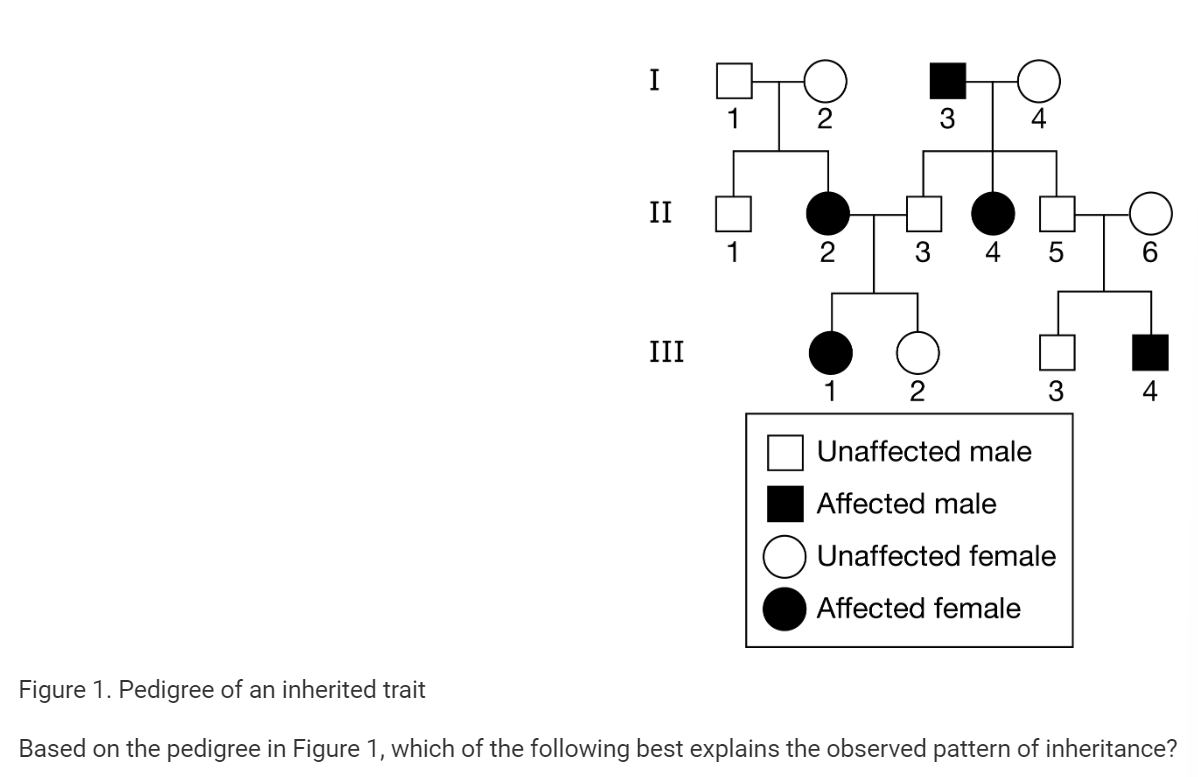
A: The trait is autosomal dominant, because the cross between individuals I-3 and I-4 produced an affected offspring.
B: The trait is autosomal recessive, because the cross between individuals I-1 and I-2 produced an affected offspring.
C:The trait is sex-linked dominant, because the cross between individuals II-5 and II-6 produced an affected male.
D: The trait is sex-linked recessive, because the cross between individuals II-2 and II-3 produced an affected female.
B: The trait is autosomal recessive, because the cross between individuals I-1 and I-2 produced an affected offspring.
To investigate bacterial metabolism, a researcher divided a population (culture) of Staphylococcus capitis bacteria into two sets of culture tubes containing glucose. The researcher added a chemical to one set of tubes and measured the pH of the cultures at 5-minute intervals as the bacteria metabolized the glucose into lactic acid. The data are shown in Table 1.
TABLE 1. AVERAGE CHANGE IN pH IN CONTROL AND TREATMENT GROUPS OVER A 40-MINUTE PERIOD |
Time (min) | Average pH of Control(±2 SE𝑥¯) | Average pH of Treatment(±2 SE𝑥¯) |
0 | 8.04±0.05 | 8.04±0.06 |
5 | 7.96±0.03 | 7.91±0.04 |
10 | 7.88±0.02 | 7.85±0.04 |
15 | 7.82±0.02 | 7.79±0.06 |
20 | 7.76±0.03 | 7.70±0.04 |
25 | 7.71±0.04 | 7.67±0.02 |
30 | 7.63±0.03 | 7.63±0.02 |
35 | 7.65±0.02 | 7.60±0.02 |
40 | 7.65±0.01 | 7.59±0.02 |
Which of the following best describes the process by which the bacteria are breaking down the glucose to produce lactic acid?
A: The bacteria are breaking down sugars in the absence of oxygen.
B: The bacteria are creating a H+ gradient to synthesize more ATP.
C: The bacteria are using their mitochondria to break down glucose in the presence of oxygen.
D: The bacteria are producing CO2 in the Krebs cycle that is then converted into lactic acid.
A: The bacteria are breaking down sugars in the absence of oxygen.
To investigate bacterial metabolism, a researcher divided a population (culture) of Staphylococcus capitis bacteria into two sets of culture tubes containing glucose. The researcher added a chemical to one set of tubes and measured the pH of the cultures at 5-minute intervals as the bacteria metabolized the glucose into lactic acid. The data are shown in Table 1.
TABLE 1. AVERAGE CHANGE IN pH IN CONTROL AND TREATMENT GROUPS OVER A 40-MINUTE PERIOD |
Time (min) | Average pH of Control(±2 SE𝑥¯) | Average pH of Treatment(±2 SE𝑥¯) |
0 | 8.04±0.05 | 8.04±0.06 |
5 | 7.96±0.03 | 7.91±0.04 |
10 | 7.88±0.02 | 7.85±0.04 |
15 | 7.82±0.02 | 7.79±0.06 |
20 | 7.76±0.03 | 7.70±0.04 |
25 | 7.71±0.04 | 7.67±0.02 |
30 | 7.63±0.03 | 7.63±0.02 |
35 | 7.65±0.02 | 7.60±0.02 |
40 | 7.65±0.01 | 7.59±0.02 |
Which of the following was the dependent variable in the researcher’s experiment?
A: Time
B: pH
C: Gluclose Concentration
D: Lactic acid concentration
B: pH
To investigate bacterial metabolism, a researcher divided a population (culture) of Staphylococcus capitis bacteria into two sets of culture tubes containing glucose. The researcher added a chemical to one set of tubes and measured the pH of the cultures at 5-minute intervals as the bacteria metabolized the glucose into lactic acid. The data are shown in Table 1.
TABLE 1. AVERAGE CHANGE IN pH IN CONTROL AND TREATMENT GROUPS OVER A 40-MINUTE PERIOD |
Time (min) | Average pH of Control(±2 SE𝑥¯) | Average pH of Treatment(±2 SE𝑥¯) |
0 | 8.04±0.05 | 8.04±0.06 |
5 | 7.96±0.03 | 7.91±0.04 |
10 | 7.88±0.02 | 7.85±0.04 |
15 | 7.82±0.02 | 7.79±0.06 |
20 | 7.76±0.03 | 7.70±0.04 |
25 | 7.71±0.04 | 7.67±0.02 |
30 | 7.63±0.03 | 7.63±0.02 |
35 | 7.65±0.02 | 7.60±0.02 |
40 | 7.65±0.01 | 7.59±0.02 |
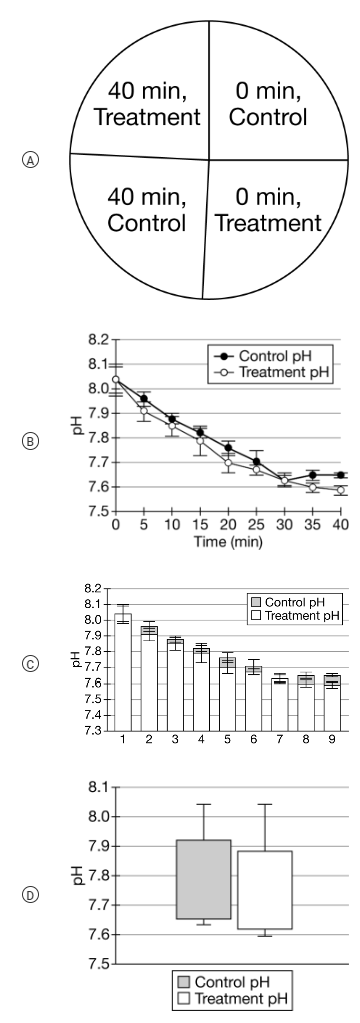
Which of the following graphs best represents the data in Table 1?
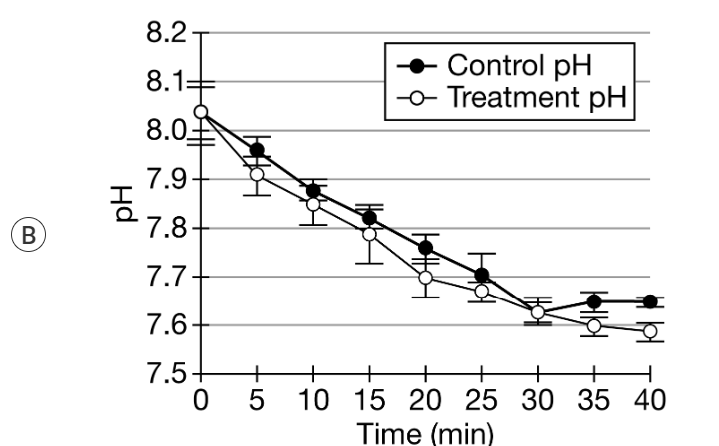
To investigate bacterial metabolism, a researcher divided a population (culture) of Staphylococcus capitis bacteria into two sets of culture tubes containing glucose. The researcher added a chemical to one set of tubes and measured the pH of the cultures at 5-minute intervals as the bacteria metabolized the glucose into lactic acid. The data are shown in Table 1.
TABLE 1. AVERAGE CHANGE IN pH IN CONTROL AND TREATMENT GROUPS OVER A 40-MINUTE PERIOD |
Time (min) | Average pH of Control(±2 SE𝑥¯) | Average pH of Treatment(±2 SE𝑥¯) |
0 | 8.04±0.05 | 8.04±0.06 |
5 | 7.96±0.03 | 7.91±0.04 |
10 | 7.88±0.02 | 7.85±0.04 |
15 | 7.82±0.02 | 7.79±0.06 |
20 | 7.76±0.03 | 7.70±0.04 |
25 | 7.71±0.04 | 7.67±0.02 |
30 | 7.63±0.03 | 7.63±0.02 |
35 | 7.65±0.02 | 7.60±0.02 |
40 | 7.65±0.01 | 7.59±0.02 |
Based on the data in Table 1, which of the following is the earliest time point at which there is a statistical difference in average pH between the control and treatment groups?
A: 5 min
B: 15 min
C: 20 min
D: 35 min
D: 35 min
To investigate bacterial metabolism, a researcher divided a population (culture) of Staphylococcus capitis bacteria into two sets of culture tubes containing glucose. The researcher added a chemical to one set of tubes and measured the pH of the cultures at 5-minute intervals as the bacteria metabolized the glucose into lactic acid. The data are shown in Table 1.
TABLE 1. AVERAGE CHANGE IN pH IN CONTROL AND TREATMENT GROUPS OVER A 40-MINUTE PERIOD |
Time (min) | Average pH of Control(±2 SE𝑥¯) | Average pH of Treatment(±2 SE𝑥¯) |
0 | 8.04±0.05 | 8.04±0.06 |
5 | 7.96±0.03 | 7.91±0.04 |
10 | 7.88±0.02 | 7.85±0.04 |
15 | 7.82±0.02 | 7.79±0.06 |
20 | 7.76±0.03 | 7.70±0.04 |
25 | 7.71±0.04 | 7.67±0.02 |
30 | 7.63±0.03 | 7.63±0.02 |
35 | 7.65±0.02 | 7.60±0.02 |
40 | 7.65±0.01 | 7.59±0.02 |
According to the data, which of the following best explains the results of the experiment?
A: The pH of the treatment culture was lower than the pH of the control because the chemical increased the bacterial metabolic rate.
B: The pH of the treatment culture was higher than the pH of the control because the chemical denatured bacterial enzymes and decreased the metabolic rate.
C: The chemical increased the metabolic rate of the bacteria because it lowered the pH.
D: The chemical decreased the metabolic rate of the bacteria because it bound all available oxygen.
A: The pH of the treatment culture was lower than the pH of the control because the chemical increased the bacterial metabolic rate.
A mutation in the gene coding for a single-polypeptide enzyme results in the substitution of the amino acid serine, which has a polar R group, by the amino acid phenylalanine, which has a nonpolar R group. When researchers test the catalysis of the normal enzyme and the mutated enzyme, they find that the mutated enzyme has much lower activity than the normal enzyme does.
Which of the following most likely explains how the amino acid substitution has resulted in decreased catalytic activity by the mutated enzyme?
A: The substitution decreased the mass of the enzyme so that the mutated enzyme binds more weakly to the substrate than the normal enzyme does.
B: The substitution altered the secondary and tertiary structure of the enzyme so that the mutated enzyme folds into a different shape than the normal enzyme does.
C: The substitution caused many copies of the mutated enzyme to cluster together and compete for substrate to bind.
D: The substitution caused the directionality of the enzyme to change such that the amino terminus of the normal enzyme has become the carboxy terminus of the mutated enzyme.
B: The substitution altered the secondary and tertiary structure of the enzyme so that the mutated enzyme folds into a different shape than the normal enzyme does.
Pitcher plants are carnivorous plants that grow in areas where the soil contains low levels of key nutrients such as nitrogen. To obtain these nutrients, most pitcher plants capture prey using traps containing a digestive fluid. The captured prey are then broken down and digested, and the pitcher plant absorbs the nutrients.
The traps of one species of pitcher plant, Nepenthes hemsleyana, do not contain digestive fluid. Instead they provide a suitable place for woolly bats (Kerivoula hardwickii) to sleep. The feces from the bat are released into the trap where nutrients in the feces are absorbed and provide the plant with the nitrogen it needs.
Which of the following best describes the relationship between the pitcher plant and the woolly bat?
A: The relationship is an example of parasitism because the bat is harmed while the plant benefits.
B: The relationship is an example of mutualism because both the plant and the bat benefit.
C: The relationship is an example of commensalism because the plant benefits but the bat is unaffected.
D: The relationship is an example of commensalism because the plant is unaffected while the bat benefits.
B: The relationship is an example of mutualism because both the plant and the bat benefit.
A particular genetic disorder is associated with a single gene with two alleles. Individuals with two recessive alleles are affected. The prevalence of the disorder is 1 in 6,600.
Assuming the population is in Hardy-Weinberg equilibrium, which of the following is closest to the frequency of carriers in the general population?
A: 0.00015
B: 0.01230
C: 0.02430
D: 0.98770
C: 0.02430
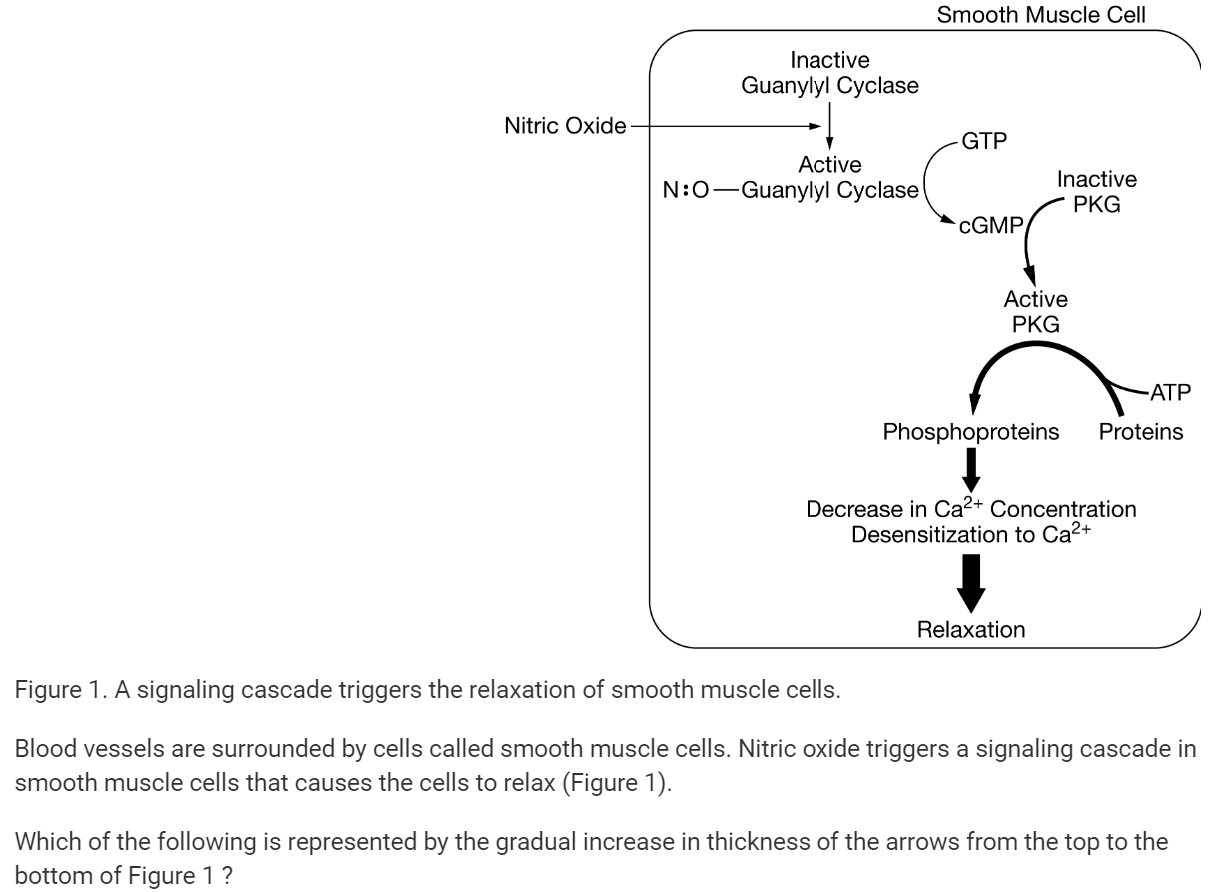
A: The rate at which nitric oxide triggers signaling gradually increases over time.
B: The number of signaling molecules that are produced or activated increases with each step in the pathway.
C: The size of the proteins in the pathway increases as the signaling cascade moves through the cell.
D: The signaling pathway uses an increase in negative feedback to reduce intracellular Ca2+ levels and cell sensitivity to Ca2+.
B: The number of signaling molecules that are produced or activated increases with each step in the pathway.
A student peeled the skins from grapes, exposing cells with membranes that are only permeable to water and small diffusible solutes. The student measured the mass of the peeled grapes. The student then placed each peeled grape into one of five solutions. After 24 hours, the student removed the peeled grapes from the solutions, measured their final mass, and calculated the percent change in mass (Table 1).
TABLE 1. PERCENT CHANGE IN MASS OF PEELED GRAPES IN SOLUTIONS |
Solution | Concentration of Solution(weight/volume) | Percent Change in Mass |
|---|---|---|
Distilled water | 0% | 13.48% |
NaCl | 20% | −23.39% |
Tap water | 0.8% | 9.46% |
Grape juice | 2.1% | 2.8% |
Grape soda | 13% | −15.00% |
In a second experiment (Table 2), the student placed a peeled grape into a solution containing both small diffusible solutes and solutes to which the membrane is impermeable (nondiffusible solutes).
TABLE 2. CONCENTRATION OF SOLUTES IN SECOND EXPERIMENT |
Location | Concentration of Small Diffusible Solutes | Concentration of Nondiffusible Solutes |
Inside grape | 0.4M | 1.2M |
In solution | 1.6M | 0.8M |
Based on Table 1, which of the following best explains the difference in water potential between certain solutions and the grapes?
A: NaCl and tap water have a lower water potential because these two solutions caused the grape to gain water.
B: Grape soda and NaCl have a lower water potential because these two solutions caused the grape to lose water.
C: Tap water and grape juice have a lower water potential because these two solutions caused the grape to lose water.
D: Grape soda and grape juice have a lower water potential because these two solutions caused the grape to gain water.
B: Grape soda and NaCl have a lower water potential because these two solutions caused the grape to lose water.
A student peeled the skins from grapes, exposing cells with membranes that are only permeable to water and small diffusible solutes. The student measured the mass of the peeled grapes. The student then placed each peeled grape into one of five solutions. After 24 hours, the student removed the peeled grapes from the solutions, measured their final mass, and calculated the percent change in mass (Table 1).
TABLE 1. PERCENT CHANGE IN MASS OF PEELED GRAPES IN SOLUTIONS |
Solution | Concentration of Solution(weight/volume) | Percent Change in Mass |
|---|---|---|
Distilled water | 0% | 13.48% |
NaCl | 20% | −23.39% |
Tap water | 0.8% | 9.46% |
Grape juice | 2.1% | 2.8% |
Grape soda | 13% | −15.00% |
In a second experiment (Table 2), the student placed a peeled grape into a solution containing both small diffusible solutes and solutes to which the membrane is impermeable (nondiffusible solutes).
TABLE 2. CONCENTRATION OF SOLUTES IN SECOND EXPERIMENT |
Location | Concentration of Small Diffusible Solutes | Concentration of Nondiffusible Solutes |
Inside grape | 0.4M | 1.2M |
In solution | 1.6M | 0.8M |
Based on Table 1, which of the following percentages is closest to the solute concentration of the grape?
A: 0.0%
B: 1.3%
C: 5.5%
D: 10.1%
C: 5.5%
A student peeled the skins from grapes, exposing cells with membranes that are only permeable to water and small diffusible solutes. The student measured the mass of the peeled grapes. The student then placed each peeled grape into one of five solutions. After 24 hours, the student removed the peeled grapes from the solutions, measured their final mass, and calculated the percent change in mass (Table 1).
TABLE 1. PERCENT CHANGE IN MASS OF PEELED GRAPES IN SOLUTIONS |
Solution | Concentration of Solution(weight/volume) | Percent Change in Mass |
|---|---|---|
Distilled water | 0% | 13.48% |
NaCl | 20% | −23.39% |
Tap water | 0.8% | 9.46% |
Grape juice | 2.1% | 2.8% |
Grape soda | 13% | −15.00% |
In a second experiment (Table 2), the student placed a peeled grape into a solution containing both small diffusible solutes and solutes to which the membrane is impermeable (nondiffusible solutes).
TABLE 2. CONCENTRATION OF SOLUTES IN SECOND EXPERIMENT |
Location | Concentration of Small Diffusible Solutes | Concentration of Nondiffusible Solutes |
Inside grape | 0.4M | 1.2M |
In solution | 1.6M | 0.8M |
A student hypothesizes that the solute concentration of grape juice is higher than the solute concentration of the actual grape because the grape juice has added sugar.
Based on the data in Table 1, which of the following best evaluates the student’s hypothesis?
A: The hypothesis is supported because the mass of the grape decreased in the grape juice.
B: The hypothesis is supported because the grape juice has a greater solute potential than the grape has.
C: The hypothesis is not supported because the grape was isotonic to the grape juice.
D: The hypothesis is not supported because the mass of the grape increased in the grape juice.
D: The hypothesis is not supported because the mass of the grape increased in the grape juice.
A student peeled the skins from grapes, exposing cells with membranes that are only permeable to water and small diffusible solutes. The student measured the mass of the peeled grapes. The student then placed each peeled grape into one of five solutions. After 24 hours, the student removed the peeled grapes from the solutions, measured their final mass, and calculated the percent change in mass (Table 1).
TABLE 1. PERCENT CHANGE IN MASS OF PEELED GRAPES IN SOLUTIONS |
Solution | Concentration of Solution(weight/volume) | Percent Change in Mass |
|---|---|---|
Distilled water | 0% | 13.48% |
NaCl | 20% | −23.39% |
Tap water | 0.8% | 9.46% |
Grape juice | 2.1% | 2.8% |
Grape soda | 13% | −15.00% |
In a second experiment (Table 2), the student placed a peeled grape into a solution containing both small diffusible solutes and solutes to which the membrane is impermeable (nondiffusible solutes).
TABLE 2. CONCENTRATION OF SOLUTES IN SECOND EXPERIMENT |
Location | Concentration of Small Diffusible Solutes | Concentration of Nondiffusible Solutes |
Inside grape | 0.4M | 1.2M |
In solution | 1.6M | 0.8M |
Assuming a negligible pressure potential, which of the following best predicts the net movement of the small diffusible solutes and water in the second experiment (Table 2) ?
A: Small diffusible solutes will diffuse into the grape cells, followed by water.
B: Small diffusible solutes will diffuse out of the grape cells and water will diffuse into the cells.
C: Small diffusible solutes will diffuse out of the grape cells, followed by water.
D: Small diffusible solutes will diffuse into the grape cells and water will diffuse out of the cells.
A: Small diffusible solutes will diffuse into the grape cells, followed by water.
A student peeled the skins from grapes, exposing cells with membranes that are only permeable to water and small diffusible solutes. The student measured the mass of the peeled grapes. The student then placed each peeled grape into one of five solutions. After 24 hours, the student removed the peeled grapes from the solutions, measured their final mass, and calculated the percent change in mass (Table 1).
TABLE 1. PERCENT CHANGE IN MASS OF PEELED GRAPES IN SOLUTIONS |
Solution | Concentration of Solution(weight/volume) | Percent Change in Mass |
|---|---|---|
Distilled water | 0% | 13.48% |
NaCl | 20% | −23.39% |
Tap water | 0.8% | 9.46% |
Grape juice | 2.1% | 2.8% |
Grape soda | 13% | −15.00% |
In a second experiment (Table 2), the student placed a peeled grape into a solution containing both small diffusible solutes and solutes to which the membrane is impermeable (nondiffusible solutes).
TABLE 2. CONCENTRATION OF SOLUTES IN SECOND EXPERIMENT |
Location | Concentration of Small Diffusible Solutes | Concentration of Nondiffusible Solutes |
Inside grape | 0.4M | 1.2M |
In solution | 1.6M | 0.8M |
Mercurial sulfhydryl is an inhibitor of aquaporins. Which of the following is the most likely effect of adding mercurial sulfhydryl to the distilled water solution?
A: The grape cells will burst because of excess water entering by active transport.
B: The grape cells will gain more water because of the activation of the transport protein.
C: The grape cells will shrink because active transport has been inhibited.
D: The grape cells will gain water more slowly because of a lack of facilitated diffusion.
D: The grape cells will gain water more slowly because of a lack of facilitated diffusion.
A student peeled the skins from grapes, exposing cells with membranes that are only permeable to water and small diffusible solutes. The student measured the mass of the peeled grapes. The student then placed each peeled grape into one of five solutions. After 24 hours, the student removed the peeled grapes from the solutions, measured their final mass, and calculated the percent change in mass (Table 1).
TABLE 1. PERCENT CHANGE IN MASS OF PEELED GRAPES IN SOLUTIONS |
Solution | Concentration of Solution(weight/volume) | Percent Change in Mass |
|---|---|---|
Distilled water | 0% | 13.48% |
NaCl | 20% | −23.39% |
Tap water | 0.8% | 9.46% |
Grape juice | 2.1% | 2.8% |
Grape soda | 13% | −15.00% |
In a second experiment (Table 2), the student placed a peeled grape into a solution containing both small diffusible solutes and solutes to which the membrane is impermeable (nondiffusible solutes).
TABLE 2. CONCENTRATION OF SOLUTES IN SECOND EXPERIMENT |
Location | Concentration of Small Diffusible Solutes | Concentration of Nondiffusible Solutes |
Inside grape | 0.4M | 1.2M |
In solution | 1.6M | 0.8M |
Which of the following best explains why larger grapes have a different rate of water absorption per gram of mass than smaller grapes do?
A: The rate is slower because smaller grapes have a larger surface-area-to-volume ratio than the larger grapes do.
B: The rate is slower because larger grapes have a larger surface-area-to-volume ratio than the smaller grapes do.
C: The rate is slower because smaller grapes can expand more than larger grapes to hold excess water.
D: The rate is slower because larger grapes have more volume to hold excess water than smaller grapes do.
A: The rate is slower because smaller grapes have a larger surface-area-to-volume ratio than the larger grapes do.
Which of the following best explains how some cells of an individual produce and secrete a specific enzyme, but other cells of the same individual do not?
A: The cells contain different genes and therefore do not make the same proteins.
B: The cells have evolved under different selective pressures, resulting in some cells making proteins that others cannot.
C: The cells transcribe and translate different combinations of genes, leading to the production of different sets of proteins.
D: The cells produce different types of ribosomes that enable the translation of different genes.
C: The cells transcribe and translate different combinations of genes, leading to the production of different sets of proteins.
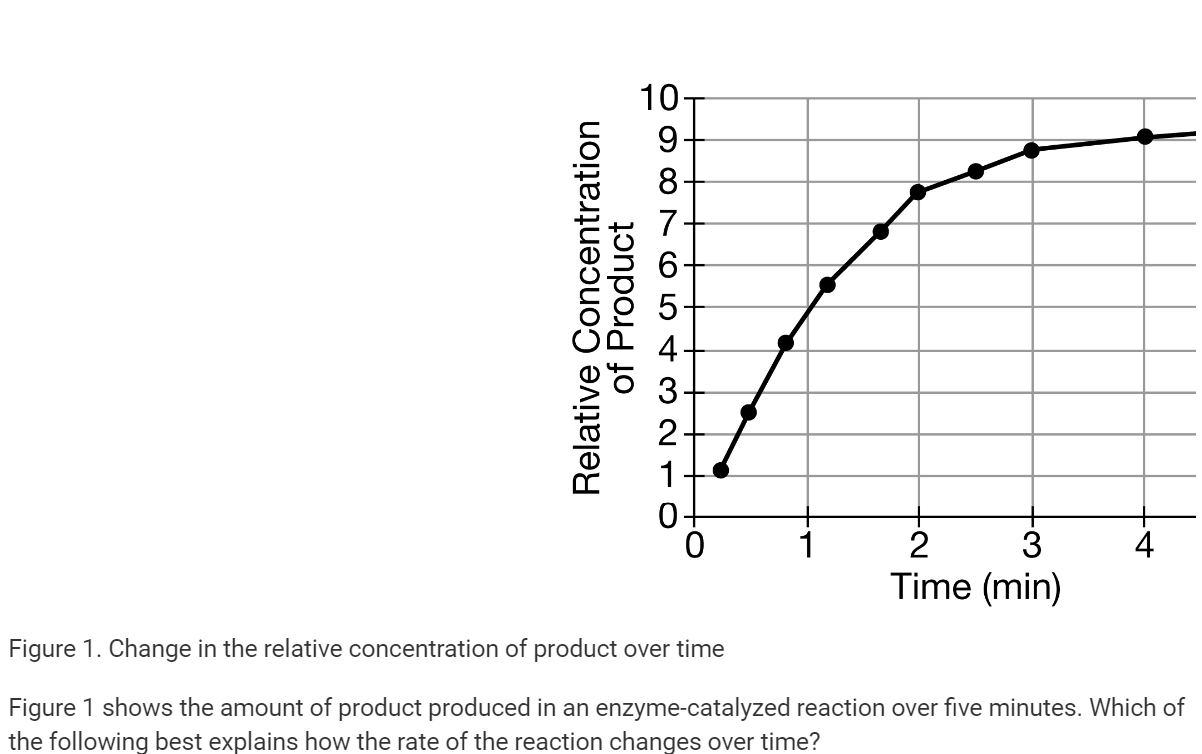
A: The rate increases because more products are made over time.
B: The rate increases because the ratio of product to substrate increases.
C: The rate decreases because the ratio of product to substrate increases.
D: The rate decreases because the enzyme is used up as the reaction progresses.
C: The rate decreases because the ratio of product to substrate increases.
Pyruvate kinase, a key enzyme in the glycolysis pathway, is inhibited by the amino acid alanine. The ability of alanine to inhibit the enzyme is not affected by increasing the concentration of substrate.
Which of the following best explains the mechanism by which alanine inhibits pyruvate kinase activity?
A: Alanine binds to an allosteric site of the enzyme, changing the shape of the enzyme’s active site.
B: Alanine increases the enzyme-substrate binding until the enzyme becomes saturated.
C: Alanine is a competitive inhibitor that reversibly binds to the active site of the enzyme.
D: Alanine binds to the substrate, preventing the substrate from being able to bind to the active site of the enzyme.
A: Alanine binds to an allosteric site of the enzyme, changing the shape of the enzyme’s active site.
Different species of bumblebee compete for flower nectar in their ecosystem. While the flowers vary in the length of their petals, bumblebees vary in the length of a mouth part called a proboscis. Bumblebees demonstrate a preference for flowers that correspond to the length of their proboscis. Species with proboscises of similar length tend to occupy different areas. Species that live in the same area tend to have proboscises of different lengths.
Which of the following best explains the relationship between the different bumblebee species living in the same area?
A: The bumblebees have undergone allopatric speciation due to geographic isolation.
B: The bumblebees have undergone niche partitioning due to competition.
C: The bumblebees have a mutualistic relationship with other bumblebee species due to natural selection.
D: The bumblebees have a commensalistic relationship due to the variety of niches that are available.
B: The bumblebees have undergone niche partitioning due to competition.
Researchers investigated whether time of day affects the rate at which certain mRNAs produced by plants are broken down. At either 1 hour after the start of the light period (morning) or 8 hours after the start of the light period (afternoon), the researchers treated identical plant seedlings with a compound that blocks transcription (time=0min). The researchers measured the percent remaining of two mRNAs, mRNA G and mRNA H, over the course of 120 minutes. The data are shown in Figure 1.

Figure 1. Degradation of mRNA G and mRNA H over time after exposure to light for 1 hour (morning) or 8 hours (afternoon)
Based on the data, which of the following best describes the relationship between light and the degradation of mRNA G and mRNA H?
A: Exposure to light causes the degradation of both mRNA G and mRNA H.
B: mRNA G and mRNA H degrade at the same rate during morning exposure to light.
C: A longer exposure to light increases the rate of mRNA G degradation but not of mRNA H degradation.
D: Exposure to more-intense afternoon light causes both mRNA G and mRNA H to degrade more rapidly in the afternoon than in the morning.
A longer exposure to light increases the rate of mRNA G degradation but not of mRNA H degradation.
Which of the following observations would provide the strongest evidence that two plants belong to different biological species?
A: There are variations in their RNA sequences.
B: The leaves and flowers show morphological differences.
C: They produce viable but sterile offspring.
D: They occupy unique habitats in an ecosystem.
C: They produce viable but sterile offspring.

Figure 1. Pathway activated by insulin binding to the insulin receptor

Figure 2: Blood insulin levels in normal mice and 𝐸𝑠𝑝 mutant mice after exposure to glucose
Hormones are chemical signals that are released by cells in one part of the body that travel through the bloodstream to signal cells in another part of the body. Insulin is a hormone that is released by the pancreas that induces the uptake of glucose molecules from the bloodstream into cells. In this way, insulin lowers the overall blood glucose levels of the body. Osteoblasts and osteoclasts are two types of bone cells that play a role in regulating blood glucose levels (Figure 1).
Binding of insulin to the insulin receptor on osteoblasts activates a signaling pathway that results in osteoblasts releasing a molecule, OPG, that binds to neighboring osteoclasts. In response, the osteoclasts release protons (H+) and create an area of lower pH outside the cell. This low pH activates osteocalcin, a protein secreted in an inactive form by osteoblasts.
The 𝐸𝑠𝑝 gene encodes a protein that alters the structure of the insulin receptor on osteoblasts and interferes with the binding of insulin to the receptor. A researcher created a group of osteoblasts with an 𝐸𝑠𝑝 mutation that prevented the production of a functional 𝐸𝑠𝑝 product (mutant). The researcher then exposed the mutant strain and a normal strain that expresses 𝐸𝑠𝑝 to glucose and compared the levels of insulin in the blood near the osteoblasts (Figure 2).
Based on the information provided, which of the following best justifies the claim that osteocalcin is a hormone?
A: The phosphorylation of the insulin receptor causes a response in osteoblast bone cells.
B: The osteoblasts in the bone secrete osteocalcin, which causes cells in the pancreas to change their activity.
C: The change in expression of 𝐸𝑠𝑝 changes the insulin receptor activity of the osteoblast.
D: The activation of the osteocalcin by a bone cell is pH dependent.
B: The osteoblasts in the bone secrete osteocalcin, which causes cells in the pancreas to change their activity.
Figure 1. Pathway activated by insulin binding to the insulin receptor
Figure 2: Blood insulin levels in normal mice and 𝐸𝑠𝑝 mutant mice after exposure to glucose
Hormones are chemical signals that are released by cells in one part of the body that travel through the bloodstream to signal cells in another part of the body. Insulin is a hormone that is released by the pancreas that induces the uptake of glucose molecules from the bloodstream into cells. In this way, insulin lowers the overall blood glucose levels of the body. Osteoblasts and osteoclasts are two types of bone cells that play a role in regulating blood glucose levels (Figure 1).
Binding of insulin to the insulin receptor on osteoblasts activates a signaling pathway that results in osteoblasts releasing a molecule, OPG, that binds to neighboring osteoclasts. In response, the osteoclasts release protons (H+) and create an area of lower pH outside the cell. This low pH activates osteocalcin, a protein secreted in an inactive form by osteoblasts.
The 𝐸𝑠𝑝 gene encodes a protein that alters the structure of the insulin receptor on osteoblasts and interferes with the binding of insulin to the receptor. A researcher created a group of osteoblasts with an 𝐸𝑠𝑝 mutation that prevented the production of a functional 𝐸𝑠𝑝 product (mutant). The researcher then exposed the mutant strain and a normal strain that expresses 𝐸𝑠𝑝 to glucose and compared the levels of insulin in the blood near the osteoblasts (Figure 2).
Which of the following best describes the effect of insulin binding to the receptor on the osteoblast cells?
A: Insulin binding ultimately increases pancreatic secretion of additional insulin.
B: Insulin binding blocks the release of osteocalcin from the osteoblasts.
C: Insulin binding inhibits the expression of 𝐸𝑠𝑝.
D: Insulin binding increases the pH of the extracellular matrix.
A: Insulin binding ultimately increases pancreatic secretion of additional insulin.
Figure 1. Pathway activated by insulin binding to the insulin receptor
Figure 2: Blood insulin levels in normal mice and 𝐸𝑠𝑝 mutant mice after exposure to glucose
Hormones are chemical signals that are released by cells in one part of the body that travel through the bloodstream to signal cells in another part of the body. Insulin is a hormone that is released by the pancreas that induces the uptake of glucose molecules from the bloodstream into cells. In this way, insulin lowers the overall blood glucose levels of the body. Osteoblasts and osteoclasts are two types of bone cells that play a role in regulating blood glucose levels (Figure 1).
Binding of insulin to the insulin receptor on osteoblasts activates a signaling pathway that results in osteoblasts releasing a molecule, OPG, that binds to neighboring osteoclasts. In response, the osteoclasts release protons (H+) and create an area of lower pH outside the cell. This low pH activates osteocalcin, a protein secreted in an inactive form by osteoblasts.
The 𝐸𝑠𝑝 gene encodes a protein that alters the structure of the insulin receptor on osteoblasts and interferes with the binding of insulin to the receptor. A researcher created a group of osteoblasts with an 𝐸𝑠𝑝 mutation that prevented the production of a functional 𝐸𝑠𝑝 product (mutant). The researcher then exposed the mutant strain and a normal strain that expresses 𝐸𝑠𝑝 to glucose and compared the levels of insulin in the blood near the osteoblasts (Figure 2).
Which of the following claims is most consistent with the data shown in Figure 2 ?
A: Esp expression is necessary to prevent the overproduction of insulin.
B: Esp protein does not regulate blood-sugar levels in normal mice.
C: Normal mice require a higher blood concentration of insulin than mutant mice do.
D: Mutant mice have a cyclical pattern of insulin secretion.
A: expression is necessary to prevent the overproduction of insulin.
Figure 1. Pathway activated by insulin binding to the insulin receptor
Figure 2: Blood insulin levels in normal mice and 𝐸𝑠𝑝 mutant mice after exposure to glucose
Hormones are chemical signals that are released by cells in one part of the body that travel through the bloodstream to signal cells in another part of the body. Insulin is a hormone that is released by the pancreas that induces the uptake of glucose molecules from the bloodstream into cells. In this way, insulin lowers the overall blood glucose levels of the body. Osteoblasts and osteoclasts are two types of bone cells that play a role in regulating blood glucose levels (Figure 1).
Binding of insulin to the insulin receptor on osteoblasts activates a signaling pathway that results in osteoblasts releasing a molecule, OPG, that binds to neighboring osteoclasts. In response, the osteoclasts release protons (H+) and create an area of lower pH outside the cell. This low pH activates osteocalcin, a protein secreted in an inactive form by osteoblasts.
The 𝐸𝑠𝑝 gene encodes a protein that alters the structure of the insulin receptor on osteoblasts and interferes with the binding of insulin to the receptor. A researcher created a group of osteoblasts with an 𝐸𝑠𝑝 mutation that prevented the production of a functional 𝐸𝑠𝑝 product (mutant). The researcher then exposed the mutant strain and a normal strain that expresses 𝐸𝑠𝑝 to glucose and compared the levels of insulin in the blood near the osteoblasts (Figure 2).
Which of the following was a positive control in the experiment?
A: Minutes after glucose injection
B: Blood insulin
C: Mutant strain
D: Normal strain
D: Normal strain
Figure 1. Pathway activated by insulin binding to the insulin receptor
Figure 2: Blood insulin levels in normal mice and 𝐸𝑠𝑝 mutant mice after exposure to glucose
Hormones are chemical signals that are released by cells in one part of the body that travel through the bloodstream to signal cells in another part of the body. Insulin is a hormone that is released by the pancreas that induces the uptake of glucose molecules from the bloodstream into cells. In this way, insulin lowers the overall blood glucose levels of the body. Osteoblasts and osteoclasts are two types of bone cells that play a role in regulating blood glucose levels (Figure 1).
Binding of insulin to the insulin receptor on osteoblasts activates a signaling pathway that results in osteoblasts releasing a molecule, OPG, that binds to neighboring osteoclasts. In response, the osteoclasts release protons (H+) and create an area of lower pH outside the cell. This low pH activates osteocalcin, a protein secreted in an inactive form by osteoblasts.
The 𝐸𝑠𝑝 gene encodes a protein that alters the structure of the insulin receptor on osteoblasts and interferes with the binding of insulin to the receptor. A researcher created a group of osteoblasts with an 𝐸𝑠𝑝 mutation that prevented the production of a functional 𝐸𝑠𝑝 product (mutant). The researcher then exposed the mutant strain and a normal strain that expresses 𝐸𝑠𝑝 to glucose and compared the levels of insulin in the blood near the osteoblasts (Figure 2).
A researcher observes that mice from the mutant strain experience low blood sugar. Which of the following best describes the feedback mechanism in the pathway (Figure 1) causing the low blood sugar in the mutant strain?
A: The positive feedback of insulin production
B: The negative feedback of inactive osteocalcin production
C: The positive feedback of the Esp protein
D: The negative feedback of insulin-secreting pancreatic cell proliferation
A: The positive feedback of insulin production
A researcher hypothesizes that, in mice, two autosomal dominant traits, trait Q and trait R, are determined by separate genes found on the same chromosome. The researcher crosses mice that are heterozygous for both traits and counts the number of offspring with each combination of phenotypes. The total number of offspring produced was 64. The researcher plans to do a chi-square analysis of the data and calculates the expected number of mice with each combination of phenotypes. Which of the following is the expected number of offspring that will display both trait Q and trait R?
Responses
A: 4
B: 12
C: 36
D: 48
C: 36
Researchers studying new viruses analyzed the genetic material found in four different virus samples to determine the percent nitrogen base composition of each virus. The data are shown in the table.
BASE DISTRIBUTION IN FOUR NUCLEIC ACID SAMPLES |
Nitrogen Base | Percent inSample 1 | Percent inSample 2 | Percent inSample 3 | Percent inSample 4 |
|---|---|---|---|---|
Adenine | 27 | 33 | 21 | 22 |
Cytosine | 23 | 17 | 33 | 28 |
Guanine | 23 | 17 | 27 | 28 |
Thymine | 0 | 33 | 0 | 22 |
Uracil | 27 | 0 | 19 | 0 |
Which of the following samples most likely contains a double-stranded RNA virus?
A: Sample 1
B: Sample 2
C: Sample 3
D: Sample 4
A: Sample 1
Goats and sheep belong to the same family but different genera. While they often live together in the same pastures, the hybrid offspring that are occasionally produced between the two species rarely survive. When such a hybrid does survive, it is usually sterile.
Which of the following best explains the mechanism that maintains reproductive isolation between goats and sheep?
A: Gene flow is prevented because the two species belong to different trophic levels and therefore do not share a food source.
B: Habitat isolation creates a prezygotic barrier between the two species.
C: The males of one species and the females of the other species are fertile at different times.
D: The two species have a different number of chromosomes, resulting in a postzygotic barrier.
D: The two species have a different number of chromosomes, resulting in a postzygotic barrier.
Ethylene gas is an organic molecule that serves many cell signaling roles in flowering plants. Which of the following best explains how a positive feedback mechanism involving ethylene works?
A: Cells of ripening fruit produce ethylene, which activates the ripening response in other fruit cells.
B: Low water stress causes cells to produce ethylene, which binds to root cells and initiates cell division.
C: Cells damaged by leaf-eating insects produce ethylene, which is released into the air, and repels insects.
D: Fertilized ovules produce ethylene, which initiates apoptosis in flower petal cells.
A: Cells of ripening fruit produce ethylene, which activates the ripening response in other fruit cells.
A student is investigating photosynthesis in plants. The student planted grass seeds in a tray with three sections and grew the grass under artificial lights for 14 days (Figure 1). After 14 days, the student collected all of the grass from section I and recorded its mass (Table 1). The student then placed a clear cover over section II and placed an aluminum foil cover over section III (Figure 2). The student then placed the tray back under the artificial lights for seven additional days. On day 21, the student collected and measured the mass of the grass from sections II and III (Table 1).

TABLE 1. MASS OF GRASS GROWN IN EACH SECTION |
Section | Day Mass was Measured | Mass (g) |
|---|---|---|
I | 14 | 5.1 |
II | 21 | 9.6 |
III | 21 | 4.2 |
Based on the data, which of the following is the best approximation of the rate of growth per week in section II from day 14 to day 21 ?
A: 3.2 g/week
B: 4.5 g/week
C: 5.1 g/week
D: 9.6 g/week
B: 4.5 g/week
A student is investigating photosynthesis in plants. The student planted grass seeds in a tray with three sections and grew the grass under artificial lights for 14 days (Figure 1). After 14 days, the student collected all of the grass from section I and recorded its mass (Table 1). The student then placed a clear cover over section II and placed an aluminum foil cover over section III (Figure 2). The student then placed the tray back under the artificial lights for seven additional days. On day 21, the student collected and measured the mass of the grass from sections II and III (Table 1).
TABLE 1. MASS OF GRASS GROWN IN EACH SECTION |
Section | Day Mass was Measured | Mass (g) |
|---|---|---|
I | 14 | 5.1 |
II | 21 | 9.6 |
III | 21 | 4.2 |
Which of the following best explains the observed difference in mass between the grass in section I after 14 days and the grass in section III after 21 days?
A: The grass in section III required more energy for metabolic processes than the grass in section I.
B: The grass in section III performed more photosynthesis than the grass in section I.
C: Only the grass in section III used energy from the seed for growth and development.
D: Mass lost by cell respiration in section III was not replaced by photosynthesis.
D: Mass lost by cell respiration in section III was not replaced by photosynthesis.
A student is investigating photosynthesis in plants. The student planted grass seeds in a tray with three sections and grew the grass under artificial lights for 14 days (Figure 1). After 14 days, the student collected all of the grass from section I and recorded its mass (Table 1). The student then placed a clear cover over section II and placed an aluminum foil cover over section III (Figure 2). The student then placed the tray back under the artificial lights for seven additional days. On day 21, the student collected and measured the mass of the grass from sections II and III (Table 1).
TABLE 1. MASS OF GRASS GROWN IN EACH SECTION |
Section | Day Mass was Measured | Mass (g) |
|---|---|---|
I | 14 | 5.1 |
II | 21 | 9.6 |
III | 21 | 4.2 |
Which of the following best explains the connection between energy, growth, and the maintenance of an ordered system in the experiment?
A: Energy input from light is required for the grass to grow and maintain an ordered structure.
B: The grass obtains the energy for growth and maintenance of order from nutrients from the soil.
C: The grass couples the release of energy from the light reactions with the production of oxygen (O2) used to produce sugars for growth.
D: Energy is required for the growth of the grass but not the maintenance of order.
A: Energy input from light is required for the grass to grow and maintain an ordered structure.
A student is investigating photosynthesis in plants. The student planted grass seeds in a tray with three sections and grew the grass under artificial lights for 14 days (Figure 1). After 14 days, the student collected all of the grass from section I and recorded its mass (Table 1). The student then placed a clear cover over section II and placed an aluminum foil cover over section III (Figure 2). The student then placed the tray back under the artificial lights for seven additional days. On day 21, the student collected and measured the mass of the grass from sections II and III (Table 1).
TABLE 1. MASS OF GRASS GROWN IN EACH SECTION
Section
Day Mass was Measured
Mass (g)
I
14
5.1
II
21
9.6
III
21
4.2
Based on the data, which of the following is the most likely effect of a period of increased volcanic activity that significantly decreases the amount of sunlight reaching a particular ecosystem for several years?
A: There will be a decrease in the population sizes of most species and a decrease in the number of trophic levels.
B: The population sizes of plant species will stay the same, but the average biomass of individual plants will increase.
C: There will be an increase in the population sizes of omnivores because they can eat other animals instead of the plants.
D: The biodiversity of the ecosystem will increase as new niches arise and become occupied by new species.
A: There will be a decrease in the population sizes of most species and a decrease in the number of trophic levels.
A student is investigating photosynthesis in plants. The student planted grass seeds in a tray with three sections and grew the grass under artificial lights for 14 days (Figure 1). After 14 days, the student collected all of the grass from section I and recorded its mass (Table 1). The student then placed a clear cover over section II and placed an aluminum foil cover over section III (Figure 2). The student then placed the tray back under the artificial lights for seven additional days. On day 21, the student collected and measured the mass of the grass from sections II and III (Table 1).
TABLE 1. MASS OF GRASS GROWN IN EACH SECTION
Section
Day Mass was Measured
Mass (g)
I
14
5.1
II
21
9.6
III
21
4.2
Which of the following is an appropriate null hypothesis for the student’s experiment?
A: The absence of light negatively affects the mass of the grass.
B: An increase in light promotes grass growth.
C: A change in light intensity changes the rate of grass growth.
D: The presence of light has no effect on the mass of the grass.
D: The presence of light has no effect on the mass of the grass.
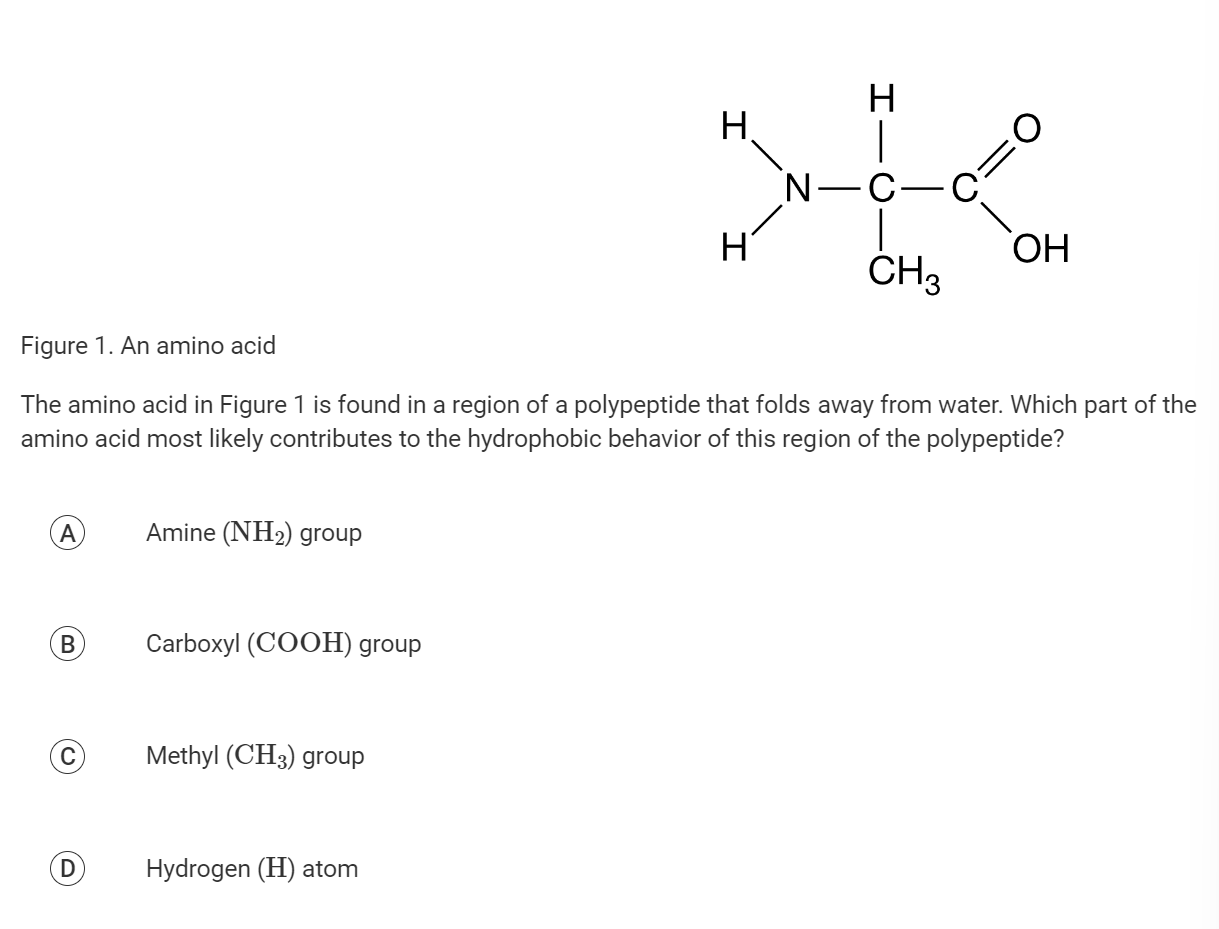
C: Methyl (CH3) group
A researcher observes that when two heterozygous plants with red flowers are crossed, the resulting offspring include plants with red, white, or pink flowers. The researcher proposes the null hypothesis that flower color is the result of independent assortment and incomplete dominance. The researcher calculates a chi-square value of 7.3. Assuming two degrees of freedom, which of the following is the correct interpretation of the chi-square analysis, using a p-value of 0.05 ?
A: The null hypothesis should be rejected because the critical value is less than the calculated value.
B: The null hypothesis should not be rejected because the critical value is less than the calculated value.
C: The null hypothesis should not be rejected because the critical value is greater than the calculated value.
D: The null hypothesis should be rejected because the critical value is greater than the calculated value.
A: The null hypothesis should be rejected because the critical value is less than the calculated value.
A researcher is investigating the effects of a chemical that makes thylakoid membranes permeable to hydrogen ions (H+). Which of the following is the most likely direct effect of adding the chemical to plant cells?
A: The plant cells will produce less NADPH.
B: The chloroplasts will generate less ATP.
C: Chlorophyll will require less light energy to excite its electrons.
D: The plant cells will split fewer water molecules into hydrogen ions and oxygen.
B: The chloroplasts will generate less ATP.

Figure 1. For paired groups of organisms, a comparison of the number of amino acid substitutions in cytochrome 𝑐 with the time since the groups diverged from a common ancestor
Researchers analyzed the amino sequence of the protein cytochrome 𝑐 in various groups of organisms and determined the number of amino substitutions that have occurred in the different groups of organisms. They plotted the data with respect to the time since divergence of the members of paired groups from a common ancestor (Figure 1). Based on the data, which of the following organisms are most distantly related?
A: Birds and mammals
B: Mammals and reptiles
C: Fish and land vertebrates
D: Insects and vertebrates
D: Insects and vertebrates
Which of the following best explains how continuity of genetic information in cells is ensured across generations
A: Replication uses a parental strand of DNA as a template to create a new strand of DNA.
B: DNA molecules are shaped like a double helix with a constant diameter throughout.
C: Transcription copies the information in DNA into an RNA transcript.
D: Cells contain different polymerases for DNA replication and transcription.
A: Replication uses a parental strand of DNA as a template to create a new strand of DNA.
n the spring and summer, the fur of an arctic fox contains a pigment called melanin that gives the fox’s fur a dark color. In the fall and winter, the fur of the arctic fox is white.
Which of the following most likely explains how the changing seasons result in changing fur color in an arctic fox?
A: Environmental factors cause changes in gene expression, resulting in seasonal variations in pigment production.
B: Environmental factors cause different mutations in DNA during different seasons, resulting in seasonal changes in fur phenotype.
C: Environmental factors cause proteins to be translated using different genetic codes during different seasons, resulting in variations in pigment production.
D: Environmental factors cause enzymes to react with different substrates, resulting in the accumulation of different pigments.
A: Environmental factors cause changes in gene expression, resulting in seasonal variations in pigment production.
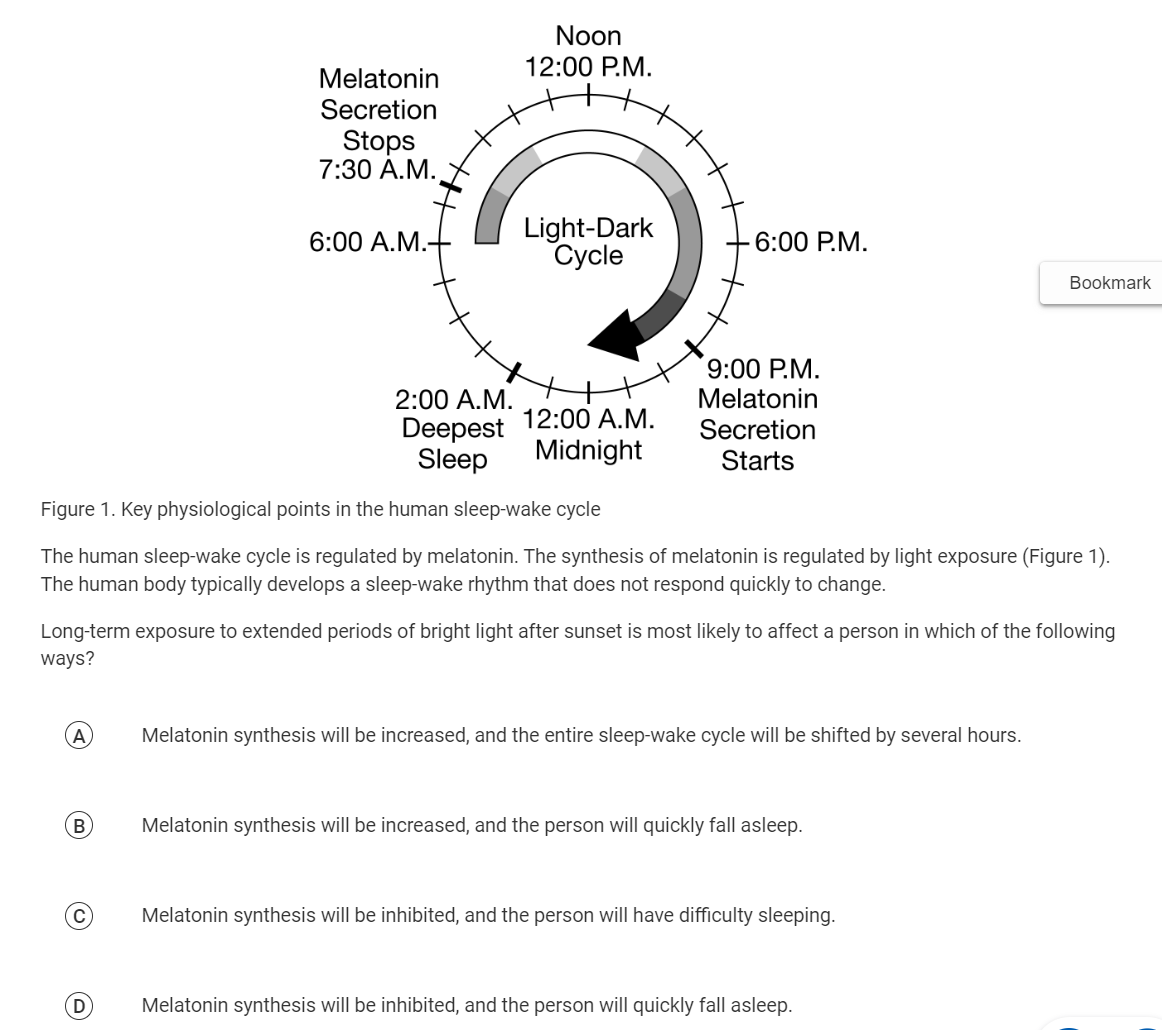
C: Melatonin synthesis will be inhibited, and the person will have difficulty sleeping.
A typical bag of fertilizer contains high levels of nitrogen, phosphorus, and potassium but trace amounts of magnesium and calcium. Which of the following best matches the fertilizer component with the molecule in which it will be incorporated by organisms in the area?
A: Nitrogen will be incorporated into nucleic acids.
B: Phosphorus will be incorporated into amino acids.
C: Potassium will be incorporated into lipids.
D: Magnesium will be incorporated into carbohydrates.
A: Nitrogen will be incorporated into nucleic acids.
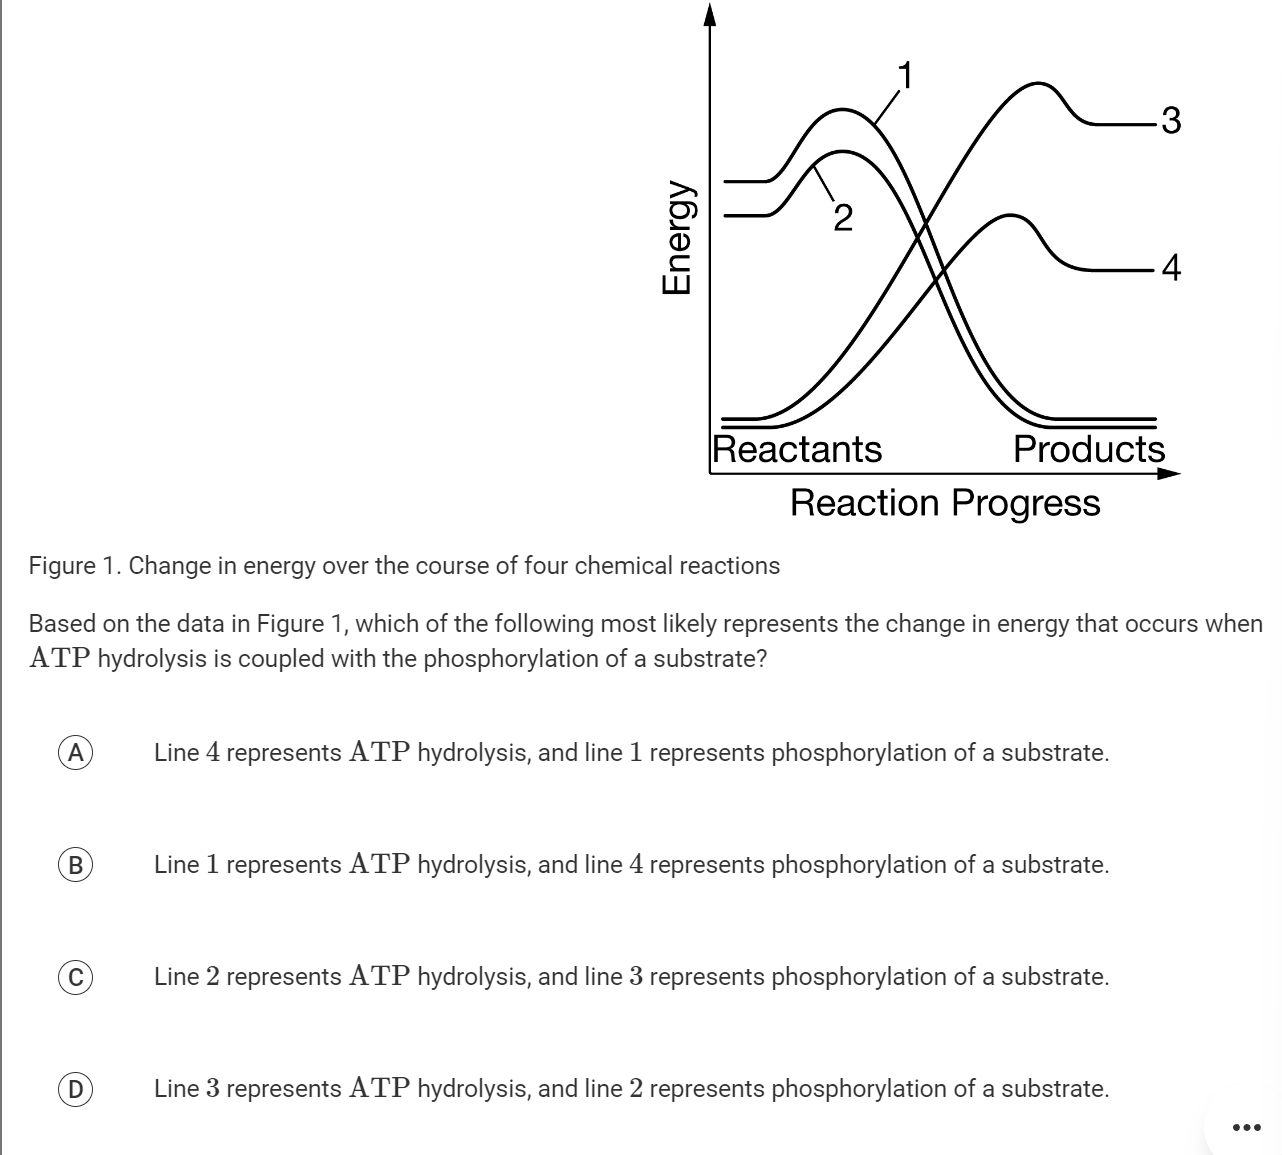
B: Line 1 represents ATP hydrolysis, and line 4 represents phosphorylation of a substrate.
The brown anole (Anolis sagrei) is a species of lizard native to Cuba that has been introduced into the southeastern United States. The range of brown anoles in the United States has been expanding, and they are now competing with native green anoles (Anolis carolinensis). Some of the characteristics of the green and brown anoles are shown in Table 1.
TABLE 1. CHARACTERISTICS OF TWO ANOLE SPECIES |
Anole Species | Body Length | Limb LengthRelative toBody Length | Toe Pad SizeRelative toBody Length | Cold Tolerance |
A. sagrei(brown anole) | 55–80 mm | Long | Intermediate | 30–35°C |
A. carolinensis(green anole) | 45–85 mm | Short | Very large | 25–30°C |
A cladogram showing the relationships between some anole species is shown in Figure 1.

Figure 1. Cladogram of some anole species
A: Brown anoles developed a tolerance for cold temperatures and passed on this acquired tolerance.
B: Brown and green anoles produced a hybrid species that has greater tolerance to cold temperatures.
C: Green anoles with greater tolerance for cold had greater reproductive success in areas with colder temperatures.
D: New mutations occurred in brown anoles in response to exposure to colder temperatures.
C: Green anoles with greater tolerance for cold had greater reproductive success in areas with colder temperatures.
The brown anole (Anolis sagrei) is a species of lizard native to Cuba that has been introduced into the southeastern United States. The range of brown anoles in the United States has been expanding, and they are now competing with native green anoles (Anolis carolinensis). Some of the characteristics of the green and brown anoles are shown in Table 1.
TABLE 1. CHARACTERISTICS OF TWO ANOLE SPECIES |
Anole Species | Body Length | Limb LengthRelative toBody Length | Toe Pad SizeRelative toBody Length | Cold Tolerance |
A. sagrei(brown anole) | 55–80 mm | Long | Intermediate | 30–35°C |
A. carolinensis(green anole) | 45–85 mm | Short | Very large | 25–30°C |
A cladogram showing the relationships between some anole species is shown in Figure 1.
Figure 1. Cladogram of some anole species
In anoles, small toe pads are better for gripping irregular surfaces such as the forest floor, and large toe pads are better for gripping smooth surfaces such as leaves. Based on the data in Table 1, if brown anoles are introduced into a forest where green anoles currently live, which of the following predictions about the two species is most likely?
A: Brown anoles will occupy a different area of the forest from green anoles which will minimize competition.
B: Brown anoles will mostly prey on flying insects, and green anoles will prey on worms and grubs.
C: Brown anoles and green anoles will evolve to have the same size toe pads because they share the same niche.
D: Green anoles are better adapted to the forest habitat and will chase away the introduced brown anoles.
A: Brown anoles will occupy a different area of the forest from green anoles which will minimize competition.
The brown anole (Anolis sagrei) is a species of lizard native to Cuba that has been introduced into the southeastern United States. The range of brown anoles in the United States has been expanding, and they are now competing with native green anoles (Anolis carolinensis). Some of the characteristics of the green and brown anoles are shown in Table 1.
TABLE 1. CHARACTERISTICS OF TWO ANOLE SPECIES |
Anole Species | Body Length | Limb LengthRelative toBody Length | Toe Pad SizeRelative toBody Length | Cold Tolerance |
A. sagrei(brown anole) | 55–80 mm | Long | Intermediate | 30–35°C |
A. carolinensis(green anole) | 45–85 mm | Short | Very large | 25–30°C |
A cladogram showing the relationships between some anole species is shown in Figure 1.
Figure 1. Cladogram of some anole species
Which of the following is the outgroup in the cladogram shown in Figure 1?
A: A. evermanni
B: A. stratulus
C: A. gundlachi
D: A. carolinensis
D: A. carolinensis
The brown anole (Anolis sagrei) is a species of lizard native to Cuba that has been introduced into the southeastern United States. The range of brown anoles in the United States has been expanding, and they are now competing with native green anoles (Anolis carolinensis). Some of the characteristics of the green and brown anoles are shown in Table 1.
TABLE 1. CHARACTERISTICS OF TWO ANOLE SPECIES |
Anole Species | Body Length | Limb LengthRelative toBody Length | Toe Pad SizeRelative toBody Length | Cold Tolerance |
A. sagrei(brown anole) | 55–80 mm | Long | Intermediate | 30–35°C |
A. carolinensis(green anole) | 45–85 mm | Short | Very large | 25–30°C |
A cladogram showing the relationships between some anole species is shown in Figure 1.
Figure 1. Cladogram of some anole species
Based on Figure 1, which of the following would provide the strongest evidence to support a claim that A. valencienni and A. lineatopus are the two anole species most closely related to A. sagrei ?
A: Comparing body structures, such as toe pads and limb length
B: Analyzing homologous DNA sequences among the species
C: Determining which species occupy a similar niche in Cuba
D: Observing which species have mating behaviors most similar to those of A. sagrei
B: Analyzing homologous DNA sequences among the species
The brown anole (Anolis sagrei) is a species of lizard native to Cuba that has been introduced into the southeastern United States. The range of brown anoles in the United States has been expanding, and they are now competing with native green anoles (Anolis carolinensis). Some of the characteristics of the green and brown anoles are shown in Table 1.
TABLE 1. CHARACTERISTICS OF TWO ANOLE SPECIES |
Anole Species | Body Length | Limb LengthRelative toBody Length | Toe Pad SizeRelative toBody Length | Cold Tolerance |
A. sagrei(brown anole) | 55–80 mm | Long | Intermediate | 30–35°C |
A. carolinensis(green anole) | 45–85 mm | Short | Very large | 25–30°C |
A cladogram showing the relationships between some anole species is shown in Figure 1.
Figure 1. Cladogram of some anole species
Based on the cladogram in Figure 1, which of the following conclusions about the evolution of the anole species is most reasonable?
A: Each species evolved in a different location, and all underwent convergent evolution.
B: Each species evolved as a result of different selective pressures.
C: Each species evolved as a result of a genetic bottleneck.
D: Each species evolved by inheriting random mutations from the common ancestor.
B: Each species evolved as a result of different selective pressures.
Beta thalassemia is a disorder caused by mutations in the 𝐻𝐵𝐵 gene. Examination of the HBB protein in an individual with beta thalassemia shows that the protein is missing many amino acids at its carboxyl terminus.
Which of the following is the most likely explanation for how a mutation in the DNA could result in the loss of the carboxyl terminus of the HBB protein?
A: The mutation keeps the 𝐻𝐵𝐵 gene wrapped tightly around histones, preventing transcription of the gene.
B: The mutation changes the promoter sequence of the gene such that different transcription factors initiate transcription of the gene.
C: The mutation changes a codon in the coding region of the 𝐻𝐵𝐵 transcript to a stop codon such that translation terminates earlier than it should.
D: The mutation results in hydrogen bonds between adjacent amino acids instead of covalent bonds, resulting in the production of an unstable protein.
C: The mutation changes a codon in the coding region of the 𝐻𝐵𝐵 transcript to a stop codon such that translation terminates earlier than it should.
A common test for liver function involves sprinkling sulfur powder onto a sample of urine (mostly water with dissolved bodily waste). Sulfur powder sprinkled on a sample from an individual with impaired liver function will sink because the urine contains a high level of bile salts, while the sulfur powder sprinkled on normal urine samples will float.
Which of the following best explains why bile salts cause the sulfur powder to sink?
A: Bile salts decrease the surface tension of the urine sample.
B: Bile salts increase the water potential of the urine.
C: Bile salts increase the density of the urine sample.
D: Bile salts decrease the strength of the covalent bonds within a water molecule.
A: Bile salts decrease the surface tension of the urine sample.
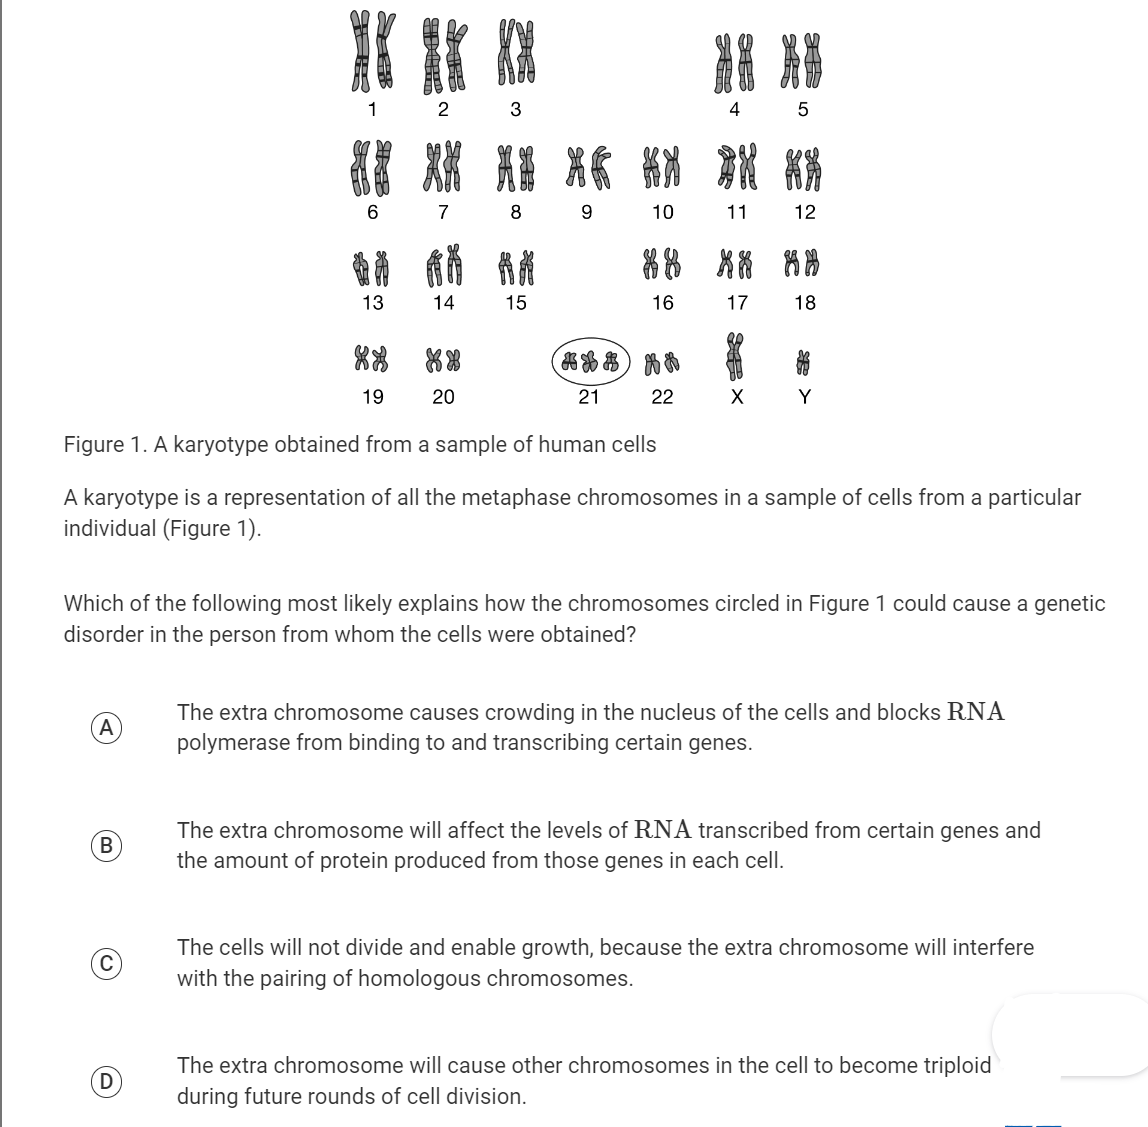
B: The extra chromosome will affect the levels of RNA transcribed from certain genes and the amount of protein produced from those genes in each cell.
Which of the following is the strongest evidence supporting the endosymbiont hypothesis?
A: Mitochondria have their own DNA and divide independently of the cell.
B: Mitochondria can carry out hydrolytic reactions on organic molecules.
C: Mitochondria have a highly folded membrane.
D: Mitochondria are found in both plants and animals.
A: Mitochondria have their own DNA and divide independently of the cell.
Which of the following best explains how the expression of a eukaryotic gene encoding a protein will differ if the gene is expressed in a prokaryotic cell instead of in a eukaryotic cell?
A: No transcript will be made, because eukaryotic DNA cannot be transcribed by prokaryotic RNA polymerase.
B: The protein will have a different sequence of amino acids, because prokaryotes use a different genetic code.
C: The protein will be made but will not function, because prokaryotes cannot remove introns.
D: The protein will not be made, because prokaryotes lack the ribosomes necessary for translation.
C: The protein will be made but will not function, because prokaryotes cannot remove introns.
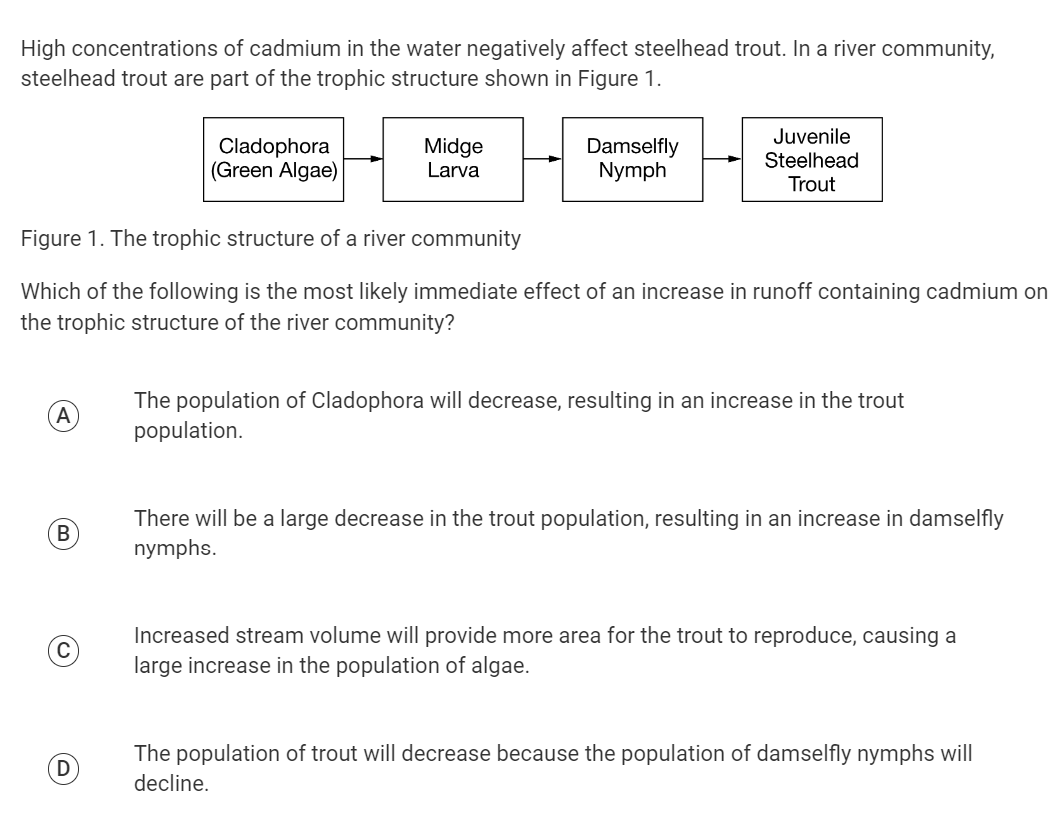
B: There will be a large decrease in the trout population, resulting in an increase in damselfly nymphs.
Poaching is the illegal hunting or capturing of wild animals. Both male and female African elephants have tusks that are a significant source of ivory used for ornaments and jewelry.
Assuming that the size of the tusks is heritable, which of the following is the most likely long-term effect of poachers targeting African elephants with large tusks?
A: An increase in average tusk size because of the need to provide more ivory for the poaching hunters
B: A decrease in average tusk size because elephants with large tusks are less likely to survive to reproduce
C: An increase in average tusk size to provide the elephants with a defensive mechanism against poachers
D: A decrease in average tusk size to reduce the energy investment in the tusks
B: A decrease in average tusk size because elephants with large tusks are less likely to survive to reproduce
A scientist adds a chemical to a culture of dividing cells in order to disrupt DNA replication. The replicated DNA produced by the cells is double-stranded, but sections of it lack covalent bonds between adjacent nucleotides (Figure 1).

Figure 1. Replicated DNA produced after a chemical is introduced
Which of the following claims is best supported by the data?
A: The chemical prevents the formation of RNA primers.
B: The chemical inhibits DNA ligase.
C: The chemical blocks DNA polymerase.
D: The chemical disrupts hydrogen bonding.
B: The chemical inhibits DNA ligase.