Bstats
1/56
Earn XP
Description and Tags
exam 1
Name | Mastery | Learn | Test | Matching | Spaced |
|---|
No study sessions yet.
57 Terms
Which of the following is an example of quantitative data?
the player’s number on a baseball uniform | |
the serial number on a one-dollar bill | |
the part number of an inventory item | |
the number of people in a waiting line |
the number of people in a waiting line
Which of the following is NOT an example of descriptive statistics?
a histogram depicting the age distribution for 30 randomly selected students | |
an estimate of the number of Alaska residents who have visited Canada | |
a table summarizing the data collected in a sample of new-car buyers | |
the proportion of mailed-out questionnaires that were returned |
an estimate of the number of Alaska residents who have visited Canada
Which of the following is an example of categorical data?
social security number | |
score on a multiple-choice exam | |
height, in meters, of a diving board | |
number of square feet of carpet |
social security number
The number of observations in a complete data set having 10 elements and 5 variables is _____.
5 | |
10 | |
25 | |
50 |
10
The entities on which data are collected are _____.
elements | |
populations | |
sets | |
samples |
elements
The set of measurements collected for an element is called a(n) _____.
census | |
variable | |
observation | |
sample |
observation
A characteristic of interest for the elements is called a(n) _____.
sample | |
data set | |
variable | |
observation |
variable
All data collected in a study are referred to as the _____.
census | |
inference | |
variable | |
data set |
data set
In a data set, the number of observations will always be the same as the number of _____.
variables | |
elements | |
data sets | |
data |
elements
Quantitative data _____.
are always nonnumeric | |
may be either numeric or nonnumeric | |
are always numeric | |
are always labels |
are always numeric
Categorical data _____.
are always nonnumeric | |
may be either numeric or nonnumeric | |
are always numeric | |
indicate either how much or how many |
may be either numeric or nonnumeric
Arithmetic operations are inappropriate for _____.
categorical data | |
quantitative data | |
both categorical and quantitative data | |
large data sets |
categorical data
In a questionnaire, respondents are asked to mark their gender as Male, Female, Transgender MtoF, Transgender FtoM, Non-binary, or Intersex. Gender is an example of a(n) _____ variable.
categorical
In a questionnaire, respondents are asked to record their age in years. Age is an example of a _____.
quantitative variable
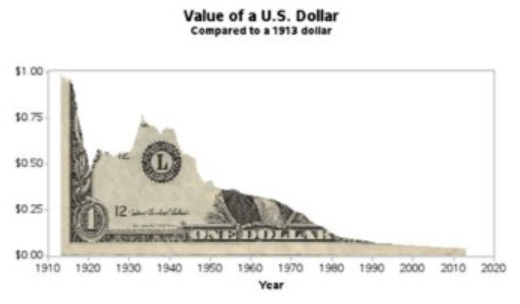
The graph below best exemplifies a _____.
bar graph | |
time series graph | |
cross-sectional graph | |
line graph |
time series graph
The collection of all elements of interest in a study is _____.
the population | |
the sampling | |
statistical inference | |
descriptive statistics |
the population
A portion of the population selected to represent the population is called _____.
statistical inference | |
descriptive statistics | |
a census | |
a sample |
a sample
In a sample of 800 students in a university, 160, or 20%, are Business majors. Based on the above information, the school's paper reported, "20% of all students at the university are Business majors." This report is an example of _____.
a sample | |
a population | |
statistical inference | |
descriptive statistics |
statistical inference
Six hundred residents of a city are polled to obtain information on voting intentions in an upcoming city election. The 600 residents in this study is an example of a(n) _____.
census | |
sample | |
observation | |
population |
sample
A statistics professor asked students in a class their ages. Based on this information, the professor states that the average age of students in the university is 21 years. This is an example of _____.
a census | |
descriptive statistics | |
an experiment | |
statistical inference |
statistical inference
In a recent study based upon an inspection of 200 homes in Daisy City, 120 were found to violate one or more city codes.
Refer to Exhibit 1-1. The Daisy City study is an example of the use of a _____.
census | |
sample | |
probability | |
population |
sample
In a recent study based upon an inspection of 200 homes in Daisy City, 120 were found to violate one or more city codes.
Refer to Exhibit 1-1. The manager's statement that 60% of Daisy City's 3,000 homes are in violation of city codes is _____.
an accurate statement | |
only an approximation, since it is based upon sample information | |
obviously wrong, since it is based upon a study of only 200 homes | |
None of the other answers is correct. |
only an approximation, since it is based upon sample information
In a sample of 3,200 registered voters, 1,440, or 45%, approve of the way the president is doing his job.
Refer to Exhibit 1-2. The 45% approval is an example of _____.
a sample | |
descriptive statistics | |
statistical inference | |
a population |
descriptive statistics
In a sample of 3,200 registered voters, 1,440, or 45%, approve of the way the president is doing his job.
Refer to Exhibit 1-2. A political pollster states, "Forty five percent of all voters approve of the president." This statement is an example of _____.
a sample | |
descriptive statistics | |
statistical inference | |
a population |
statistical inference
The sum of the relative frequencies for all classes will always equal _____.
the sample size | |
the number of classes | |
1 | |
100 |
1
The height and weight are recorded by the school nurse for every student in a school. What type of graph would best display the relationship between height and weight?
bar graph | |
stem-and-leaf plot | |
histogram | |
scatter diagram |
scatter diagram
In a cumulative frequency distribution, the last class will always have a cumulative frequency equal to _____.
1 | |
100% | |
the total number of elements in the data set | |
None of the answers is correct. |
the total number of elements in the data set
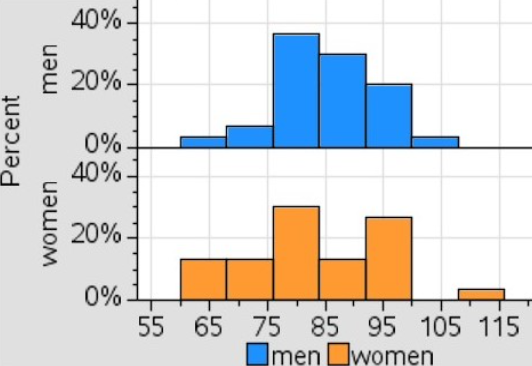
College students were surveyed to determine how much they planned to spend in various categories during the upcoming academic year. One category is the amount spent on school supplies. The graphs below show the amount of money spent on school supplies by women and men.
5
The numbers of hours worked (per week) by 400 statistics students are shown below.
| Number of Hours | Frequency |
| 0x10 | 20 |
| 10x20 | 80 |
| 20x30 | 200 |
| 30x40 | 100 |
Refer to Exhibit 2-1. The class width for this distribution _____.
is 10
The numbers of hours worked (per week) by 400 statistics students are shown below.
| Number of Hours | Frequency |
| 0x10 | 20 |
| 10x20 | 80 |
| 20x30 | 200 |
| 30x40 | 100 |
Refer to Exhibit 2-1. The number of students working less than 20 hours is _____.
100
The numbers of hours worked (per week) by 400 statistics students are shown below.
| Number of Hours | Frequency |
| 0x10 | 20 |
| 10x20 | 80 |
| 20x30 | 200 |
| 30x40 | 100 |
Refer to Exhibit 2-1. The relative frequency of students working less than 10 hours is _____.
0.05
The numbers of hours worked (per week) by 400 statistics students are shown below.
| Number of Hours | Frequency |
| 0x10 | 20 |
| 10x20 | 80 |
| 20x30 | 200 |
| 30x40 | 100 |
Refer to Exhibit 2-1. The cumulative relative frequency for the class of 20
≤ x ≥ 30 is _____.
0.75
The numbers of hours worked (per week) by 400 statistics students are shown below.
| Number of Hours | Frequency |
| 0x10 | 20 |
| 10x20 | 80 |
| 20x30 | 200 |
| 30x40 | 100 |
Refer to Exhibit 2-1. The percentage of students working between 10 and 20 hours is _____.
20%
The numbers of hours worked (per week) by 400 statistics students are shown below.
| Number of Hours | Frequency |
| 0x10 | 20 |
| 10x20 | 80 |
| 20x30 | 200 |
| 30x40 | 100 |
Refer to Exhibit 2-1. The percentage of students working less than 20 hours is _____.
25%
The numbers of hours worked (per week) by 400 statistics students are shown below.
| Number of Hours | Frequency |
| 0x10 | 20 |
| 10x20 | 80 |
| 20x30 | 200 |
| 30x40 | 100 |
Refer to Exhibit 2-1. The cumulative percent frequency for the class of 30 to 40 is _____.
100%
The numbers of hours worked (per week) by 400 statistics students are shown below.
| Number of Hours | Frequency |
| 0x10 | 20 |
| 10x20 | 80 |
| 20x30 | 200 |
| 30x40 | 100 |
Refer to Exhibit 2-1. The cumulative frequency for the class of 20 to 30 is _____.
300
The numbers of hours worked (per week) by 400 statistics students are shown below.
| Number of Hours | Frequency |
| 0x10 | 20 |
| 10x20 | 80 |
| 20x30 | 200 |
| 30x40 | 100 |
Refer to Exhibit 2-1. If a cumulative frequency distribution is developed for the above data, the last class will have a cumulative frequency of _____.
400
The numbers of hours worked (per week) by 400 statistics students are shown below.
| Number of Hours | Frequency |
| 0x10 | 20 |
| 10x20 | 80 |
| 20x30 | 200 |
| 30x40 | 100 |
Refer to Exhibit 2-1. The percentage of students who work at least 10 hours per week is _____.
95%
The correlation coefficient ranges from which two values?
0 and 1 | |
−1 and +1 | |
minus infinity and plus infinity | |
1 and 100 |
-1 and +1
Let r be the correlation coefficient. If r = 0.5 for data set A and r = 0.8 for data set B, which of the following is true?
The variables in B are more strongly correlated than the variables in A. | |
The two data sets have the same level of correlation. | |
The variables in A are more strongly correlated than the variables in B. | |
None of the answers is correct. |
the variables in B are more strongly correlated than the variables in A.
What would be the most appropriate way to measure the central location for the following data: 30, 25, 27, 31, 28, 29, 30, 27, 27, 1000. Hint: observe the extreme value in the data.
mean | |
range | |
variance | |
median |
median
The variance of the exam grades for BE251-01 is 14, while the variance is 18 for BE251-02. Which class has more dispersed grades?
None of the answers is correct. | |
They are equally dispersed | |
BE251-01 | |
BE251-02 |
BE251-02
The median of a sample will always equal the _____.
mode | |
mean | |
50th percentile | |
All of the answers are correct. |
50th percentile
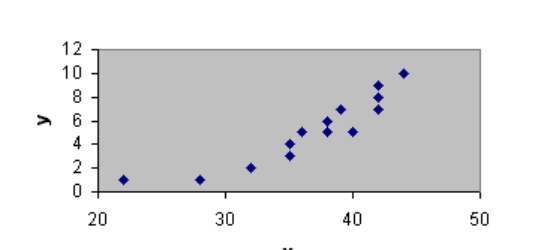
What relationship between x and y can you observe?
A positive relationship | |
A negative relationship | |
No relationship | |
None of the above |
a positive relationshi
A researcher has collected the following sample data.
| 5 | 12 | 6 | 8 | 5 |
| 6 | 7 | 5 | 12 | 4 |
Refer to Exhibit 3-1. The 25th percentile is _____.
5
A researcher has collected the following sample data.
| 5 | 12 | 6 | 8 | 5 |
| 6 | 7 | 5 | 12 | 4 |
Refer to Exhibit 3-1. Suppose the 25th percentile is calculated to be 5. What does it mean?
25% percent of data
A researcher has collected the following sample data.
| 5 | 12 | 6 | 8 | 5 |
| 6 | 7 | 5 | 12 | 4 |
Refer to Exhibit 3-1. The median is _____.
6
A researcher has collected the following sample data.
5 12 6 8 5
6 7 5 12 4
Refer to Exhibit 3-1. The mode is _____.
5
A researcher has collected the following sample data.
| 5 | 12 | 6 | 8 | 5 |
| 6 | 7 | 5 | 12 | 4 |
Refer to Exhibit 3-1. The mean is _____.
7
A researcher has collected the following sample data.
| 5 | 12 | 6 | 8 | 5 |
| 6 | 7 | 5 | 12 | 4 |
Refer to Exhibit 3-1. The 1st quartile is _____.
5
A researcher has collected the following sample data.
| 3 | 5 | 12 | 3 | 2 |
Refer to Exhibit 3-2. The variance is _____.
16.5
A researcher has collected the following sample data.
| 3 | 5 | 12 | 3 | 2 |
Refer to Exhibit 3-2. The standard deviation is _____.
4.062
A researcher has collected the following sample data.
| 3 | 5 | 12 | 3 | 2 |
Refer to Exhibit 3-2. The range is _____.
10
A researcher has collected the following sample data.
| 3 | 5 | 12 | 3 | 2 |
Refer to Exhibit 3-2. The coefficient of variation is _____.
0.81
A numerical measure computed from a sample, such as sample mean, is known as a _____.
population parameter | |
sample parameter | |
population statistic | |
sample statistic |
sample statistic
A numerical measure, such as a mean, computed from a population is known as a _____.
population parameter | |
sample parameter | |
population statistic | |
sample statistic |
population parameter
The coefficient of variation is
the same as the variance | ||
| ||
| ||
the square root of the variance |
the standard deviation deviation by the mean