APES final
1/36
There's no tags or description
Looks like no tags are added yet.
Name | Mastery | Learn | Test | Matching | Spaced |
|---|
No study sessions yet.
37 Terms
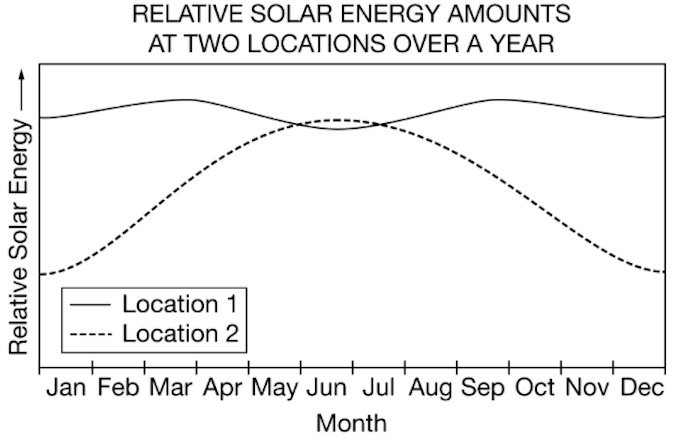
The graph shows the relative solar energy received at local noon each day of the year at two different locations.
Location 1 is most likely located in which of the following terrestrial biomes?
Tropical rain forest
The underlying subsoil of this biome is permafrost, which prevents both water draining through and deep-rooted plants from growing. Additionally, there is very little precipitation per year.
Tundra
The thick forest of this biome tends to be well adapted to short growing seasons.
Taiga

Which environment is most likely to be characterized by dry scrub with frequent fires?
C
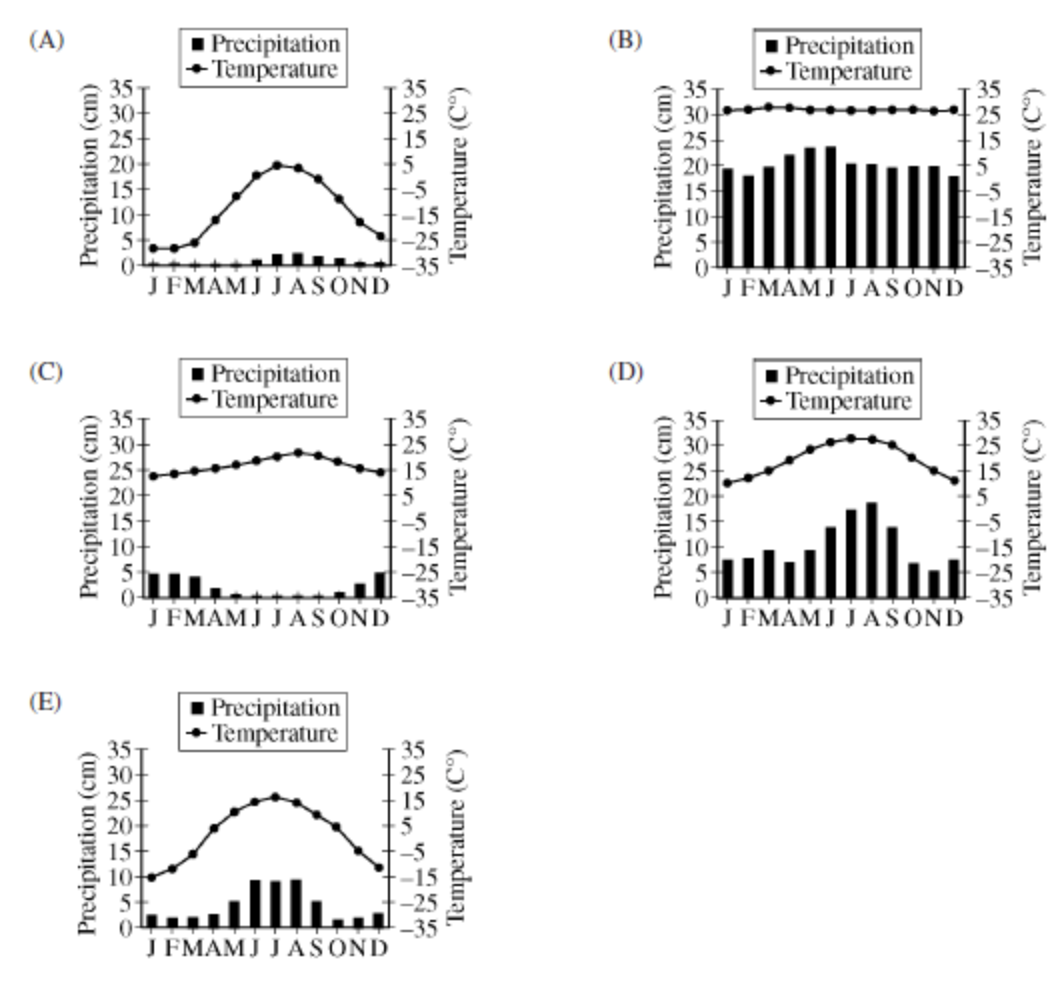
Which environment is characterized by the highest diversity of tree species?
B

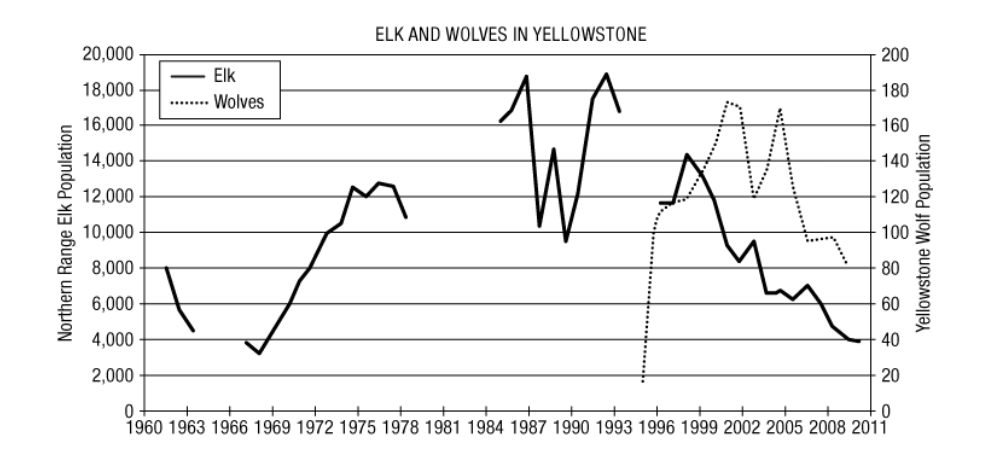
Wolves were reintroduced into Yellowstone National Park in 1995. In addition to tracking changes in the wolf population, scientists were interested in how the wolves would affect other parts of the Yellowstone ecosystem. In particular, they were interested in changes to the population of elk, the wolves' primary prey. The graph below shows the population size of the wolf and elk populations over time.
Which of the following best describes the change in the elk population since the introduction of wolves into Yellowstone in 1995?
The elk population steadily decreased in numbers.
Wolves were reintroduced into Yellowstone National Park in 1995. In addition to tracking changes in the wolf population, scientists were interested in how the wolves would affect other parts of the Yellowstone ecosystem. In particular, they were interested in changes to the population of elk, the wolves' primary prey. The graph below shows the population size of the wolf and elk populations over time.
Which of the following is a potential disadvantage of reintroducing wolves to Yellowstone?
Wolves leaving the park may prey on livestock in grazing land outside the park.

Wolves were reintroduced into Yellowstone National Park in 1995. In addition to tracking changes in the wolf population, scientists were interested in how the wolves would affect other parts of the Yellowstone ecosystem. In particular, they were interested in changes to the population of elk, the wolves' primary prey. The graph below shows the population size of the wolf and elk populations over time.
Based upon the data presented in the graph, which of the following best identifies the highest wolf population size?
170
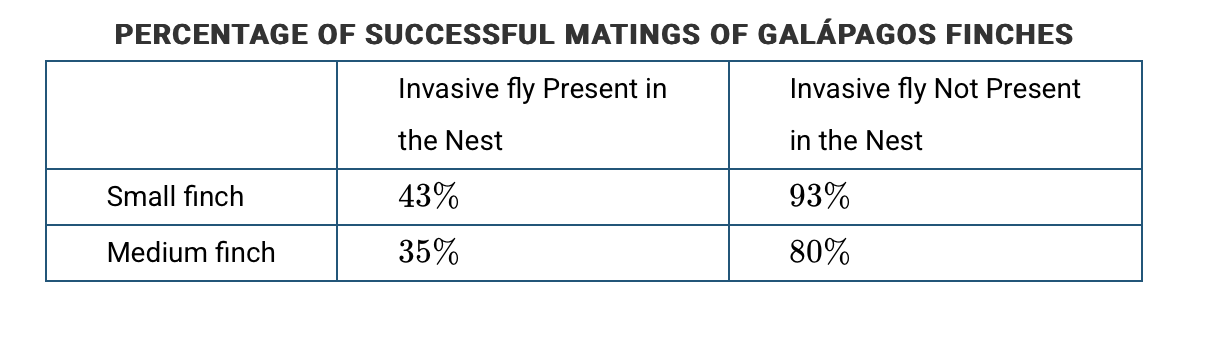
In 1960, an invasive fly was introduced to the Galapagos islands.To understand the relationship between the invasive fly and the tree finches that live on the island, researchers examined the mating success of two species of finches. Some finches had nests with flies and some did not. The data from the study are in the table.
Based on the table, which of the following claims about the relationship between the tree finch and the invasive fly is best supported?
The flies and finches have a parasitic relationship; the finches provide a home for the fly, and the fly decreases the breeding success of the finches.
Primary producers in a lake ecosystem store approximately 25,000 kcal/m?/yr of energy in their biomass. Which of the following identifies the most likely amount of energy available to a tertiary consumer in this ecosystem?
25 kcal/m²/yr
Which of the following is the primary energy source for producers in near-surface marine communities?
Solar energy from the Sun
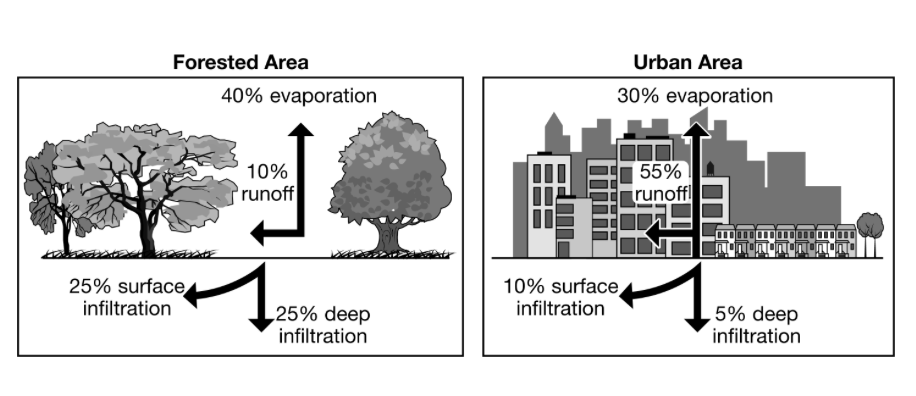
Which of the following processes shown in the diagram leads to precipitation?
Evaporation rate
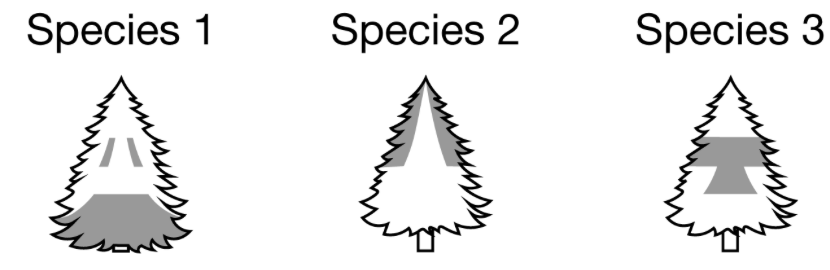
The shaded regions in the diagram below show where different species of warblers, a type of bird, hunt for insects in the same tree.
Which of the following interactions between the warbler species is shown in the diagram?
Resource partitioning
The great grasslands of the world have which of the following primary characteristics in common?
Seasonal cycles of temperature and precipitation produce abundant vegetative
Which of the following is a characteristic of tropical rain forests?
Their soils typically have a high pH.
Which of the following best describes the process of leaching?
Water percolating through soil, dissolving some of its material
This biome has the highest net primary productivity, in part because of consistently warm temperatures and abundant sunlight.
Tropical rainforest
Which of the following best shows the process of evolution?
A population of mosquitoes develops resistance to a pesticide.
The consumption of mosquitoes by bats and the control of flooding provided by tropical forests in mountainous areas of Central America are examples of
ecosystem services
Which of the following best explains how environmental stressors, such as wildfires, can affect biodiversity in an ecosystem?
Ecosystems with more species diversity are more likely to recover after a disturbance than ecosystems with low species diversity.
Which of the following correctly describes the disruption of an ecosystem service by an anthropogenic activity?
Provisioning services are disrupted by increased combustion of fossil fuels, which leads to an increase in air pollution.
Directions: Each of the questions or incomplete statements below is followed by five suggested answers or completions. Select the one that is best in each case.
A one-hectare pond is sampled in early September. The sample yields 1 small catfish as well as 17 benthic invertebrates that represent 10 species.
Which of the following can be estimated from the sample for the invertebrates in the pond?
The species richness
In North America, native pollinators often increase the quantity and quality of crops of native plants that are insect pollinated more effectively than European honeybees do. The most likely reason for the phenomenon is that native pollinators
have coevolved with native plant species
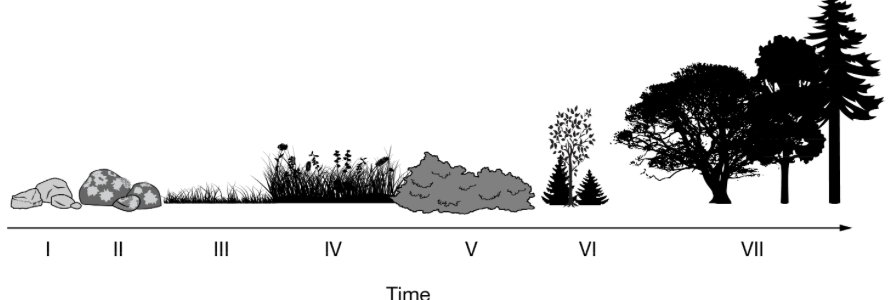
The diagram below shows the change in an ecosystem over time.Which of the following best identifies and describes the process that is illustrated in the diagram above?
Primary succession, because the process in the diagram begins with bare rock.

The diagram below shows the change in an ecosystem over time.Which of the following best describes the role of moss in the transition to stage III of the process?
It breaks down rock and adds organic nutrients to the soil.
The Devils Hole pupfish is one of the world's rarest fishes, spending most of its life in the top few meters of very warm waters of a cavern located in the middle of the Mojave Desert. Devils Hole, a geologic pool, is the only naturally occurring habitat for the endangered Devils Hole pupfish. This fish's habitat is one of the smallest natural ranges known for any vertebrate. Devils Hole is an extreme environment, with water temperatures and dissolved oxygen concentrations near the lethal limits for most fish species.
Which of the following statements best explains why the Devils Hole pupfish are able to live in this environment?
The pupfish are well adapted to the habitat of Devils Hole and can thrive in conditions that are outside of the range of tolerance for most other species.
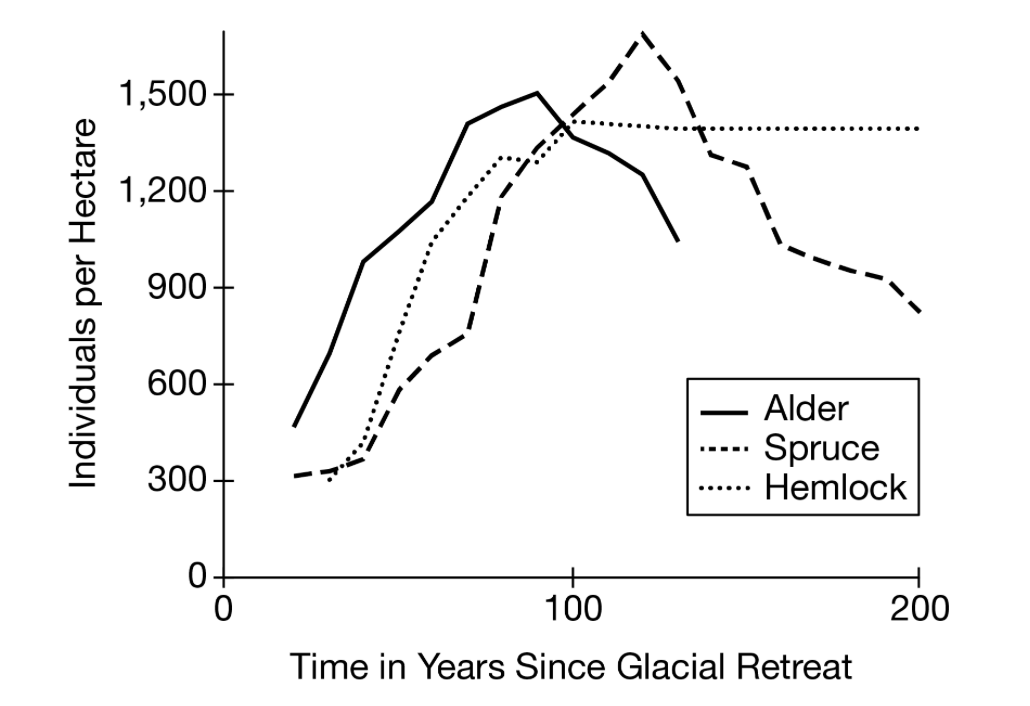
The graph below shows data about three tree species after a glacial retreat.Based on the data shown in the graph, which of the following events occurred after the glacial retreat?
Primary succession

Based on the data shown in the graph, which of the following best describes how ecologists could determine when this ecosystem is approaching a climax community?
Record the number and type of producers present every year after the eruption
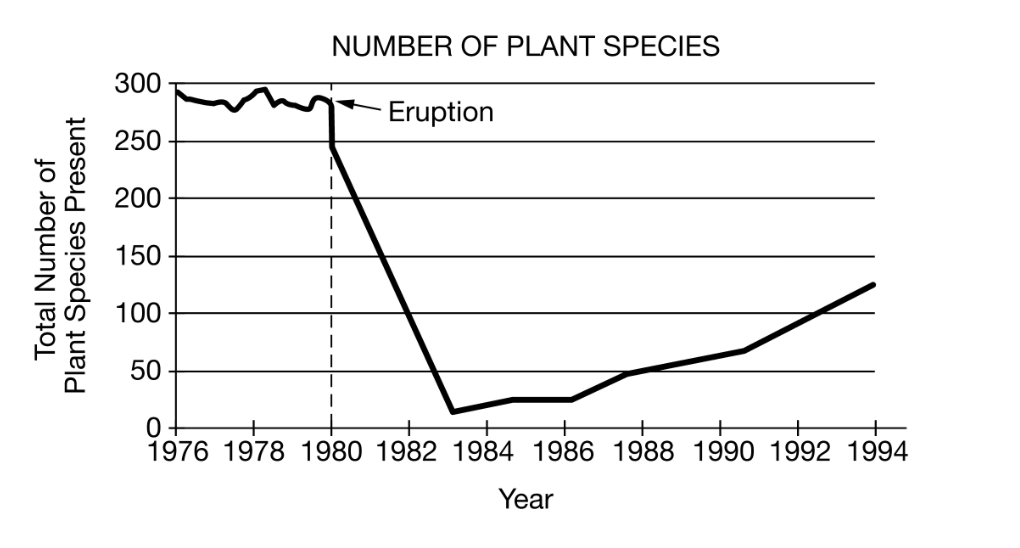
Based on the data shown in the graph, when would the species richness of the ecosystem have been the lowest?
Four to ten years after the volcanic eruption
A North Carolina timber company proposes to clear-cut 45 hectares of oak-hickory deciduous forest in the Appalachian Mountains. The company has said that the forest will regrow naturally, and 50 years after the clear-cutting the company plans to harvest again, cutting all the oaks and hickories that have at least a 40-centimeter diameter. A local citizens' group claims that this is not a realistic plan. Which of the following, if true, best supports the claim of the citizens' group?
Oak and hickory are late-successional species; pioneer species will dominate for many decades before the oaks and hickories are reestablished.
Living organisms must acquire energy from their environment. Examples of adaptations that help organisms acquire this energy include which of the following?
I. The dark, heat-absorbing coloration of a reptile.
II. The fangs and claws of a lion
Ill. The light coloration of a peppered moth
I and II only
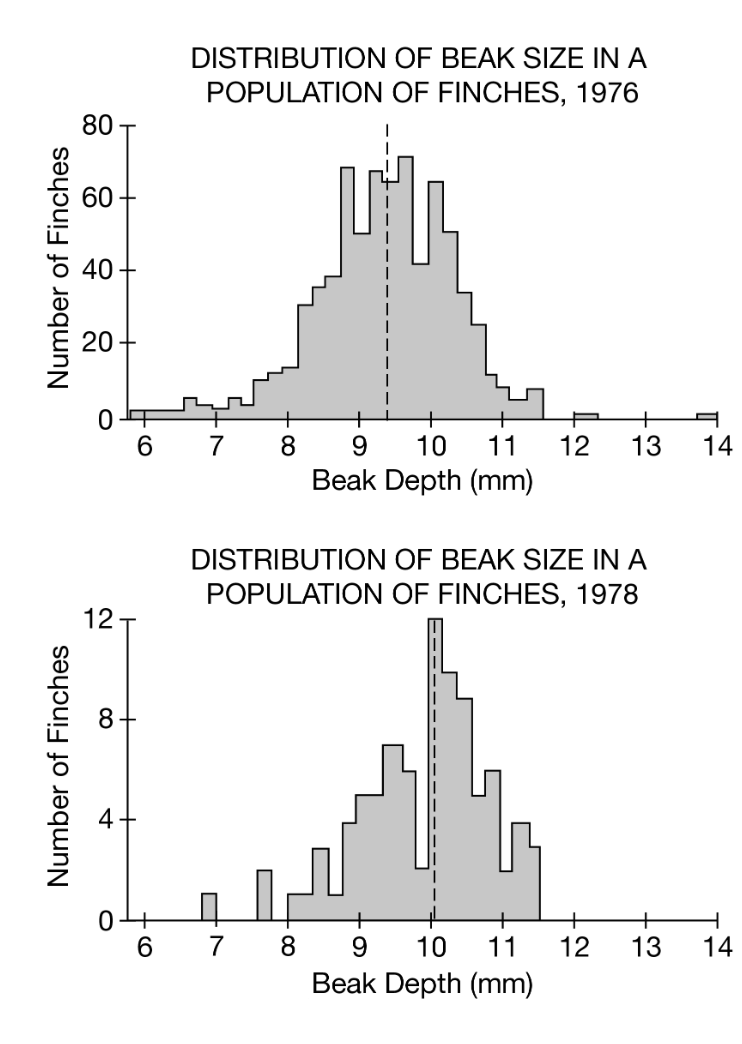
The graphs above show the population size and distribution of beak sizes in a finch population on the island of Daphne Major in the Galapagos in 1976 and 1978. Smaller-beaked finches are better suited for eating grasses and small seeds. Larger-beaked finches are better suited for cracking larger seeds and nuts. In 1977 a drought took place and the vegetation of the island was affected by the lack of rain. Which of the following statements best explains the changes in the size and composition of the population of finches after the drought?
The total number of finches in the population decreased, and the larger-beaked finches were more successful in the drier environment.

The graphs above show the population size and distribution of beak sizes in a finch population on the island of Daphne Major in the Galapagos in 1976 and 1978. Smaller-beaked finches are better suited for eating grasses and small seeds. Larger-beaked finches are better suited for cracking larger seeds and nuts. In 1977 a drought took place and the vegetation of the island was affected by the lack of rain.
Which of the following was the number of finches in the population with a beak size of 10.2 mm in 1978?
12
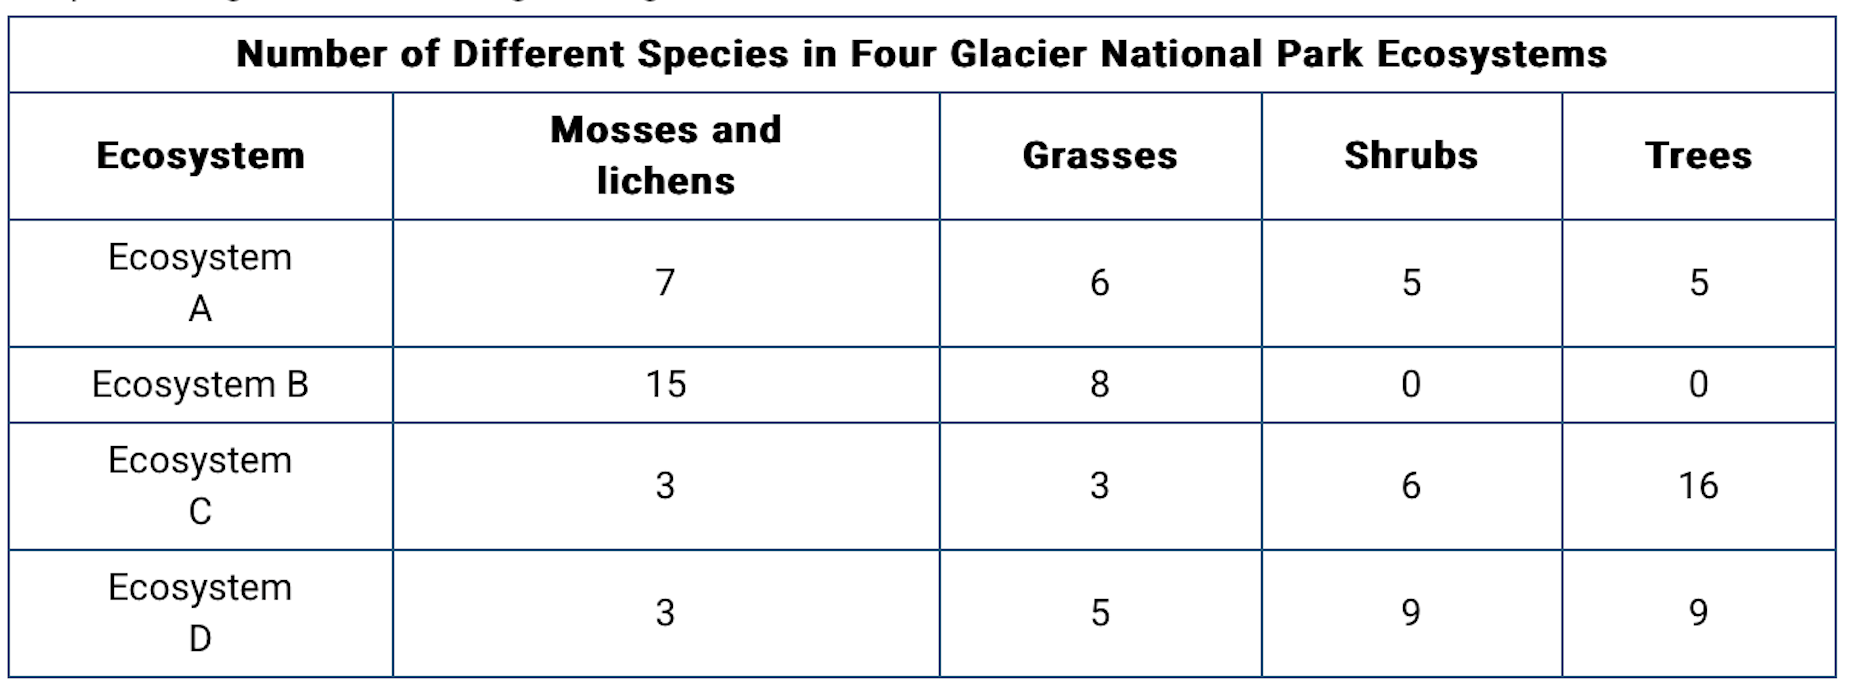
The data table below shows plant biodiversity of different ecosystems in Glacier National Park. In parts of the park, the glacier is receding leading to succession.Based on the data in the table, which ecosystem is in the earliest stages of succession?
Based on the data in the table, which ecosystem is in the earliest stages of succession?
Ecosystem B
The Chatham Island robin is a small endangered bird found in scrub forests off the coast of New Zealand.
The robin is preyed upon by introduced species such as cats and rats. In 1980, the population decreased to only 5 individuals and every individual today is a descendant of a single female.
Which of the following is best illustrated in the decline of the Chatham Island robins?
Population bottleneck
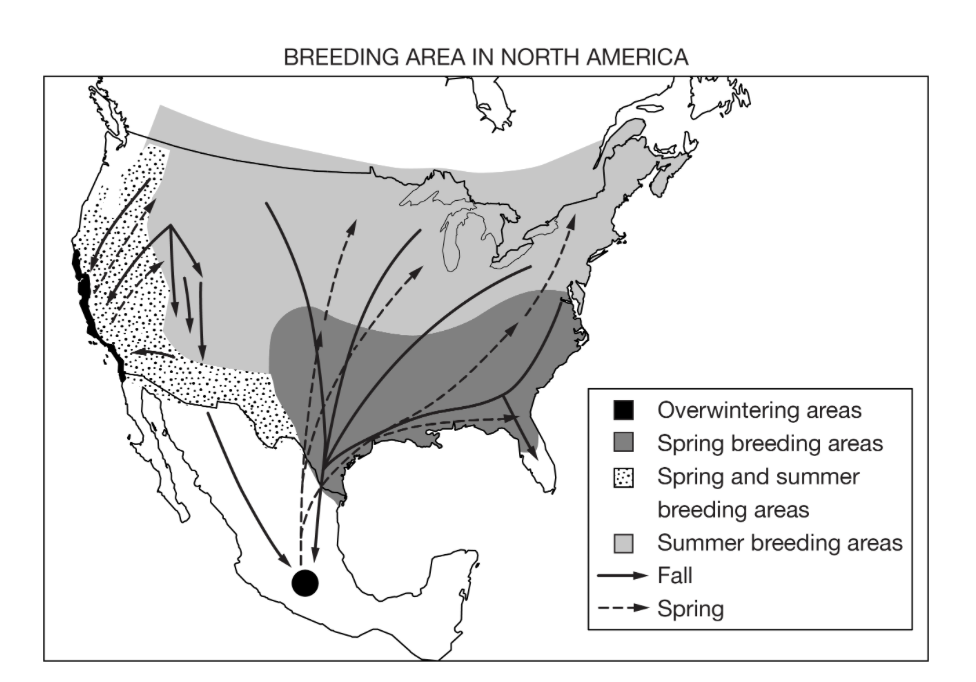
Which of the following explanations is best supported by the data shown in the map above?
Animals migrate seasonally to mate and to find food in different habitats.