Psychological Statistics Exam 2
1/35
There's no tags or description
Looks like no tags are added yet.
Name | Mastery | Learn | Test | Matching | Spaced | Call with Kai |
|---|
No analytics yet
Send a link to your students to track their progress
36 Terms
inferential statistics
help us test hypotheses by evaluating the likelihood that the results we found in the sample can be generalized to the population that we’re interested in—-in other words, that our sample results reflect a real effect in the population too
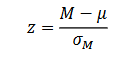
z-test
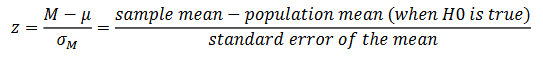
A z-test compares the sample mean (after treatment) to the population mean (without treatment) to assess the likelihood of a result being due to sampling error. It forms a ratio of the difference (numerator) to the standard error (denominator), indicating the significance of the difference relative to chance.
significant result
If a result has less than a 5% chance of occurring due only to sampling error (that is, when there is no treatment effect at all)
non-significant result
if a result has more than a 5% chance of occurring because of sampling error alone, then we are not confident enough that the results reflect a real treatment effect
±1.96
the probability of obtaining a z-test result more extreme than____just due to sampling error is 5%
Research Question
states the question we hope to answer with our sample data. When we start out, our ____ might be framed in general terms
hypothesis
An idea that you can test against data. Step 1 of testing a ____ is stating our ____
alternative hypothesis
the hypothesis that there is a real effect in the population. It is denoted by the symbol H1. Essentially the research question, framed as a positive prediction. Before we conduct a study, we have not yet demonstrated that an effect exists.
Null Hypothesis
The lack of an effect is our starting point. Until we demonstrate otherwise, we don’t have evidence for the effect and must assume that the effect doesn’t exist. Denoted by the symbol H0
non-directional hypothesis
we are not officially specifying the direction the results will go. We are only specifying that there will be a change of some kind
Step 2 of Testing a Hypothesis
Set our critical value. We need to determine the dividing line between results that support our alternative hypothesis and results that do not.
the most common cut-off
the result has less than a 5% probability of occurring by chance alone is too odd
alpha level
the exact proportion of the least likely values that we will accept as evidence that the null hypothesis is actually false. Denoted by the Greek symbol alpha or α. We usually put the alpha in proportion rather than percent terms
Critical Regions
the five percent of least likely samples where we get an extreme result is broken into two equal shaded areas, one on the left and one on the right. Each contains half of the five percent (2.5% each)

Critical Value
The exact line separating the critical regions from the rest of the curve. In a normal distribution, the most extreme 5% of scores fall beyond ±1.96 standard deviations of the mean
Step 3 of Testing a Hypothesis
Turn our raw data into a z-score that we can then compare to our critical value. See how this compares to the kind of sample result we might get by chance
Observed Difference in Our Data
In the numerator of the z score formula, we will compare our treated sample mean M to the population mean μ when there is no treatment effect. This will tell us how far from a zero difference we are.
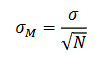
Expected Difference by Chance
In the denominator of the z score formula, we will drop in the standard error to see how far from a zero difference we typically get just by chance alone
reject the null hypothesis
we find it unreasonable that our results could simply occur by chance. Instead, we have found support for our own hypothesis (research). We also declare our finding statistically significant
fail to reject the null hypothesis
we find it reasonable that our results could simply be chance, and the evidence for our alternative hypothesis is not strong enough. We also declare our finding statistically non-significant
How do you determine if your results are significant or not?
You determine whether your statistic exceeds the critical value. If your standard for significance is “less than 5% likelihood” then whether you pass that cutoff or not is all that matters
p-value
Imagine that the treatment has absolutely no effect on the outcome (the null hypothesis is true) With no treatment effect at all, what is the probability of getting a result that is uncommon enough (less than 5%) that would reject the null hypothesis
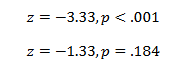
APA results statement
Starts by reporting the calculated value of your statistic, and then the p-value associated with that statistic.
Setting your alpha level determines…
how tough your standard is for being able to claim that you have found support for your hypothesis. The lower your alpha level, the higher your standard
Type I error
claiming to find an effect that is not really there, a false positive, when we reject the null hypothesis when the null hypothesis is true
Type II error
failing to find a real effect that does exist, the researcher fails to reject a null hypothesis that is false, a false negative
Replication
repeating a research study under similar conditions, can help root out Type I errors because the more often you find the same results with different samples and in different laboratories, the less likely it is that all those findings are Type I errors
beta
the probability of making a Type II error, you can’t simply set it wherever you like
Univariate Analysis
Good for testing differences, looks for differences between levels of one (or more) independent variables on a single dependent variable
Multivariate Analysis
Good for testing relationships, look for relationships between multiple continuous variables, where one variable represents the thing we’re studying
one-sample t-test
allows us to test the hypothesis that a population mean is different from a particular value set by our null hypothesis when we do not have a population standard deviation
degrees of freedom
the number of pieces of information you have (N) minus the number of population parameters you are trying to estimate (usually 1)
non-directional hypothesis test/two-tailed test
we are not predicting a particular direction for our results, the critical region is divided into the two tails of the distribution
directional hypothesis test/one-tailed test
specifying the expected direction of the results, we don’t need to split the critical region in half
difference score
to examine differences in scores between the same variable