Visual Computing - Volume Rendering
1/16
There's no tags or description
Looks like no tags are added yet.
Name | Mastery | Learn | Test | Matching | Spaced |
|---|
No study sessions yet.
17 Terms
Volume rendering
Rendering data where we don’t have explicit surfaces
Most familiar example of volume rendering
Computed Axial Tomography (CAT scan)
Hounsfield unit
Standardised way to measure radiodensity in CT scans
Important point about CAT scans
No classification data. Data returned from the CAT scan is just radiodensity and we can use Hounsfield scale to convert.
Transfer function
Relating value in dataset to visuals
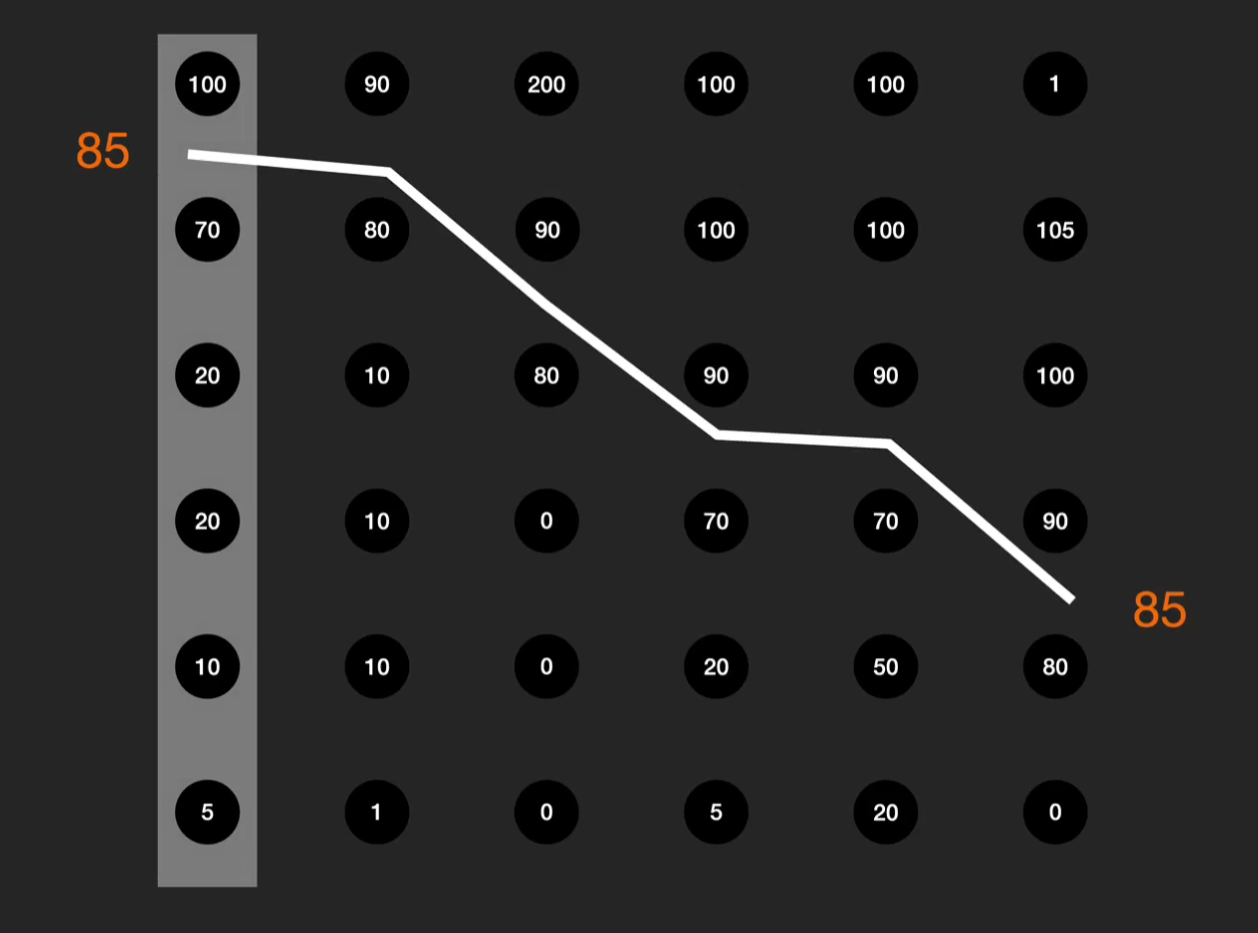
How to do more sophisticated direct volume rendering
Raycast. Fire ray from pixel on viewpoint into the volume. March along the ray in tiny steps and look at the colour and opacity associated with the voxel. Accumulate the opacity and colour. Repeat process.
Unlike raytracing. Single ray, not tracing path
Basic algorithm of direct volume rendering
Step 1: Apply a transfer function to classify data points and give them a colour and alpha value
Step 2: Raycast through the viewplane to determine the colour of each pixel.
Additive reprojection
“Reversing the process” of a CAT scanner. Name of the direct volume rendering algorithm.
Making fake “surfaces” on our voxel structure
Create fake surface normals from the data by interpreting the changes in the voxel value over 3 different dimensions.
Direction should vary smoothly.
Can then plug into local illumination calculations.
Isoline
Line that represents a constant value. Most familiar with contour line on a map—isoline representing constant height
Finding an isoline in two dimensions
Trace where the line is along the points. We can then classify objects/materials at opposite sides of the line
Isosurface
3D equivalent of the 2D isoline
Purpose of using an isosurface
Find the surface that differentiates between two different types of artefact in our data.
Algorithm for finding an isosurface
Marching cubes.
For every set of 8 data points, determine what combination of triangles contributes to the overall surface that separates out the two types of data points.
Marching cubes algorithm explanation
v = f(x,y,z). Gives some point in 3D space and gives a single value.
Use that function to sample function at regular intervals inside a given space
Surface level is the threshold for the values. Points below surface level are “empty space”.
We simplify all cubes points inside the volume to a single cube - 8 corner points inside. Triangulation configurations for those points that are active. Interpolate based on value and how close the value is to the surface value for a smoother surface.
Proxy geometry
Imagine a stack of glass panes. The colours from the voxels are being splattered like paint. Small number of polygons with a particular texture.
Mapping between volume and texture coordinates for proxy geometry
Use barocentric interpolation—weighted distance from the vertices of the triangle to give the coordinate in the triangle.
Map with linear interpolation to give RGBA value.