ALL CORE PRACTICALS
1/18
There's no tags or description
Looks like no tags are added yet.
Name | Mastery | Learn | Test | Matching | Spaced |
|---|
No study sessions yet.
19 Terms
CP 01 - Effect of caffeine on heart rate in Daphnia
Method
1) Remove Daphnia with pipette,
2) Add to cotton wool with distilled water
3) Let it acclimatise for 2 minutes
4) Add a drop of a known conc. of caffeine solution
5) Record the number of heartbeats seen through a microscope in 60 seconds, time with stopwatch
6) Do repeats at varying caffeine concentrations
Control variables
•Temperature
•Volume of solutions
•Stress of daphnia
•Size of daphnia
•Location that daphnia come from
Calculation
•Mean
•Standard deviation
Considerations
Ethics:
Could cause unnecessary stress to the animal
Return the animal to its original habitat
Why use Daphnia?
•Not endangered
•Produce asexually as clones
•they are transparent, can see their heart
•Less developed nervous system, reduced sense of pain
CP 02 - Vitamin C content of food and drink
Method
(simple titration)
1) Pipette 1cm3 of 1% blue DCPIP into conical flask
2) Fill burette with chosen fruit juice
3) Find volume of fruit juice needed to decolourise DCPIP
4) Repeat with each fruit juice
Calibration:
1) Use known concentrations of vitamin C
2) titrate against 1cm3 1% DCPIP.
3) Plot a graph of the volume of solution used to decolourise DCPIP, against the concentrations of vitamin C used.
4) The results with the fruit juice can be compared with this graph, finding out the %content of vitamin C within the juice.
Calculation
By comparing with the calibration curve, % of vitamin C can be worked out.
1% vitamin C=10mg, so apply this with the juice values to get the mass.
CP 03 - Membrane permeability
Method
1) Use cork borer & scalpel to cut equal length cylinders of beetroot on white tile
2) Wash and blot dry with filter paper
3) Fill boiling tubes with equal cm3 of distilled water
4) Place each boiling tube in different water baths at different temperatures
5) Add a cylinder of beetroot in each tube once it is at the right temperature
6)Set a timer for 30 minutes
7) Set a colorimeter to blue/green filter
8) Calibrate colorimeter with cuvette that has water
9) Once finished, add 2cm3 of beetroot solution in a new cuvette and measure % absorbance at different temperatures
Control variables
Volume of distilled water
Time left in water
Size of beetroot piece
Colorimeter used
Volume of beetroot solution
Control
Beetroot piece in 10cm3 of distilled water at room temp.
Graph: plot graph of %absorbance against temperature.
CP 04 - Enzyme and substrate concentrations - rates of reactions
Vary substrate/enzyme concentration, keep the other conc. controlled.
Control variables
Temperature
Volume of enzyme/substrate solution
Equipment
Range of concentrations for enzyme(trypsin, we did catalase) /substrate(casein, we did h2o2)
Thermometer
Water bath
Test tubes
Stop watch
Colorimeter OR gas syringe/inverted burette
Control
0% enzyme/substrate solution can be used and added to its component. The results can be compared to the control
Method
1)Add substrate to varying enzyme concentrations and measure the absorbance of samples in the colorimeter, or measure the volume of gas produced.
•Do this at regular intervals using a stopwatch
2) Plot a graph of each reaction, with absorbance/volume of gas released against time.
3) The gradient of the tangent to the initial point will give the initial rate of reaction for each curve.
4) Plot a second graph of the rates of reaction (y axis) against the enzyme/substrate concentration (on x axis)
Calc
Rate = Gradient of tangent
Stats
•Mean values
•Standard deviation for each concentration
CP 05 - Observing stages of mitosis
Equipment
•Root tip
•Sharp knife
•Acetic alcohol
•HCl acid
•Ice cold distilled water
•Water bath at 60̊C
•Test tube
•Microscope, slides
•Mounted needle
•Toluidine blue stain
Method
1)Cut small piece of root tip
2) The root tip needs to be macerated
•Place test tube of HCl in water bath, leave to heat
•Place root tip in alcohol for 10 mins
•Remove tip, place in ice cold water for a few mins.
•Place tip in heated HCl for a few mins.
•Repeat this
3) Break the tip with the mounted needle
4) Prepare slide, add dye (blot out excess dye) view at 100x - 400x magnification.
5) Count number of cells in one frame. Count the number of cells with visible chromosomes, in the same frame.
Calculation
Calculate the mitotic index:
Mitotic index=
Number of cells with chromosomes/Total number of cells
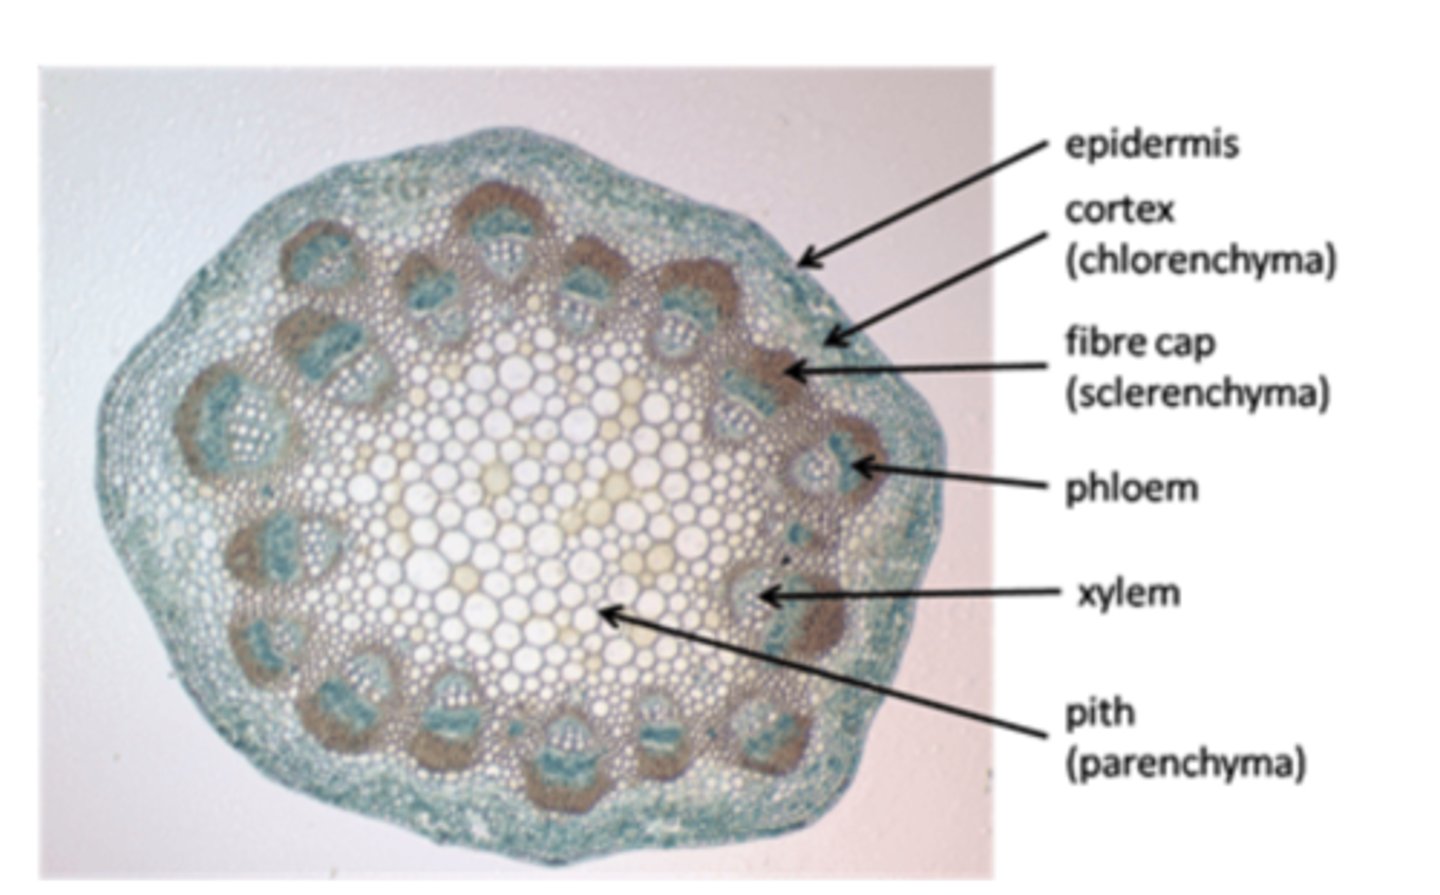
CP 06 - Identifying structures in a stem
Equipment
Plant sample
Coverslip
Mounted needles + forceps
Toluidine blue
Glycerol
(Filter paper, watch glass, coverslip)
Method
1)Place the plant sample on watch glass.
2)Pick out one/two vascular bundles and place on slide
3)Tease vascular bundles apart with needles
4)Add drop of Toluidine blue stain, leave for a few mins
•Blot off extra stain
•Add drop of glycerol
5) Examine under Low, medium and high
Observations
Xylem=long elongated tube like cells, walls thickened in spiral/ring formation. WIDER DIAMETER
Phloem sieve tube elements= also elongated, thin walls. Sieve plates visible as perforated cell walls.
Sclerenchyma - Long slender, HEAVILY STAINED. Outer edge of bundle.
Phloem- Smaller cells, more circular/rectangular than xylem. Cell walls less distinct.
CP 07 - Plant mineral deficiencies
Equipment
•5 plants
•Test tube rack
•Ruler
•Solution containing all minerals
•Solution containing all except magnesium ions
•Solution containing all except nitrate ions
•Solution containing all except calcium ions
•Solution containing no minerals
•Tin foil
Method
1) Half fill test tubes with each solution
2) Cover top with foil
3) Measure initial lengths of each seedling
4) Push roots of plantlet into solution, repeat for each tube
5)Wrap all tubes in foil (except for on top)
6) Place test tube rack on sunny window sill
7) Measure the length of the plants every other day, for two weeks
Control
The controls for this practical are the solution with all minerals, and the solution with no minerals.
Observations
Magnesium deficiency- stunted growth, yellowed leaves as chlorophyll cannot be made. Reddish brown tint
Nitrate deficiency- yellowed leaves and stunted growth
Calcium ions- stunted growth, soft plant lacking support as cell walls are weakened.
No minerals-Dead plant
All minerals- healthy plant, full growth
CP 08 - Tensile strength of plant fibres
Equipment
Stems of chosen plants
Sharp knife/scalpel
Paper towels
Clamp stands
A set of same type of weights
White tile
Method
1) Remove fibres*
2) Clamp fibre between two clamp stands
3) Add mass in middle, increase in increments
4) Note down mass required to snap fibre
5) Compare between different plants
* Soak plants if fibres are not easily obtainable
CP 09 - Antimicrobial properties of plants
Equipment
Pestle and mortar
Petri dish with agar seeded with E.coli
Ethanol
Sterile pipettes.
Garlic
Mint
Paper discs
Method
1) Crush garlic, add 10cm3 of alcohol. Shake for 10mins
2) Do same for mint
3)Pipette 0.1cm3 of each solution onto separate paper discs
4) Place the discs on agar
5) Close each disc, seal with tape, leave gap for oxygen
6) Leave to incubate overnight
7) Measure the radii of the clear zones of inhibition, compare with control disc
aseptic techniques:
-disinfected surfaces
-inoculating loop with
-incubation below 37 degrees C to prevent pathogens from thriving
-using flamed inoculating loops to transfer bacteria
Control
Add a disc that has 0.1cm3 of distilled water on it.
Calculation
Calculate area of zone of inhibition-->A=πr² .
Calculate mean using repeat data for each plant disc.
Conclusion
Garlic has a larger zone of inhibition, it has more antimicrobial properties.
CP 10 - Ecology of a habitat
Equipment
Quadrat (Open, 10x10)
Transect (50m)
Clipboard
Equipment for chosen abiotic variable (lux meter for light intensity; barometer for wind pressure; densiometer for shade/cover; hygrometer for humidity)
Method
Choose a site where there is a clear gradient in an abiotic variable
Lay out transect
Place quadrat at set intervals with bottom left corner on the mark at each sampling point
Record percentage cover at each sampling point for chosen species at each interval, by counting how many squares are mostly covered by the selected species.
Measure and record the abiotic variable at each sampling point. Take multiple recordings at each sample point for a mean value.
Graph
Plot a graph of percentage cover against the chosen independent, abiotic variable.
Statistics
Calculate means for the repeats of abiotic factors at each sampling point
-Use T-test to compare means between two groups
-Use Spearman's to assess correlation between variables
-Use Chi-squared test to evaluate if there is a significant difference/association between two variables.
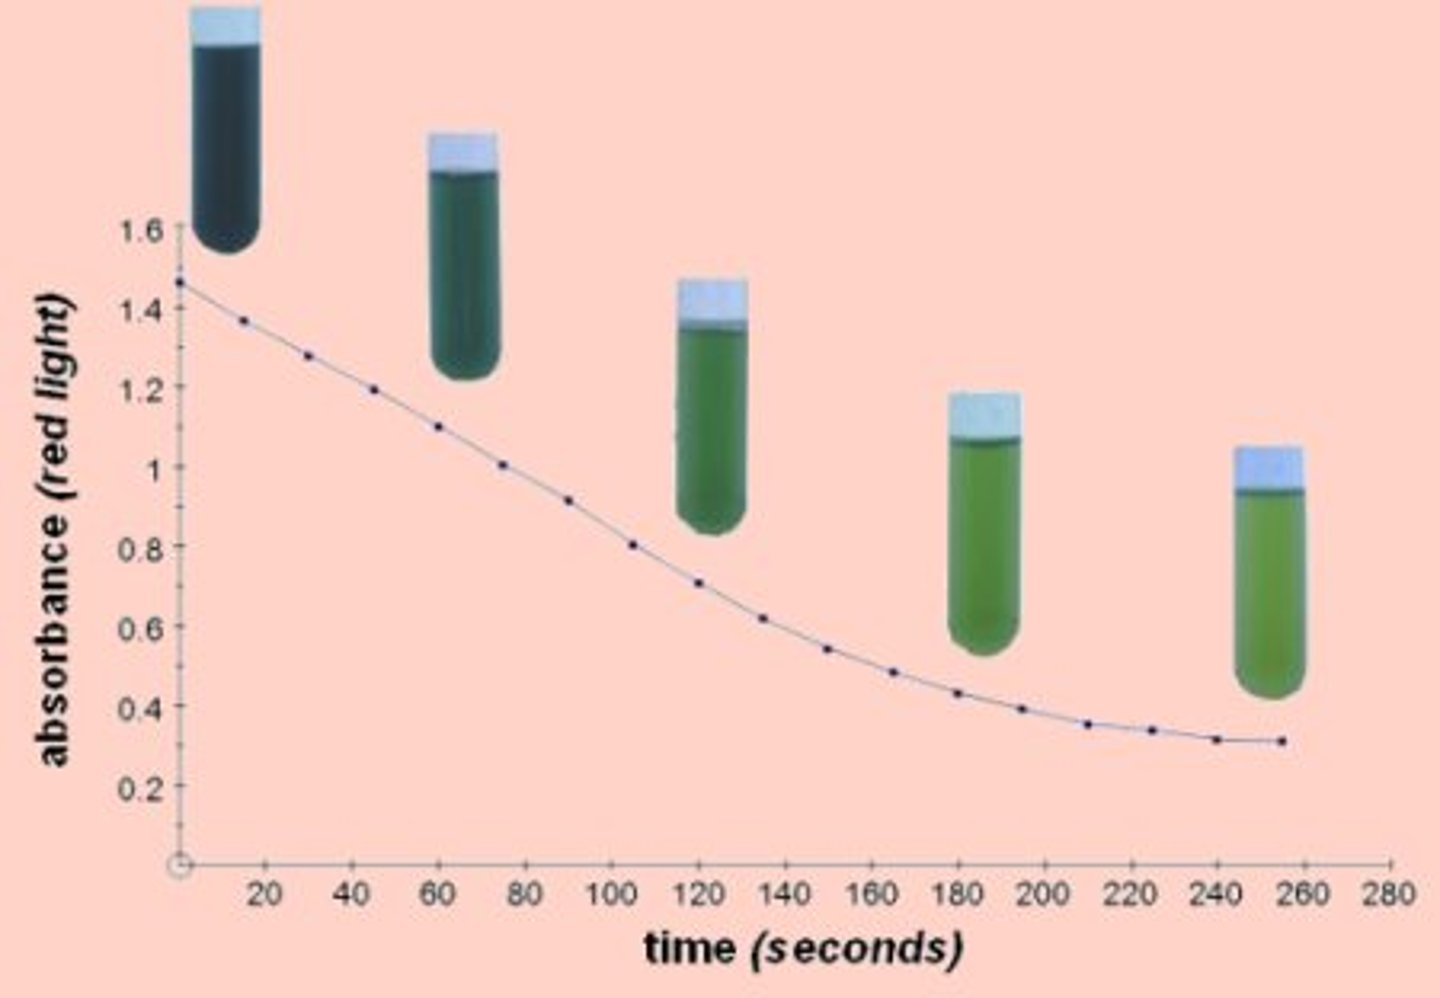
CP 11 - Photosynthesis and the Hill reaction
Equipment
•Leaf sample
•scissors
•mortar and pestle
•Centrifuge & tubes
•Ice-water-salt bath
•Glass rod
•Measuring cylinder
•Beaker
•Pipettes
•Lamp
•Isolation medium (sucrose solution)
•Buffer
•DCPIP solution
•Colorimeter
Method
1) Cut and crush leaf sample
2) Place in cold isolation solution
•Filter/strain sample into beaker using funnel and muslin cloth
•Place beaker in a cold water bath
3) Centrifuge a sample in a tube at high speed for 10 minutes
4) Once chloroplasts are separated, discard the supernatant
•Add ice cold isolation medium to pellet/sediment
•Add buffer solution, mix
5) Pour 5cm3 of the solution into 5 test tubes
6) Place test tube rack with each of the test tubes a determined distance away from the lamp
7) Add 10cm3 DCPIP to the test tube
8) Immediately take a sample and place it in a colorimeter, measure the absorbance under a red filter
•Take a sample every two minutes for 10 minutes
9) Vary the distances from the lamp
Control
Place one of the tubes in a dark cupboard, covered with tin foil. Measure the absorbance for this and compare the results with this value.
Graph
Plot a graph of absorbance against time for each distance from the light
Explanation/conclusion
As light intensity decreases, the rate of photosynthesis decreases
This means less electrons are released by chlorophyll
This means DCPIP is decolourised less, the further away the tube is
core practical 11 hill reaction condensed method
1) cut/crush leaf
2) place in cold isolation solution, filter
3) Centrifuge sample
4) discard supernatant, add more cold isolation medium with buffer soln.
5) pour into 5 test tubes
6) place each test tube set distances away
7) Add DCPIP to test tube, quickly take sample, place in colorimeter under red filter
8) Take samples/recordings at set intervals
9) plot graph of absorbance against time for each tube
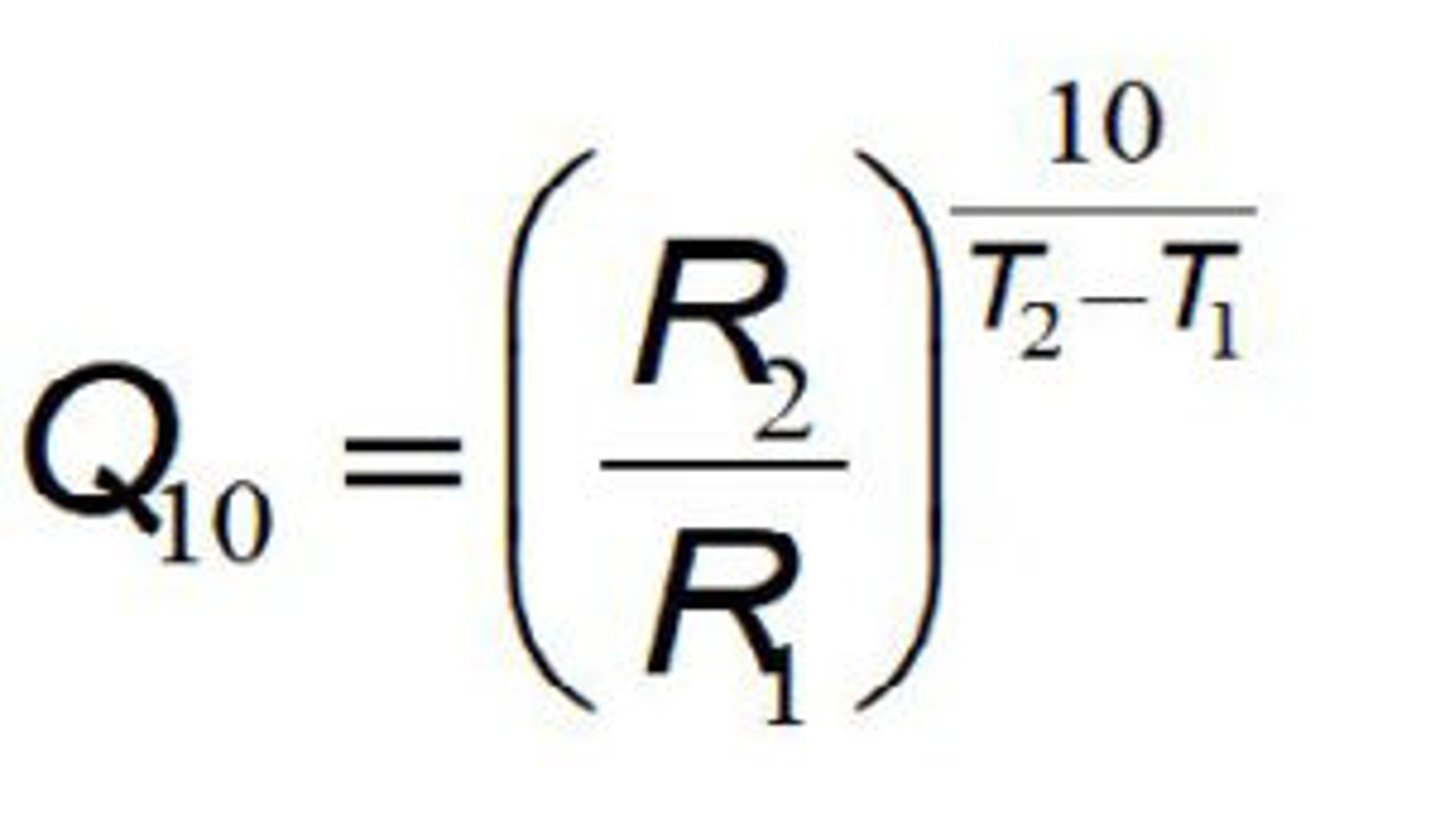
CP 12 - Temperature and the rate of an enzyme catalysed reactions n, to include Q10
Equipment
Water bath
Boiling tube
H2O2 solution
Soaked peas
Gas syringe
Mortar and pestle
Stopwatch
Delivery tube/bung
Method
1) Measure set mass of peas
2) Grind and place in boiling tube
3) Set up delivery tube and gas syringe
4) Add 5cm3 H2O2
5)Immediately attach bung/delivery tube to boiling tube
6) Time reaction for a controlled time period
7) Measure volume of gas produced at regular time intervals
8) Repeat experiment at different temperatures
Control variables
•Concentration of H2O2 solution
•Mass of peas
•Time of reaction
Graph
Plot graph of temp against concentration
Calculation
Rate= Volume of gas/time
Q10= (Second rate/First rate) ^(10/second temp-first temp).
Q10 being larger means that temperature increase affects the reaction more (typically around 2-3)
CP 13 - Temperature and the development of organisms
Equipment
5 water baths
Beaker
Sea salt
Egg cysts
Magnifying glass
Method
1)Measure 2g sea salt, add to 100cm3 water in beaker
2)Take a pinch of egg cysts, count 40 with magnifying glass
3)Place 40 in 5 separate beakers
4)Place separate beakers in separate water baths (at 10°C, 15°C, 20°C, 25°C and 30°C)
5)Count number of hatches larvae each day
6) Repeats can be made for each temperature
Graph
Plot number of larvae against time
Statistics
Spearman's rank to determine statistical relationship.
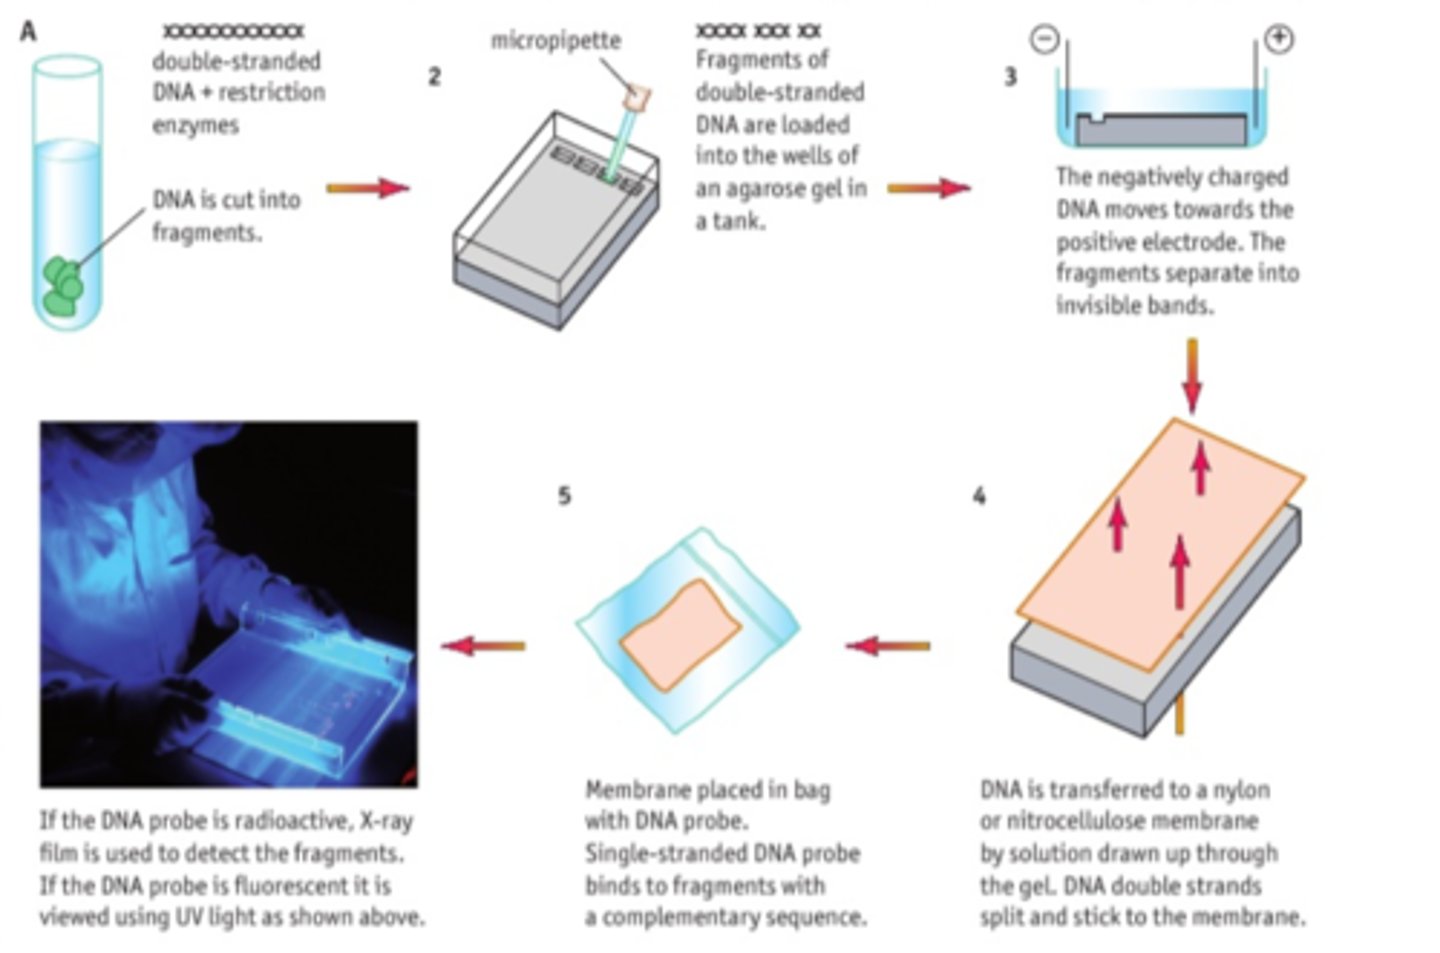
CP 14 - Separating DNA fragments - gel electrophoresis
Equipment
•Restriction enzymes
•Agar gel
•Gel tank
•Electrical supply + electrodes
•Micropipettes
•DNA sample
•Loading dye
•UV light camera
Buffer solution
•Beaker
Method
1) Mix DNA with restriction enzymes and loading dye.
2) Prepare agar gel in tank, with wells
3) Fill tank with buffer solution
4) Use micropipette to load the restriction ladder in first well
5) Connect tank to electrical supply. Turn on and leave til dye has moved to opposite end of tank
6) Turn off, remove gel carefully and view under UV light.
7) Compare with known DNA profile.
Explanation/conclusion
DNA has an overall negative charge, which means it moves to the positive electrode
Different sized fragments travel different distances due to varying STRs within the introns (non coding regions of the DNA).
This creates a unique DNA fingerprint.
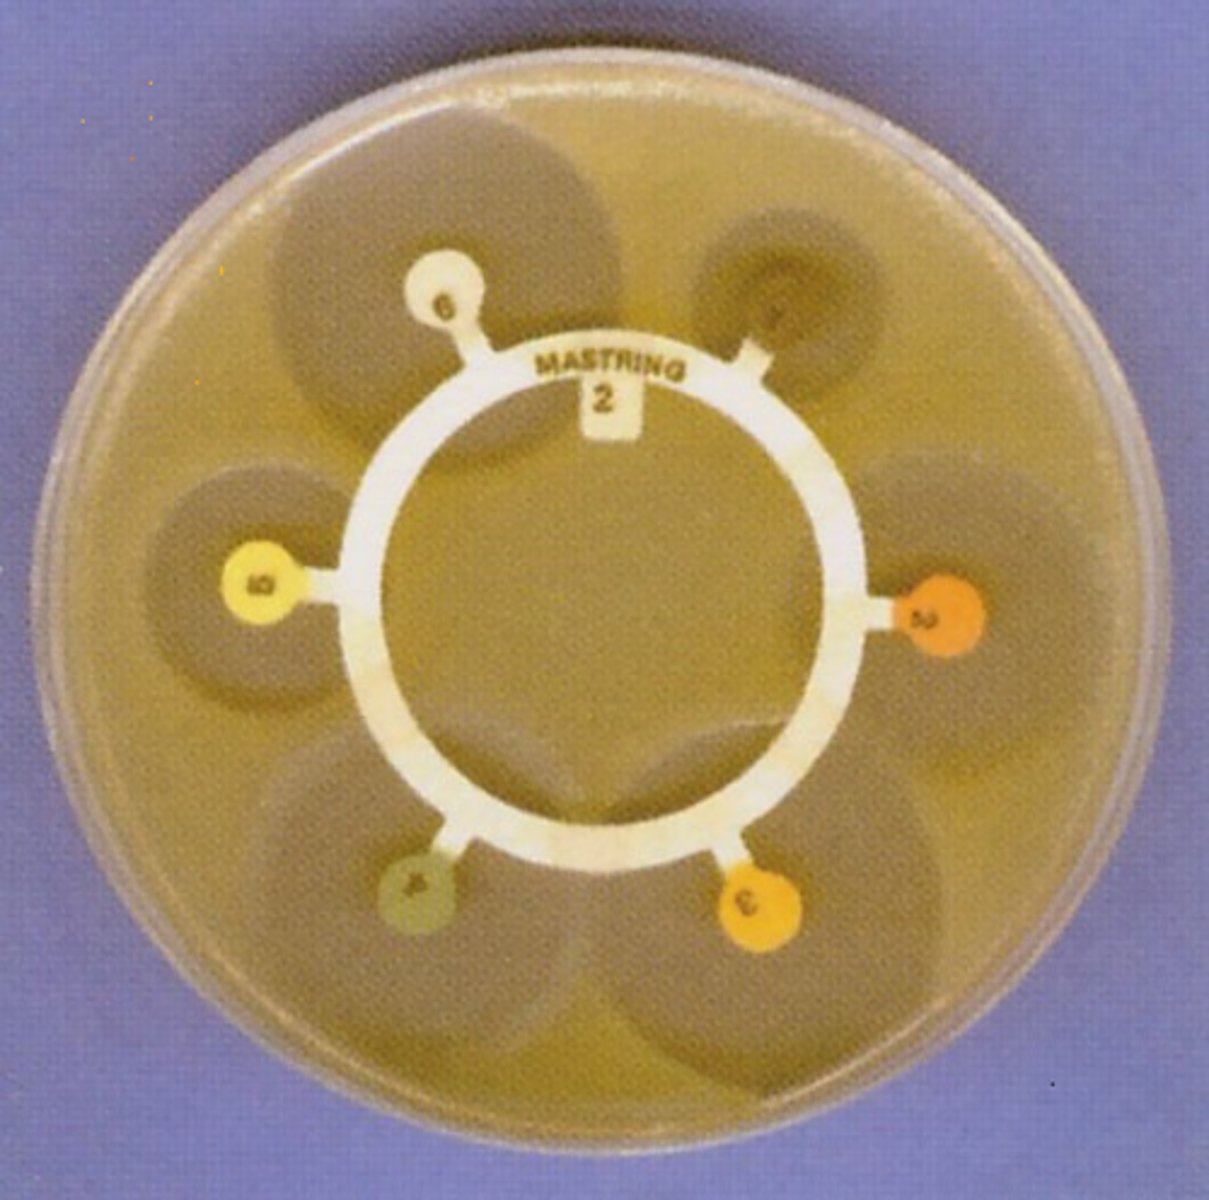
CP 15 - Effect of different antibiotics
Equipment
•Petri dish, agar seeded with E.coli
•Sterile forceps & paper discs
•Marker pen
•Mast ring with at least 5 different antibiotics
•Ruler
Method
1) Place the mast ring with antibiotics on the petri dish.
2) Close dish, seal with tape but leave a gap to allow for aerobic conditions
3) Leave cultures to incubate at 25°C for a day.
4) Use ruler to measure the radius of the clear zone of inhibition circle for each antibiotic disc.
Control
The control can be a plain paper disc with distilled water, to compare results with
Calculation
Area of zone of inhibition =πr² , r being measured by ruler.
Means can be calculated from repeats.
Conclusion
Disc with biggest Z.of Inhib= most effective antibiotic
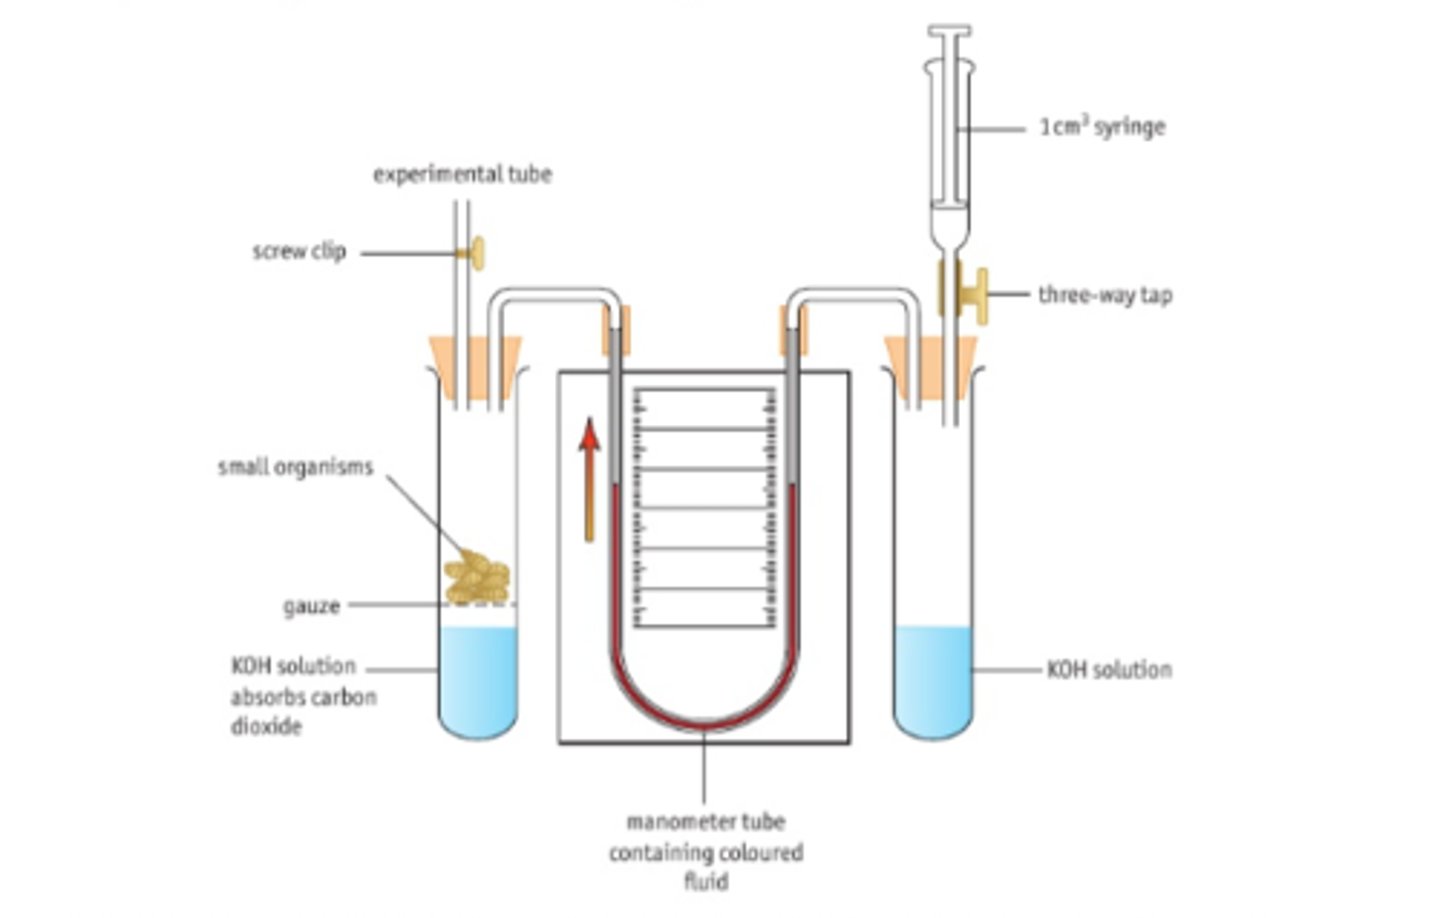
CP 16 - Investigate rate of respiration
Equipment:
•sodalime, dye, identical maggots, stopwatch, ruler/scale, gauze.
•Three way tap, glass tubing, 1cm^3 diameter pipette and a test tube are all used in conjunction as the respirometer.
• Syringe can be used to reset it.
•A water bath can be used to control temperature
u tube vs simple respirometer
Method
1) Set up tube with soda lima, gauze and cotton wool.
2) Set up spirometer with delivery tube, bung and syringe joined.
3) Mark starting point of dye
4)Place 5g equal size maggots in tube, close bung
5) Mark the position of the fluid on the pipette every minute for 20 minutes, record in table
Control variables
Species of maggot, size of maggot, temperature and time
Control:
Plastic beads in another tube
Calculation:
Volume of oxygen= πr2 * distance dye travelled.
• r is the radius of the pipette.
Stats:
Mean and standard deviation
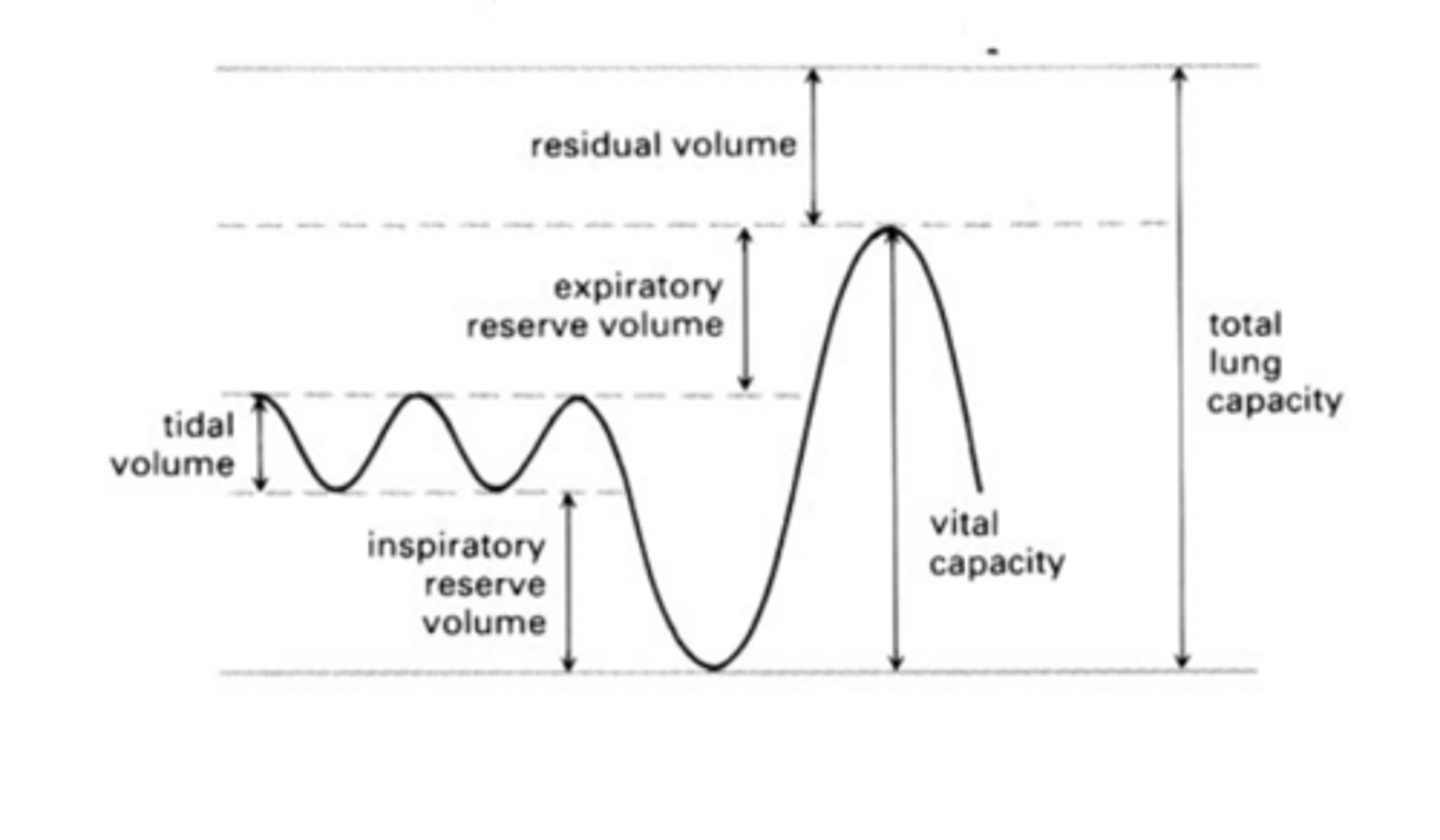
CP 17 - Measure effects of exercise
Equipment:
Spirometer
Kymograph
Nose clip
Soda lime
Method:
1) Calibrate the spirometer
2) Fill the spirometer with oxygen
3) Attach mouthpiece to tube
4) Place nose clip on subject
5) Attach mouthpiece to mouth of subject
6) Switch on recording apparatus
(Some air always remains in the lungs as residual air, to prevent alveolar walls from sticking together)
Calc
Minute ventilation = tidal volume × rate of breathing
Tidal volume is the volume of each breath
CP 18 - Habituation to a stimulus
Equipment: snail, damp cotton bud, distilled water, chopping board, stopwatch
Method
1) Moisten chopping board, select a snail
2) tap between eye stalks and start timer simultaneously.
3) Record the time taken for the eye stalks to fully re-emerge.
4) Repeat until snail no longer retracts its eye stalks.
Graph: Number of touches against time to re-emerge
Statistics test: Spearman's Rank, compare with databook value to test hypothesis.