Sampling distribution of the sample proportion
1/15
Earn XP
Description and Tags
Sampling distribution of the sample proportion
Name | Mastery | Learn | Test | Matching | Spaced |
|---|
No study sessions yet.
16 Terms
Sampling distribution
repeatedly taking a sample from a population
calculating a statistic for every individual sample such as xbar
combining that information on a graph to create a distribution (called sampling distribution)
Proportion
describes the fraction of favourable outcomes, in relation to the whole
This is what we are trying to study, e.g. someones height, age or score that they got on a test, etc = this is measured variables which we can record from a population or sample.
Example of a proportion
proportion of people that have green eyes - we can measure this in two ways:
1. take a sample and see how many people have green eyes within that sample
2. we can interview the entire population and record how many people have green eyes
sample size of 10, however only 2 people had green eyes: 2/10 = 0,2
population size of 5000 and only 900 people had green eyes: 900/5000= 0,18
proportion of a sample is represented by
p hat: ˆp
proportion of a population is represented by
P
Formula of the proportion
number of favourable outcomes/ total number of outcomes
How to find: Sampling distribution of the sample population
if we repeatdly take samples from the original population and calculate “p hat/ˆp” for each sample, we will get a lot of different data, & the possibilities are endless.
the value of p hat/ˆp depends on the data which have been collected, & each sample can be different due to probability
if we take all of these p hats/ ˆp, & put them onto a graph = distribution of p-hats/ ˆp = in other words this refers to the sampling distribution of the sample proportion.
Meaning of Sampling distribution of the sample population
a distribution of the statistic ˆp, which was made from repeatedly taking random samples.
like any distribution it will contain a value for the mean & a value for the standard deviation
The mean denoted of the sampling distribution of the sample proportion
µˆp = Mu p-hat
µˆp
The mean denoted of the sampling distribution of the sample proportion
The standard deviation denoted of the sampling distribution of the sample proportion
sigma p-hat
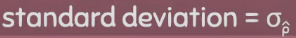
The standard deviation denoted of the sampling distribution of the sample proportion
In sample proportions, the standard deviation of the sample proportion is used to
measure how much the sample proportion (𝑝̂) is likely to vary from the true population proportion (p).
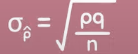
Here’s the formula for the standard deviation (σₚ̂ ) of the sample proportion
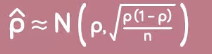
What can we say about a sample proportion which is normal and follow a central limit theorem?
mu p-hat is equal to P \ this means that the average of all p-hats combined is equal to the population proportion P

the standard deviation sigma p-hat is equal to the square root of PQ divided by n, where n is equal to the sample size, P is equal to the proportion of successful outcomes, & Q is equal to the proportion of outcomes that are not successful = because of this Q is equal to 1 minus P
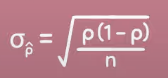
if it follows a mean of p, and a standard deviation of square root of p times 1 minus p/n - then we can use the score table and the standardization formula to help us calculate areas related to certain Z-scores
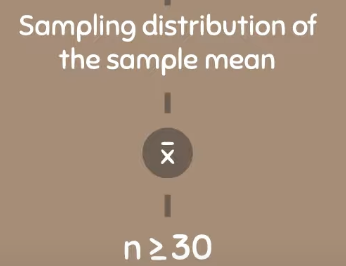
Central limit theorem is different
in sampling distribution of the sample mean x-bar, the central limit theorem applies when the sample size n is greater than or equal to 30
in sampling distribution of the sample proportion = it has to satisfy two conditions: n*p must be greater or equal to 10, & second condition is that n*1-p must be greater than or equal to 10
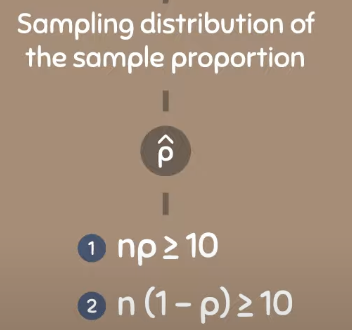
if this is done, the central limit theorem can be applied, & also the z-score table can be used by using the appropriate standarization formula.
Relation to sampling distribution of the sample proportion
binomial distribution
probability