CLASS 1 - COVARIANCE AND SCATTERPLOTS
1/37
Earn XP
Description and Tags
STATS II
Name | Mastery | Learn | Test | Matching | Spaced | Call with Kai |
|---|
No analytics yet
Send a link to your students to track their progress
38 Terms
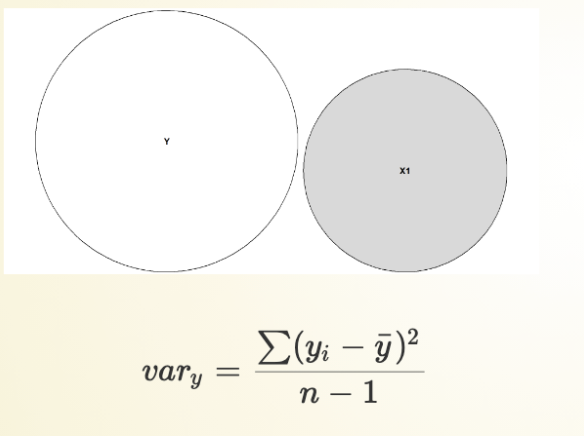
Variance:
how much do observations deviate from the central tendency?
How spread out are the variables? More spread out = more variance.
Sum up all the mean, square so it’s positive then subtract the number of observations minus one.
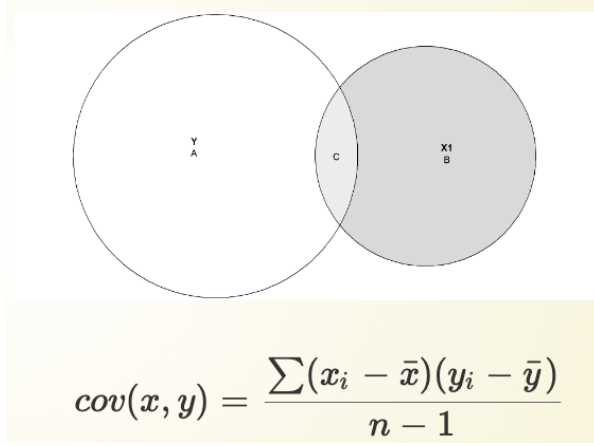
Covariance:
How much do variables vary together? How much do those circles overlap?
Sum up all the mean, square so it’s positive (now we look at both observations together) then subtract the number of observations minus one.
FOCUS: If one variable increases or decreases, how does it affect the outcome? (-,+)
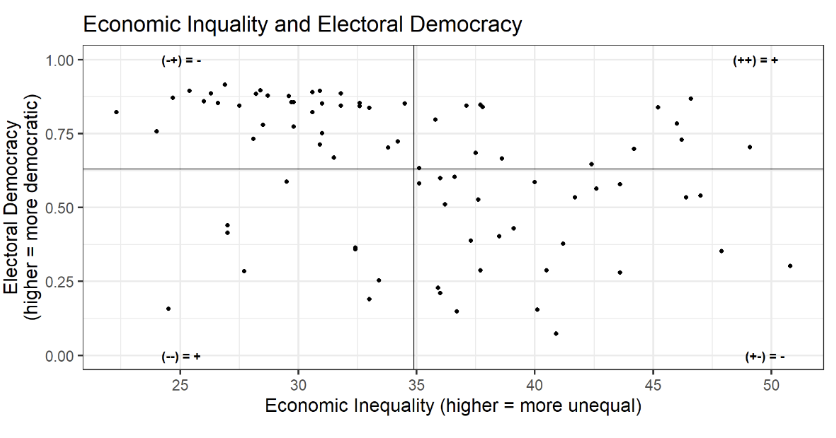
Looking for Covariance in a Scatterplot
Scatterplots: Visual inspection (for two continuous variables)
x-axis = IV
y-axis = DV
<= Negative Association (data clusters in the upper left and bottom right quadrants).
To better analyze the relationship => Divide the figure into quadrants (determined by means), it is easier to see prevalence then.
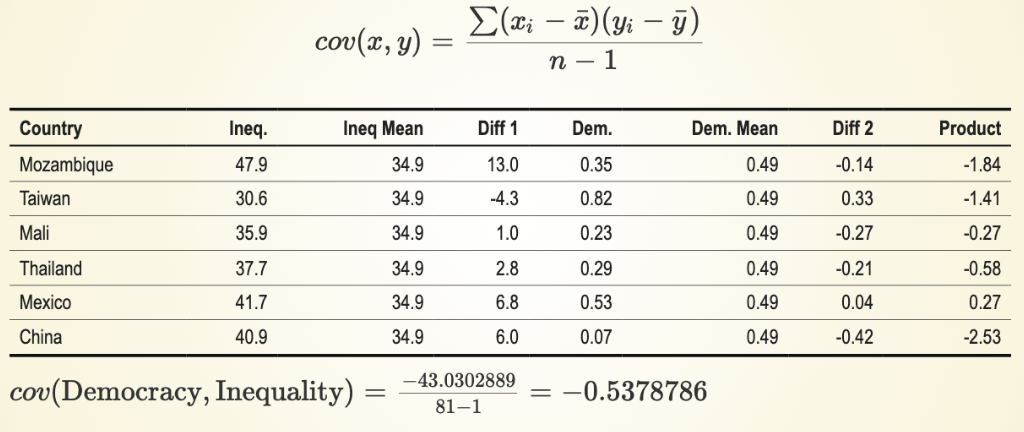
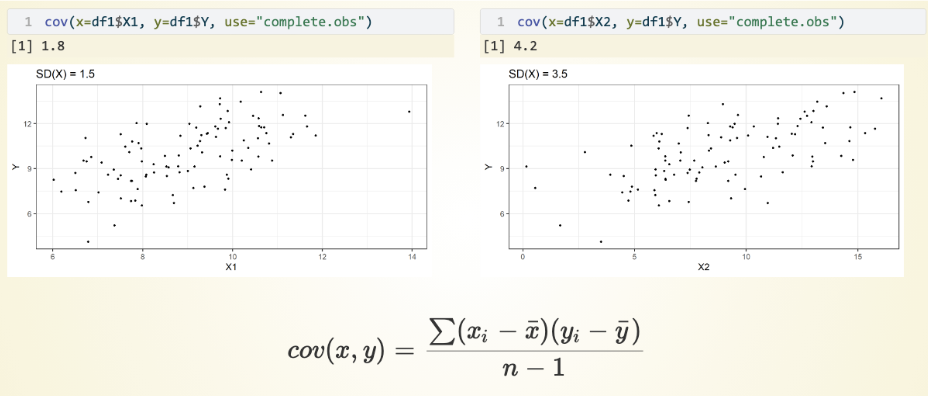
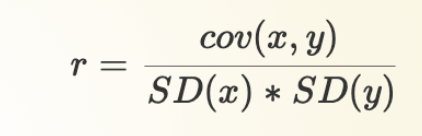
Covariance: Calculation
Covariance Statistic: Summary statistic of relationship
<= Negative covariance (Note, probably calculations not on the exam)
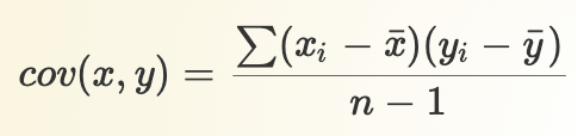
Covariance: Scale
Scale matters
<= The denominator is the same (the number of observations on both are the same), in both cases DV is the same, but with different IVs.
Are covariance statistics standardized or unstandardized?
Covariance statistics are unstandardized.
Are correlation statistics standardized or unstandardized?
Correlation coefficients = standardized covariance statistic.
Are linear regression models standardized or unstandardized?
Linear regression models are not standardized but with many other advantages.
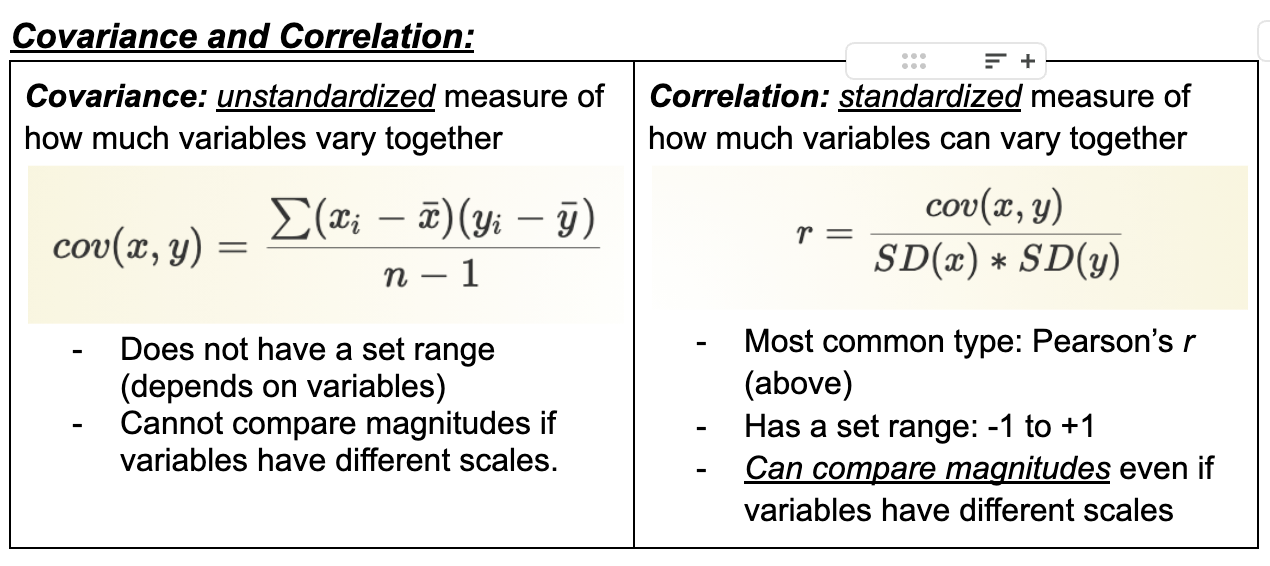
Covariance
unstandardized measure of how much variables vary together
Does not have a set range (depends on variables)
Cannot compare magnitudes if variables have different scales.
Correlation
standardized measure of how much variables can vary together
Most common type: Pearson’s r (above)
Has a set range: -1 to +1
Can compare magnitudes, even if variables have different scales
Correlation vs Covariance
Correlation: Basic Interpretation
Correlation statistics range from -1 to +1
Positive values
As one variable increases, so does the other one
+1 = perfect positive linear relationship
Positive relationship (= as one variable increases the other does as well)
+1 = all of our points in a scatterplot fall in a perfectly sloped straight upwards line.
Negative Values
As one variable increases, the other decreases
- 1= perfect negative linear relationship
Negative relationship (= as one variable increases the other decreases)
- 1 = all of our points in a scatterplot fall in a perfectly sloped straight downwards line.
0 value: No linear relationship
Correlation: “Size” Rule of Thumb
Correlations range from -1 to +1
-1: Perfect negative linear relationship between variables
0: No linear relationship between variables
+1: Perfect positive linear relationship variables
One common rule of thumb for interpreting correlation effect sizes:
r < |0.1|: Very small
|0.1| <= |0.3|: Small
|0.3| <= |0.5|: Moderate
r > |0.5|: Large
P-Value
P-value: Assuming that the correlation between the two variables in the population was 0, what is the probability of finding a t-statistic of this size (|3.12|) or greater?
Conventional threshold for “significance”: p < 0.05
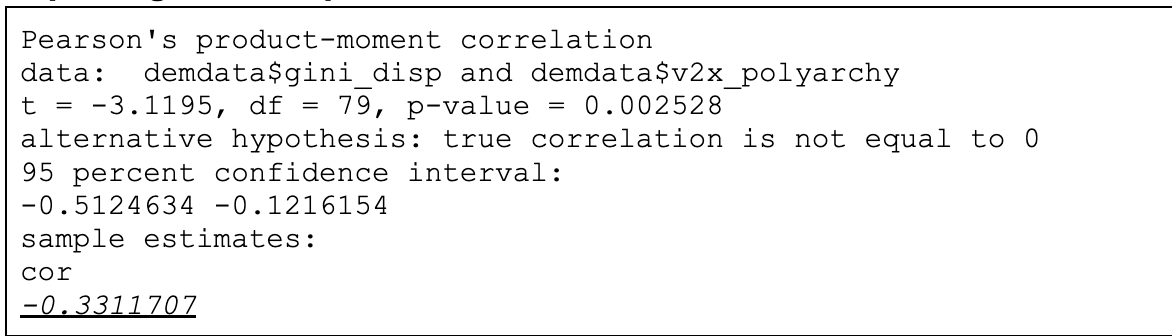
Reporting and interpretation - Economic Inequality and Electoral Democracy
Interpretation: Higher levels of economic inequality are associated with lower levels of electoral democracy (r = -0.33). This association is moderate in size and statistically significant (p < 0.01).
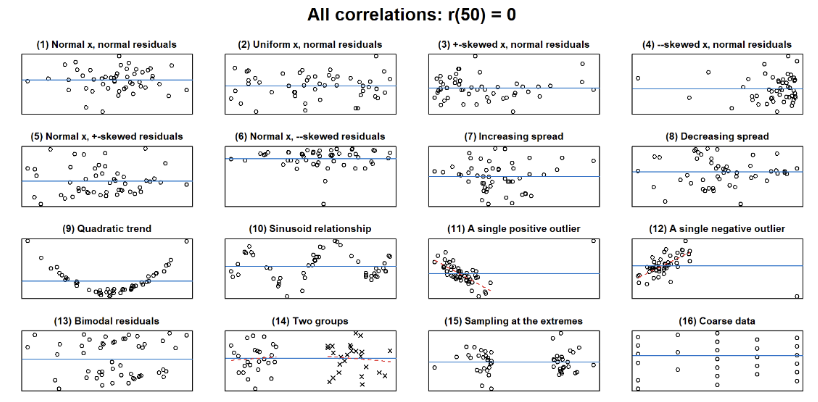
Caution: Correlation
A correlation coefficient (unless -1 or +1) could hide a variety of different patterns.
<= every plot shows zero correlation (but do not reflect NO relationship ONLY that there is NO LINEAR relationship).
There are relationships with different kinds of correlation.
Model = simplification of reality (can give wrong answers, must learn how to interpret).
Assumptions of Pearson’s r
Interval-ratio (“continuous”) variables
A linear relationship between variables < = Assumption can be wrong!
Spearman’s rho
Primarily used for discrete ordinal variables and when assumptions of Pearson’s are violated (e.g., no linear relationship)
Data is ordinal or the relationship is not strictly linear
Measures the strength and direction of association between two ranked variables
Looking at the association between the ranks of two variables in the distribution
May also see Kendall’s tau-b when there are many ties
Quick Review: Correlations
Correlation Coefficient: a standardized measure of the linear association between two continuous variables
Ranges from -1 to +1: values closer to -1/+1 = stronger associations
Non-linear relations and/or ordinal data? Use Spearman’s rho
Correlation ≠ Causation
Linear Regression
Correlation: How closely do points cluster around a straight line?
Linear Regression:What are the properties of that straight line?
Linear Regression: Definition: Linear regression is “a method that allows researchers to summarize how predictions or average values of an outcome vary across [observations] defined by a set of predictors.”
![<p><span><strong><em><u>Correlation:</u></em></strong><em> </em>How closely do points cluster around a straight line?</span></p><p><span><strong><em><u>Linear Regression:</u></em></strong>What are the properties of that straight line?</span></p><p><span><strong><em><u>Linear Regression: Definition:</u></em></strong> Linear regression is “a method that allows researchers to summarize how<strong><em> predictions or average values</em></strong> of an outcome vary across [observations] defined by a set of predictors.”</span></p>](https://knowt-user-attachments.s3.amazonaws.com/327ff22d-c6bf-4bdb-aa88-10a2131b02a3.png)
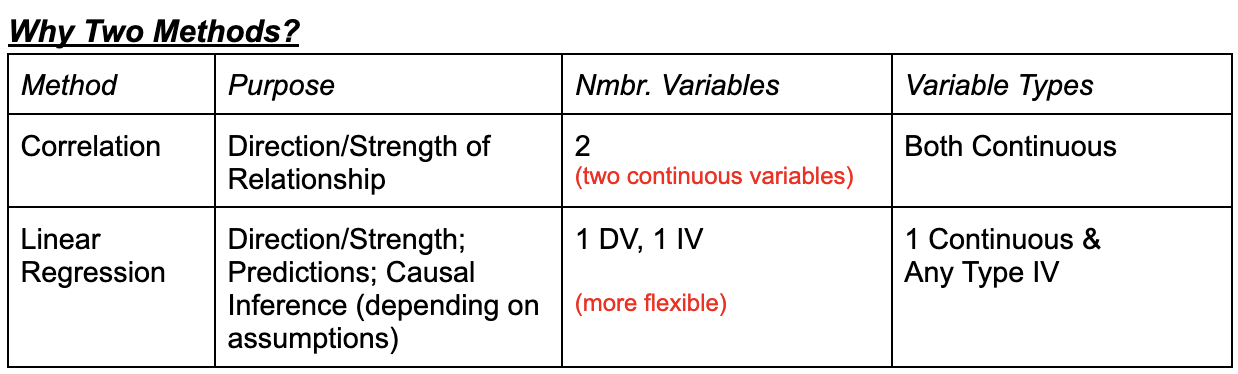
Why Two Methods?
When both variables are continuous: provide different (but related) information
Both tell us about the direction of the relationship
Correlation is easier to use when assessing effect size (correlation = standardized effect size).
Linear regression allows to assessment of standardized effect size, more specific predictions, and causality
DV and IV
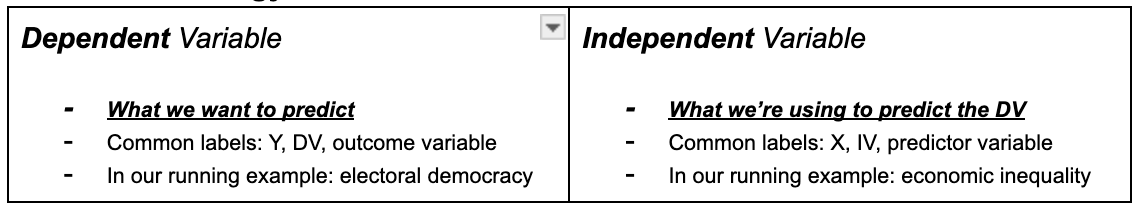
Prediction
Goal = What is our best guess about one variable if we know what the other variable(s) equals?
Goal = to guess, or best predict one variable based on another.
Example: what is our best guess about the level of democracy in a country if we know its level of inequality?
Predicting one variable with Another
Prediction with access to just Y: average value of Y
Prediction with another variable: for any value of X, what’s the best guess
of Y?
Example: What’s my best guess about the country’s level of democracy if the Gini coefficient = 30?
We need a function (y=f(x)) that maps values of X into predictions
Machine learning = fancy ways to determine the function.
Using a Line to Predict
Can we smooth these binned means and close gaps? Yes, via a model!
Models: abstractions that may be useful for answering our questions
We make some simplifying assumptions to generate predictions.
Simplest model: a straight line
All we need to know in order to make a prediction: the value of X, the intercept of the line, and its slope: y = ax + b
Sample Regression Equation
The equation here refers to the “line of best fit” or “best fitting” line within a sample of observations.
Regression line = straight line

Subscript i
Subscript i refers to different observations in our mode
yi = Value of y for observation i = {1,2,3...}
xi = Value of x for observation i = {1,2,3...}
ei = Value of for observation i = {1,2,3...}
y25 = b0 + b1* x25: What is the predicted value for observation 25?
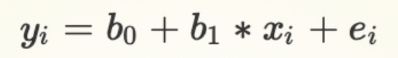
Parameters / Coefficients
Coefficients/Parameters: b0 ,b1
b0: Intercept of the line of best fit (also referred to as the Constant term)
b1: Slope of the line of best fit
Multiple linear regression models will have multiple slope terms/coefficients: b2,b3 …
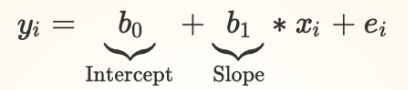
Intercept - Regression Equation
b0: intercept
Average value of Y we expect to observe when X = 0
Average value of V-Dem democracy score measure we expect to observe when the inequality measure = 0
The expected average value of a country with perfect equality

Slope Coefficient - Regression Equation
b1: Slope of line (Slope term; coefficient for IV)
How we expect the mean of Y to change when X increases by one unit
When x changes given how Y changes (rise/run)
How we expect the mean V-Dem democracy score to change when our inequality measure goes from 0 to 1, or 1 to 2, or 10 to 11...
Assumption: same amount of expected change in Y for each one unit change in X (Week 4)

Populations vs Sample
Population: Observations of relevance for our RQ
Sample: Selection of observations we actually analyze
Coefficients: Sample and Population
Our goal is to understand what b0 and b1 are in the population
We use estimates of them in our sample to infer what they are likely to be in the population
An estimate is our best guess about some parameter

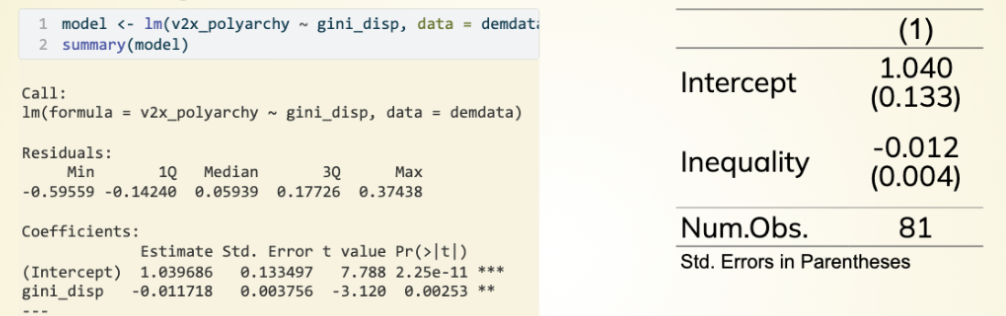
Our Example - What do columns mean?
“Estimate” = Coefficient (Intercept or Slope)
“Std. Error” = Standard Error of coefficient (next week!)
“Num.Obs” = # Observations in mode
What is the mean value we expect to observe when our IV = 0?
...What if X doesn’t/cannot equal 0?
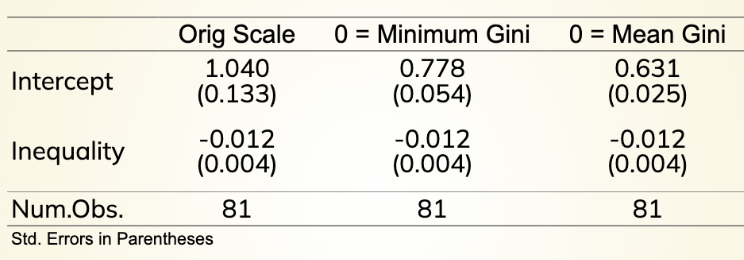
What do we do if IV cannot Equal Zero?
Intercept = Mean value we expect to observe when IV = 0
< = If cannot = 0 (not actually possible), rescale the IV
Orig scale = In a perfect world we would expect 0 inequality and a democracy score of 1.040
Minimum Gini = Found inequality variable and subtracted the minimum from it
Mean Gini = Found inequality variable and subtracted the mean from each observation.
^ Intercepts change because you change what zero means in each context of the regression.
Changing Y but not the slope (inequality remains the same).
Slope Term /Coefficient
How should we expect the mean of Y to change if X increases by 1 unit?

Reporting/Interpretation of Slope (IV: Democratic scores; DV: Inequality)
Higher levels of economic inequality are associated with lower levels of electoral democracy. We expect that democracy scores will decrease by 0.012 scale points, on average, with each one-unit increase in inequality.
^ incremental change (per one unit increase).
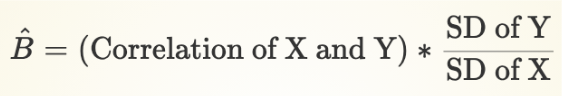
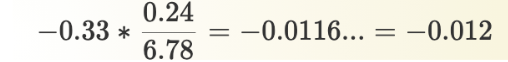
Slope Coefficient and Correlation Coefficient
The slope coefficient is related to the correlation coefficient
Correlation = -0.33
SD of X = 6.78
SD of Y = 0.25
Coefficient = -0.012
Is this a “big” or “small” relationship?
It's 0.012 and unstandardized
Difficult to assess because changes are incremental
Regression coefficients are unstandardized so it’s difficult to say
A way to start: use the model to calculate predicted or expected values of
Y at different values of X and use knowledge about the topic to advance a claim about the importance
Review
Three related ways for investigating the relationship between a continuous DV and a continuous IV:
Covariance: Unstandardized measure of the association between two continuous measures
Correlation: Standardized measure of the association between two continuous measures
Linear Regression: Prediction line telling us how to expect the mean of Y to change when X changes by 1 unit