Correlations
1/18
There's no tags or description
Looks like no tags are added yet.
Name | Mastery | Learn | Test | Matching | Spaced |
|---|
No study sessions yet.
19 Terms
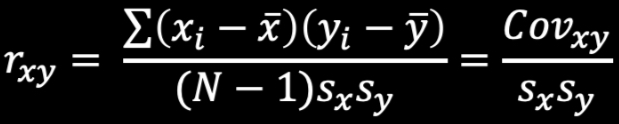
Correlation
how two variables covary in relation to each other
how they move together/vary together
standardized covariance
the value of r can range between -1 and +1
- = move in opposite directions
+ = move in the same directions
if r = 0 — there is no linear relationship between the two variables
the closer r is to ± 1, the stronger the relationship
if r = ±1 — there is a perfect linear relationship between the variables
Deviation from the Mean
Observation - mean = distance of the observation from the mean
Two ways to define correlation coefficient
z scores
covariation
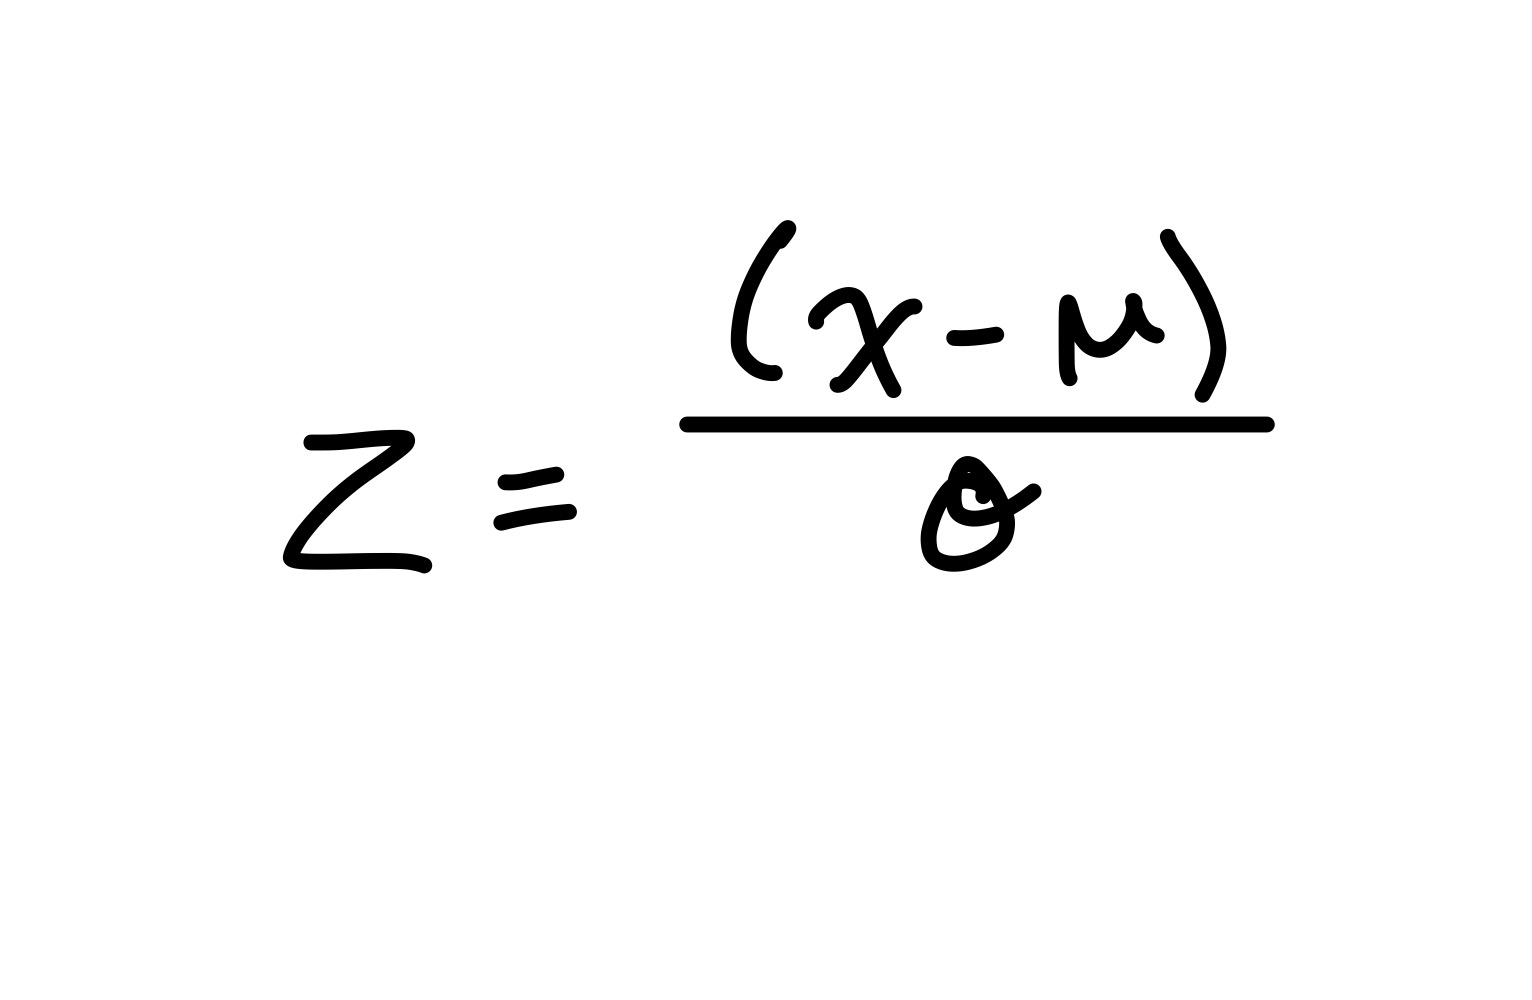
z scores
z = 0 — score = mean
z > 0 — score ≠ mean
z = 1 — score = 1 SD from mean
z = 1 — score = 2 SD from mean
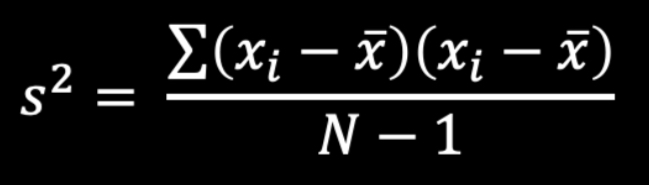
Variance Formula
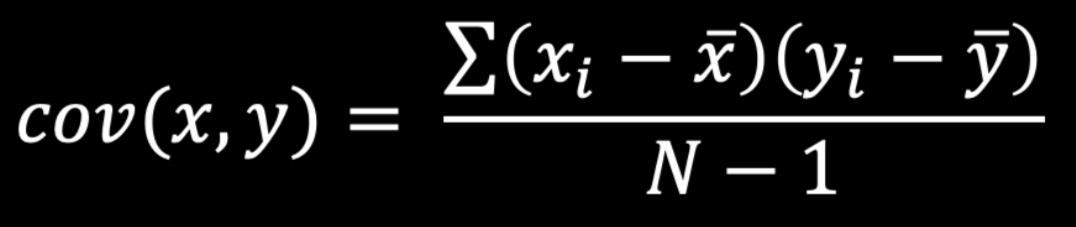
Covariance Formula
Coefficient Determination
r2 indicates the percent of the variability in y that is accounted for by the variability in x
Model
variability in scores that we can account for
Error
variability in scores that we cannot account for
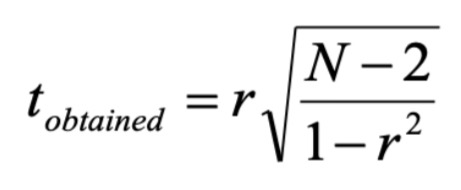
t obtained formula
Steps in Finding Correlation
create H0 and H1
set parameters (find critical t)
calculate t obtained
compare critical t and t obtained
find p-values in SPSS
Steps in Finding Confidence Intervals
convert Pearson’s r to z score
compute a confidence interval for z score
convert z score back to Pearson’s r
Calculating Confidence Intervals
CI = value ± (z critical (SE))
Standardization Formula
Reliability
in research, the term reliability means “repeatability” or “consistency”
a measure is considered reliable if it would give us the same result over and over again (assuming that we are measuring isn’t changing!)
Internal Consistency Reliability
AKA “coefficient alpha”, “Cronbach’s alpha”, “reliability coefficient”
judge the reliability of an instrument by estimating how well the items that reflect the same construct yield similar results
looks at how consistent the results are for different items for the same construct within the scale
questionnaires often have multiple questions dedicated to each factor (some need to be reverse coded)
Purpose of Internal Consistency Reliability
used to assess the consistency of results across items within a test
how well do the items “hang” together?
typically, a reliability analysis is done on items that make up a single scale (items all supposed to measure roughly the same construct) — founded on correlations of items
Reliability Coefficients
range from 0-1.00 with higher scores indicating the scales is more internally consistent
generally, reliabilities above .70 are considered acceptable for research purposes
reliability analyses are carried out on items AFTER recoding (reverse coding)
Validity
is the test measuring what it claims to measure