The Water Cycle
1/64
There's no tags or description
Looks like no tags are added yet.
Name | Mastery | Learn | Test | Matching | Spaced | Call with Kai |
|---|
No analytics yet
Send a link to your students to track their progress
65 Terms
System
a set of interrelated components working together towards a process
Flow/transfer (& example)
A form of linkage between one store/component and another that involves movement of energy/mass.
Evaporation/throughflow/stem flow etc.
Input (& example)
The addition of matter and/or energy into a system.
Precipitation
Output (& example)
matter or energy moving from the system to outside the system/to another system
Channel flow (not surface runoff)
Store/component (& example)
A part of the system where energy/mass is stored or transformed.
Puddles/soils/trees etc.
Energy (& example)
power/driving force
Insolation (incoming solar radiation)
Matter
any substance that can be weighed & takes up space
Models (& why they are used)
A simplification of something
Allows relationships between components to be better understood
Open systems
inputs and outputs of energy & matter exchange at its boundaries
Closed system
only energy is inputted and outputted; matter is contained within the system boundary
Isolated systems
does not share matter or energy with their surroundings
Cascading systems
where energy & material are transferred from one subsystem to another
Dynamic
ever-changing
Dynamic equilibrium
where inputs & outputs are equal (stores stay the same)
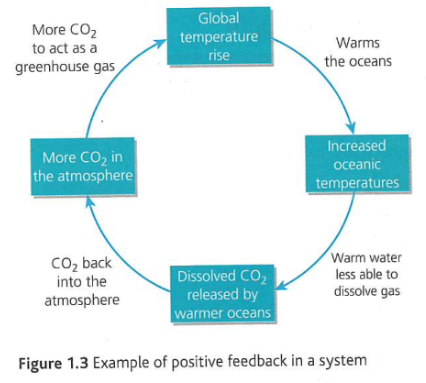
Positive feedback
where effects of an action are amplified by subsequent knock-on effects
Negative feedback (& example)
where effects of an action are nullified by subsequent knock-on effects

5 global systems
Atmospheric: interaction of gases
Lithosphere: interaction of solid/semi-solid/liquid crust
Biosphere: interaction of biological life
Hydrosphere: interaction of water
Cryosphere: interaction of frozen water
How much of Earth’s water consists of freshwater?
3%
How much freshwater consists of ice caps and glaciers?
69%
How much freshwater consists of groundwater?
30%
How much freshwater consists of easily accessible surface freshwater?
1%
How much easily accessible surface freshwater consists of lakes?
52%
How much easily accessible surface freshwater consists of soil moisture?
38%
How much easily accessible surface freshwater consists of water vapour?
8%
How much easily accessible surface freshwater consists of water within living organisms?
1%
How much easily accessible surface freshwater consists of rivers?
1%
How much of the Earth’s water consists of oceanic water?
97%
How much of the Earth’s water consists of atmospheric water?
0.4%
Components of cryospheric water (& definitions)
Sea ice: water cooled to temperatures below freezing
Ice caps: land ice < 50,000 km²
Ice sheets: land ice > 50,000 km² (buildup of snow that doesn’t entirely melt in summer)
Ice shelves: ice sheets moving out into oceans
Alpine glaciers: ice found in deep valleys/upland hollows
Permafrost: permanently frozen soil
Components of terrestrial water (& examples/definitions)
Surface water: lakes/rivers/wetlands (where there is dominance by vegetation)
Groundwater: water that collects underground in the pore spaces of rock
Soil water
Biological water
How evaporation is caused
Energy from solar radiation hitting the surface of water or land
Saturation point
where no more of something can be absorbed because the capacity is full
Factors affecting evaporation (incl. reasoning)
Amount of solar energy
Availability of water
Humidity of air (closer to saturation point = slower rate of evaporation)
Air temperature (warmer air can hold more water vapour than colder air)
Transpiration
Where water is transported from the roots of a plant to its leaves and is lost through pores on the leaf surface
How condensation works
Air cools = less water vapour capacity
Cooled enough = reach dew point temperature & is saturated
Via condensation: excess water converts into liquid water
How condensation is caused
When air temperature is reduced to dew point but volume remains constant:
Occurs when warm moist air passes over a cold surface
Occurs also when on a clear winter’s night, heat is radiated out to space and the ground gets colder, cooling the air directly in contact with it
Features of the start of Quaternary glaciation
Started 2.58 million years ago
Sea levels was approx. 120 m lower than present
Continental glaciers covered large parts of Europe, North America and Siberia
Interglacial periods: global ablation (loss of ice mass) > accmulation (gain of ice mass) = present-day hydrological cycle
Drainage basin
An area of land drained by a river and its tributaries
Groundwater flow/percolation (& factors affecting it)
Horizontal/vertical movement of water within rock under the soil surface
Controlled by rock saturation: more porous rock e.g. chalk/sandstone = faster rate compared to less porous rock e.g. clay rock
Infiltration (& factors affecting rate)
Downward movement of water from the surface into soil
Controlled by soil saturation: more porous soil e.g. course/sandy soils = faster rate compared to less porous soil e.g. clay soil
Animals creating burrows
Interception storage (& factors affecting it)
Precipitation that falls on vegetation surfaces/man-made cover which is stored
Precipitation levels
Density of vegetation in drainage basin
Overland flow
Tendency of water to flow horizontally across land surfaces (where rainfall has exceeded infiltration capacity)
Run-off
All water that enters a river channel and eventually flows out of the drainage basin
Stemflow
Precipitation intercepted by the canopy that reaches the ground via flowing down stems/stalks/tree trunk
Throughfall (& when it occurs)
Precipitation that reaches the ground directly through gaps in plant canopy
Precipitation that drips off leaves/twigs/branches (occurs when canopy surface exceeds storage capacity)
Throughflow
Movement of water down-slope through subsoil due to gravity (enhanced by underlying impermeable rock due to increased horizontal motion)
Water balance
Balance between inputs (precipitation) & outputs (run-off & evapotranspiration & soil/ change in groundwater storage)
Watershed
High land that separates drainage basins (boundary)
How surface storage is created
When rainfall intensity > infiltration rate (& has reached infiltration capacity)
Soil = saturated
Water table
The underground boundary between the saturated & unsaturated zone
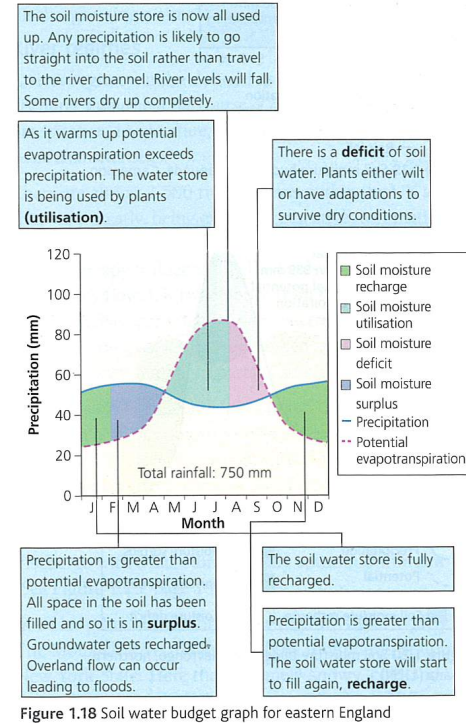
Potential evapotranspiration
Amount of water that could be evaporated or transpired (or both) if there was sufficient water available
Soil moisture graph (6 stages)
Discharge (equation)
volume x velocity
Why hydrographs are important
Assessing management of water resources (incl. irrigation provision)
Whether water-related structures required (e.g. reservoirs/bridges/flood banks/urban drainage schemes/sewage treatment works)
Whether flood warning/alleviation schemes required
Whether hydroelectric power is suitable
Ecological health & recreational value of wetlands
River regime
The variability in its discharge annually in response to precipitation, temperature, evapotranspiration and drainage basin characteristics
Physical factors affecting hydrograph steepness (not covered in GCSE)
Length & size of drainage basin
Drainage density (i.e. lots of surface streams acting as tributaries to main river)
If already saturated
Extreme weather (surfaces baked hard vs frozen)
Type of precipitation (snow vs rain)fc
Human factors affecting hydrograph steepness (not covered in GCSE)
Deforestation = increased soil erosion = channel sedimentation = reduced bankfull capacity
Creating furrows that run directly downslope
Ploughing wet soils = creates (impermeable) plough pans which inhibit percolation
Abstraction = reduced base flow
Severe Storms e.g. Storm Desmond, UK (2015 - 2016)
Increased precipitation (341.4mm in 24h) > saturated ground > increased SR > greater discharge/flood risk
Increased prec. > higher velocity of SR (due to upland gradient) > increased FR
Increased surface storage > more water for human use > water surplus
Increased speed of SR > increased soil erosion (from upland areas) > silting up river > reduced river capacity > increased FR
Droughts e.g. Californian Drought (2012 - 2017)
*Reduced prec. [deficit: 100% - 180% of annual rainfall] > increased soil capacity > reduced discharge > reduced FR
Reduced prec. > drier soils > more soil erosion etc. (however hard/baked soils > decreased infiltration rate > increased SR etc.)
*Reduced prec. > reduced surface storage > less water for human use > water deficit
El Niño (CS Detail only)
Cause: reduced trade winds & reduced upwelling of cold water > increased ocean temperatures
Consequences:
Floods: Peru/Ecuador
Droughts: India/Indonesia
Hot: Canada
Cold: South US
Deforestation: The Amazon/Indonesian Rainforest
Reduced interception storage > increased SR
Reduced ETP > reduced precipitation > drier soils > increased soil erosion > increased soil transferred to rivers > reduced discharge capacity of river
However, reduced ETP > reduced precipitation > reduced SR
Positive feedback: reduced ETP > reduced precipitation > reduced water storage in system > reduced ETP (etc.)
CS Detail (Amazon):
25% of world’s river discharge
Rapid deforestation (<20% deforested, <40% deforested & degraded) in last 50 years
CS Detail (Indonesia):
Reduced prec. over Indonesia > reduced prec. of summer monsoon season (which travels north) > water shortages across South Asia
Eutrophication
Excessive richness of nutrients of a body of water, causing a dense growth of plant life.
Soil Drainage in the UK
Soil compaction > reduced infiltration > increased (artificial) throughflow > increased discharge
Drier soils > increased soil erosion > increased soil transferred to rivers (via overland flow) > reduced discharge capacity of river
Increased soil erosion > increased eutrophication > reduced water quality
Water Abstraction from the Chalk of Southern England
Reduced groundwater storage = reduced discharge
Lowers water table
CS Detail:
South-east England’s main water supply: big aquifer under London
Recharged by upland areas: during winter when ETP low
London expansion: decreased recharge effectiveness (urbanisation) = increased discharge
Water Abstraction in the London Basin (CS Detail only)
Historical source which uses wells/boreholes (machine-drilled wells)
Peak (1960s): water table dropped to 88m below sea-level
Therefore increased risk of saline intrusion > water unusable
Abstraction: decreased discharge in River Thames
Factory relocation: water table rose 3m/year
Central/East London (since 2000): groundwater levels decreased by 5-7m
Monitored by General Aquifer Research Department & Development team to manage abstraction